I am stuck on these questions. I forgot how to do them. Please explain them to in a detail way so I can how to do it on my own.
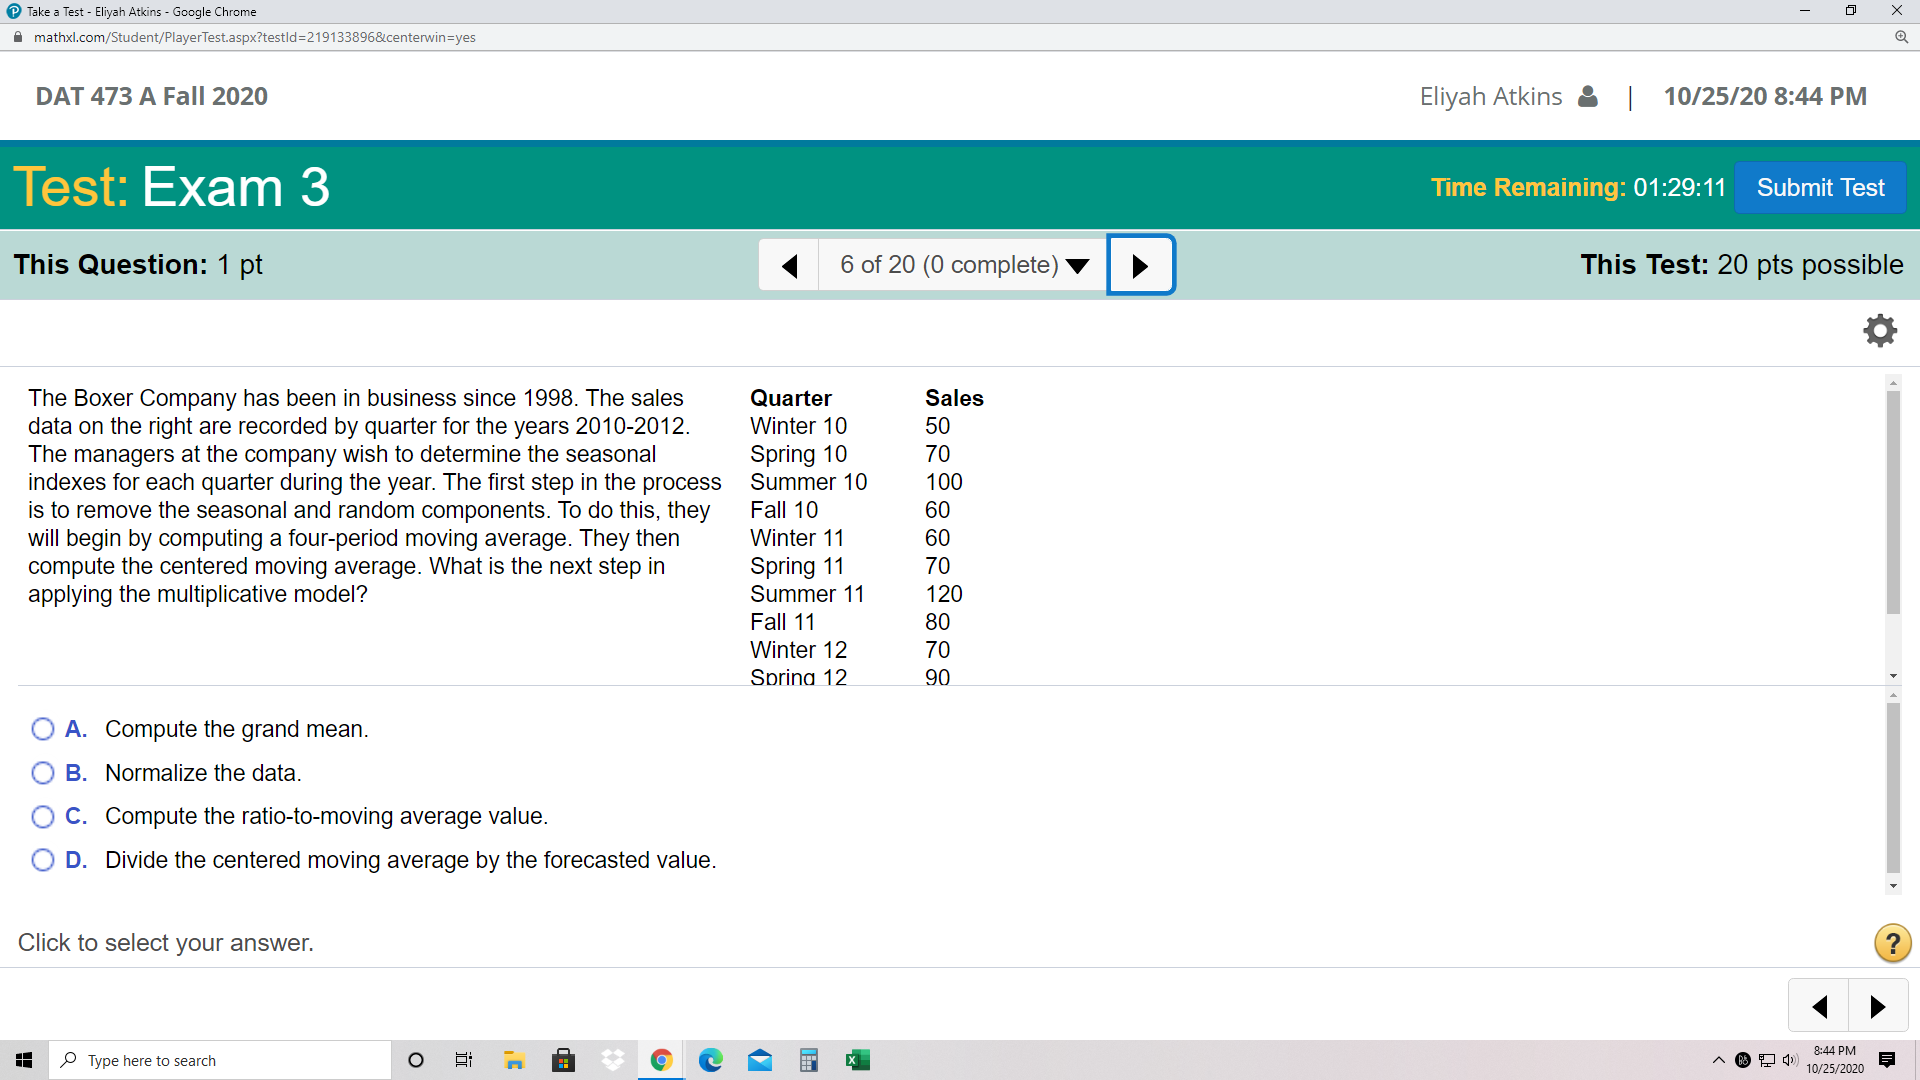
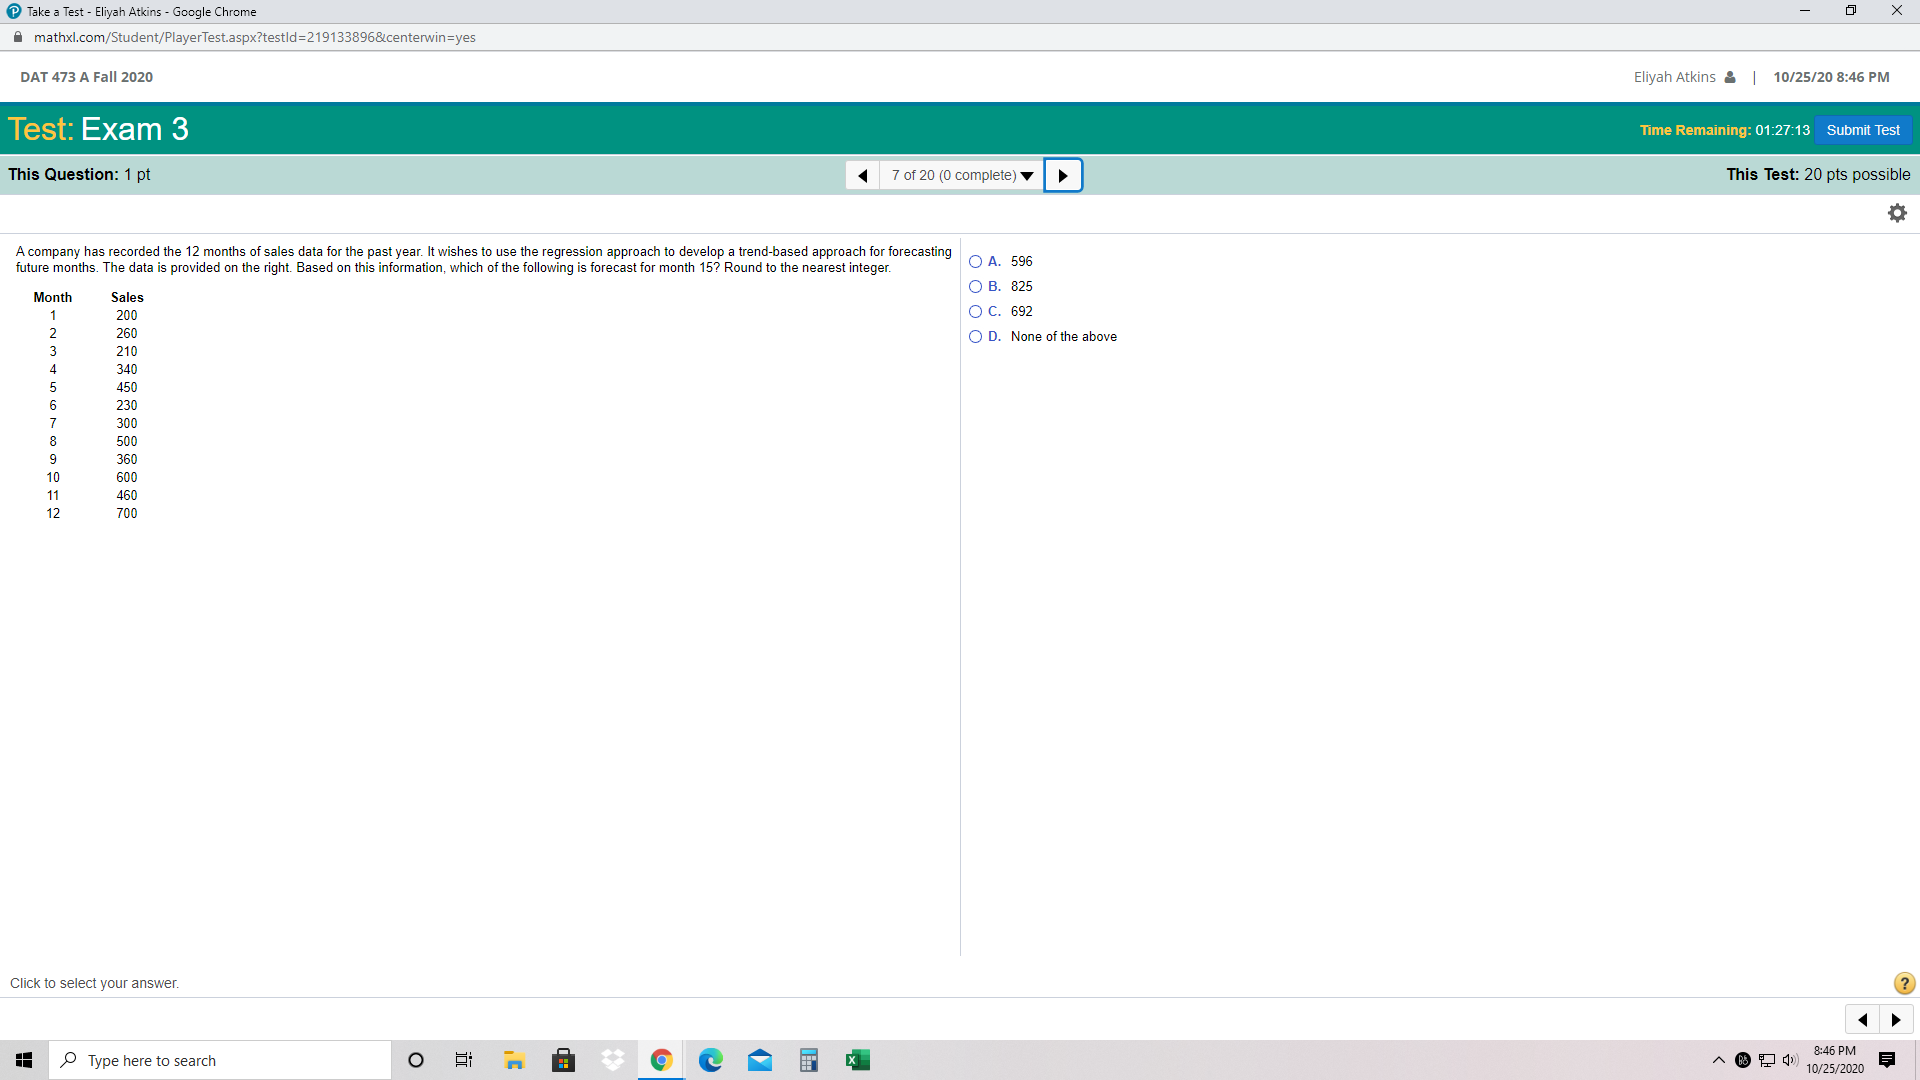
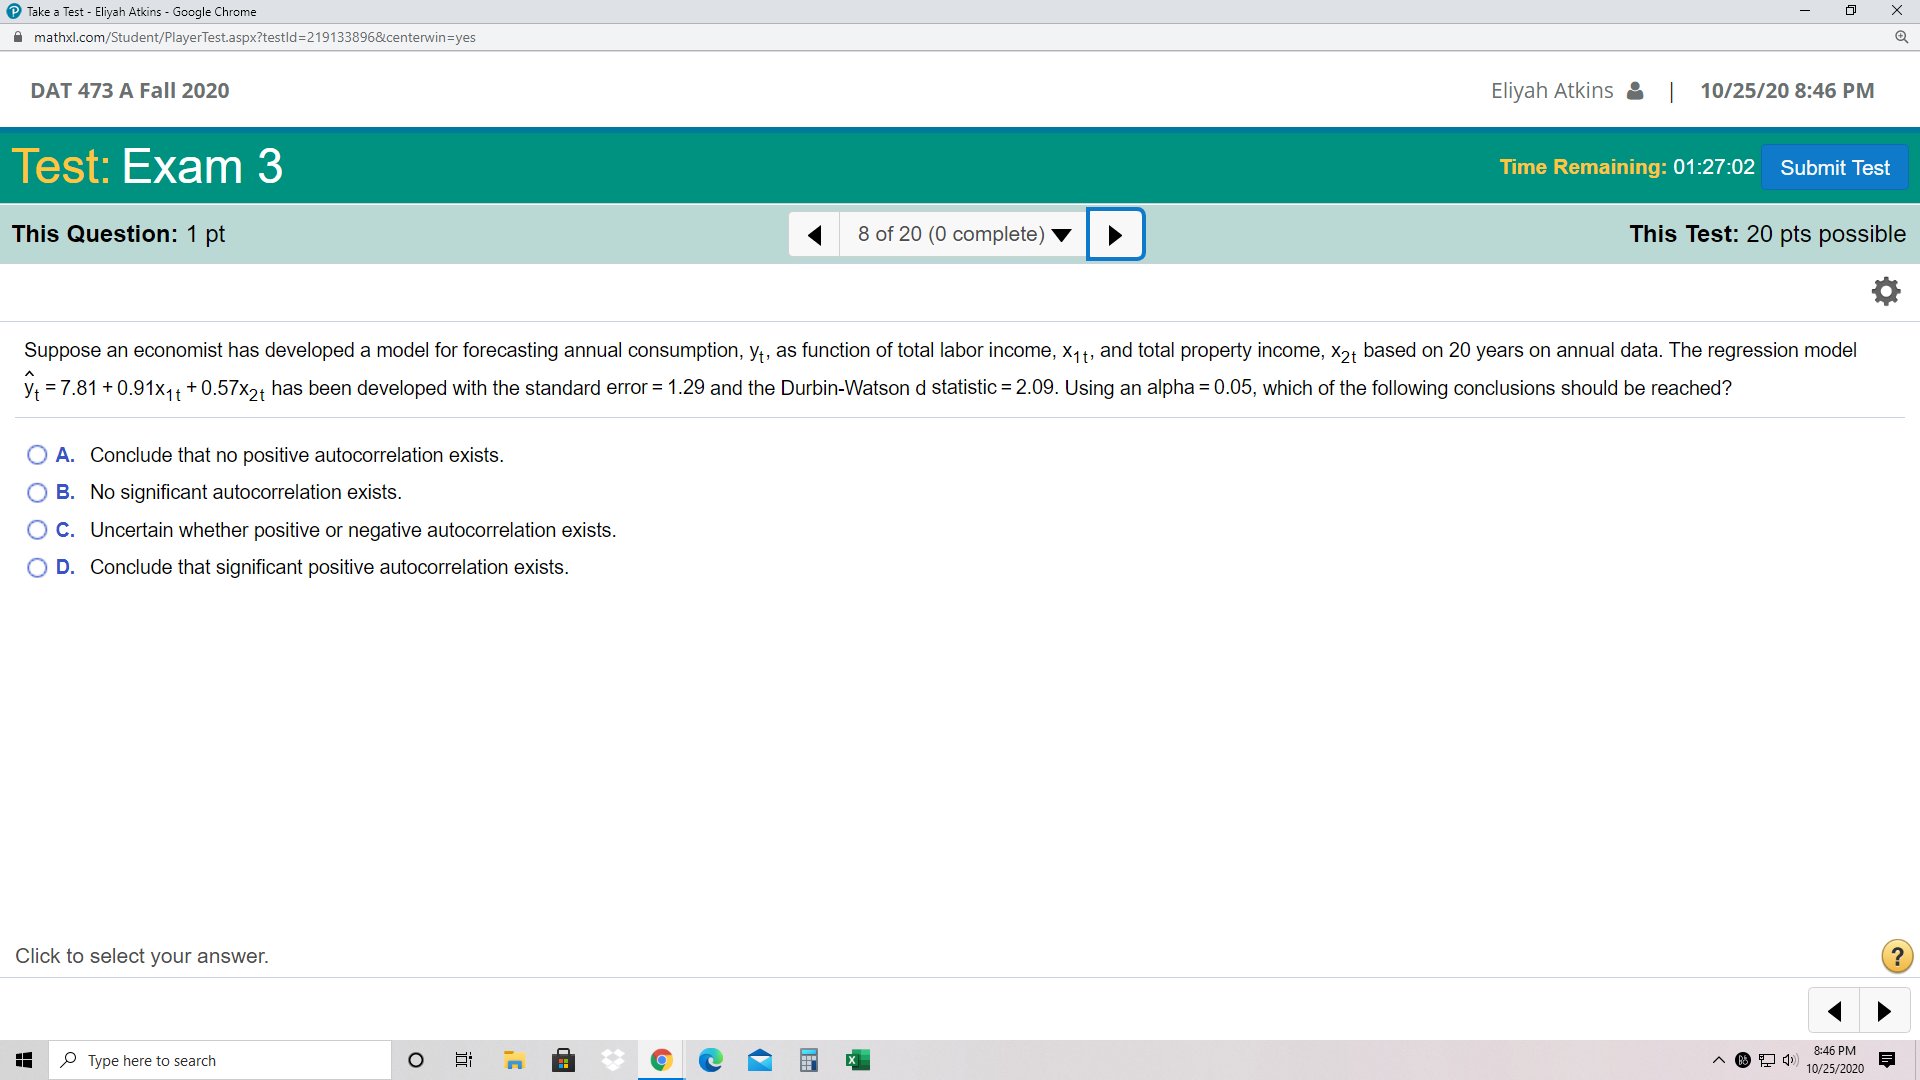
9 1m 3 rm . aim. Add-us . Gougle Chmme , x a mathxlcom[Student/Playsr'lesl.aspx?lsstld:219133E59651c9nlerwm :yes DAT 473 A Fall 2020 Eliyah Atkins & | 10/25/20 8:44 PM Test: Exam 3 Time Remaining: 01:29:11 Submit Test This Question: 1 pt The Boxer Company has been in business since 1998. The sales Quarter data on the right are recorded by quarter for the years 20102012. Winter 10 The managers at the company wish to determine the seasonal Spring 10 indexes for each quarter during the year. The first step in the process Summer 10 is to remove the seasonal and random components. To do this, they Fall 10 will begin by computing a fourperiod moving average. They then Winter 11 compute the centered moving average. What is the next step in Spring 11 applying the multiplicative model? Summer 11 Fall 11 Winter 12 Spring 12 O A. Compute the grand mean. 0 B. Normalize the data. 0 C. Compute the ratiotomoving average value. 0 D. Divide the centered moving average by the forecasted value. Click to select your answer. :: P Type hereto Search 0 E 'n a f e a E I { 6 of 20 (0 complete) V E] This Test: 20 pts possible 43 Sales 50 70 100 60 60 70 120 80 70 90 4 A.Edt).$w;:n E' Take a Test - Eliyah Atkins - Google Chrome X mathxl.com/Student/PlayerTest.aspx?testld=219133896¢erwin=yes DAT 473 A Fall 2020 Eliyah Atkins & | 10/25/20 8:46 PM Test: Exam 3 Time Remaining: 01:27:13 Submit Test This Question: 1 pt 7 of 20 (0 complete) This Test: 20 pts possible A company has recorded the 12 months of sales data for the past year. It wishes to use the regression approach to develop a trend-based approach for forecasting future months. The data is provided on the right. Based on this information, which of the following is forecast for month 15? Round to the nearest integer. O A. 596 Month Sales O B. 825 200 O C. 692 WN 260 O D. None of the above 210 340 450 230 300 500 360 600 460 700 Click to select your answer. ? Type here to search 8:46 PM 10/25/2020Take a Test - Eliyah Atkins - Google Chrome X mathxl.com/Student/PlayerTest.aspx?testld=2191338968centerwin=yes DAT 473 A Fall 2020 Eliyah Atkins & | 10/25/20 8:46 PM Test: Exam 3 Time Remaining: 01:27:02 Submit Test This Question: 1 pt 8 of 20 (0 complete) This Test: 20 pts possible Suppose an economist has developed a model for forecasting annual consumption, y, as function of total labor income, X1t, and total property income, X2t based on 20 years on annual data. The regression model yt =7.81+0.91X1+ + 0.57X2t has been developed with the standard error = 1.29 and the Durbin-Watson d statistic = 2.09. Using an alpha = 0.05, which of the following conclusions should be reached? O A. Conclude that no positive autocorrelation exists. O B. No significant autocorrelation exists. O C. Uncertain whether positive or negative autocorrelation exists. O D. Conclude that significant positive autocorrelation exists. Click to select your answer. ? Type here to search 8:46 PM 10/25/2020


