

Question
I am taking a Financial Statement Analysis class and the book the class is using is Financial Statement Analysis, 10e. Can someone tell me how
 I am taking a Financial Statement Analysis class and the book the class is using is Financial Statement Analysis, 10e. Can someone tell me how to figure out how to calculate Exercise 9-2 from chapter 9? I don't know where to start.
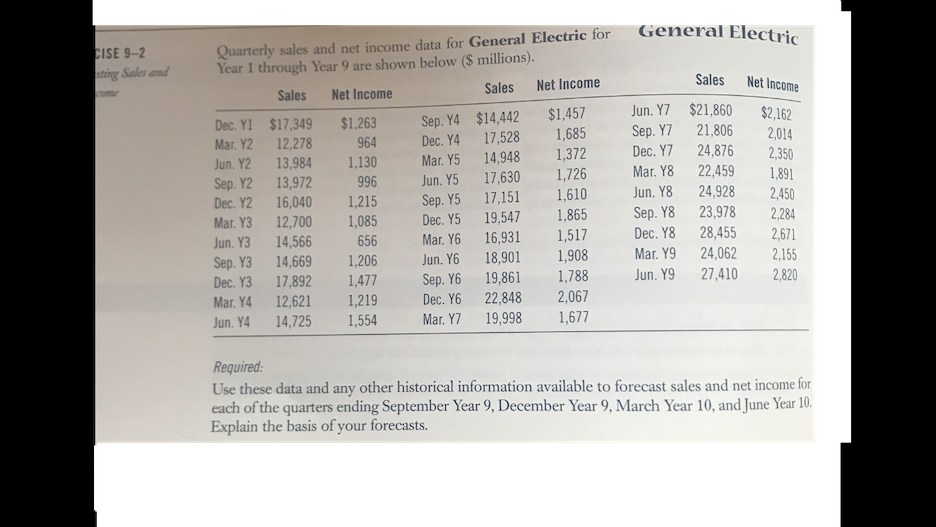
General Elect CISE 9-2 ning Sales and Sales Net Income $2,162 2,014 2,350 1,891 Quarterly sales and net income data for General Electric for Year 1 through Year 9 are shown below ($ millions). Net Income Sales Sales Net Income Dec. Y1 $1,457 $17,349 Sep. Y4 $1,263 $14,442 Mar. Y2 1,685 12,278 Dec. Y4 964 17,528 Jun. Y2 1.130 13,984 1,372 Mar. Y5 14,948 Sep. Y2 13,972 996 Jun. Y5 17,630 1,726 Dec. Y2 16,040 1,215 Sep. Y5 17,151 1,610 Mar. Y3 1,085 12,700 Dec. Y5 1,865 19,547 Jun. Y3 14,566 656 Mar. Y6 16,931 1,517 Sep. Y3 14,669 1,206 Jun. Y6 18,901 1,908 Dec. Y3 17.892 1,477 Sep. Y6 19,861 1,788 Mar. Y4 12,621 1,219 Dec. Y6 22,848 2,067 Jun. Y4 14,725 1,554 Mar. Y7 19,998 1,677 Jun. Y7 $21,860 Sep. Y7 21,806 Dec. Y7 24,876 Mar. Y8 22,459 Jun. Y8 24,928 Sep. Y8 23,978 Dec. Y8 28,455 Mar. Y9 24,062 Jun. Y927,410 2,450 2,284 2,671 2,155 2,820 Required: Use these data and any other historical information available to forecast sales and net income for each of the quarters ending September Year 9, December Year 9, March Year 10, and June Year 10. Explain the basis of your forecasts. General Elect CISE 9-2 ning Sales and Sales Net Income $2,162 2,014 2,350 1,891 Quarterly sales and net income data for General Electric for Year 1 through Year 9 are shown below ($ millions). Net Income Sales Sales Net Income Dec. Y1 $1,457 $17,349 Sep. Y4 $1,263 $14,442 Mar. Y2 1,685 12,278 Dec. Y4 964 17,528 Jun. Y2 1.130 13,984 1,372 Mar. Y5 14,948 Sep. Y2 13,972 996 Jun. Y5 17,630 1,726 Dec. Y2 16,040 1,215 Sep. Y5 17,151 1,610 Mar. Y3 1,085 12,700 Dec. Y5 1,865 19,547 Jun. Y3 14,566 656 Mar. Y6 16,931 1,517 Sep. Y3 14,669 1,206 Jun. Y6 18,901 1,908 Dec. Y3 17.892 1,477 Sep. Y6 19,861 1,788 Mar. Y4 12,621 1,219 Dec. Y6 22,848 2,067 Jun. Y4 14,725 1,554 Mar. Y7 19,998 1,677 Jun. Y7 $21,860 Sep. Y7 21,806 Dec. Y7 24,876 Mar. Y8 22,459 Jun. Y8 24,928 Sep. Y8 23,978 Dec. Y8 28,455 Mar. Y9 24,062 Jun. Y927,410 2,450 2,284 2,671 2,155 2,820 Required: Use these data and any other historical information available to forecast sales and net income for each of the quarters ending September Year 9, December Year 9, March Year 10, and June Year 10. Explain the basis of your forecasts
Step by Step Solution
There are 3 Steps involved in it
Step: 1

Get Instant Access to Expert-Tailored Solutions
See step-by-step solutions with expert insights and AI powered tools for academic success
Step: 2

Step: 3
Ace Your Homework with AI
Get the answers you need in no time with our AI-driven, step-by-step assistance
Get Started
Value Investing
Authors: Mike Hartley
1st Edition
979-8864443309