

Question
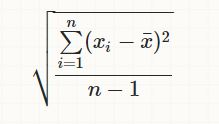
I am trying to build a Technical indicator(Standard Deviation/Volatility) for finacial modeling(trading) using Programming in R. Some information/calculations/algorithm on the Standard Deviation technical indicator is
I am trying to build a Technical indicator(Standard Deviation/Volatility) for finacial modeling(trading) using "Programming in R".
Some information/calculations/algorithm on the Standard Deviation technical indicator is given below:
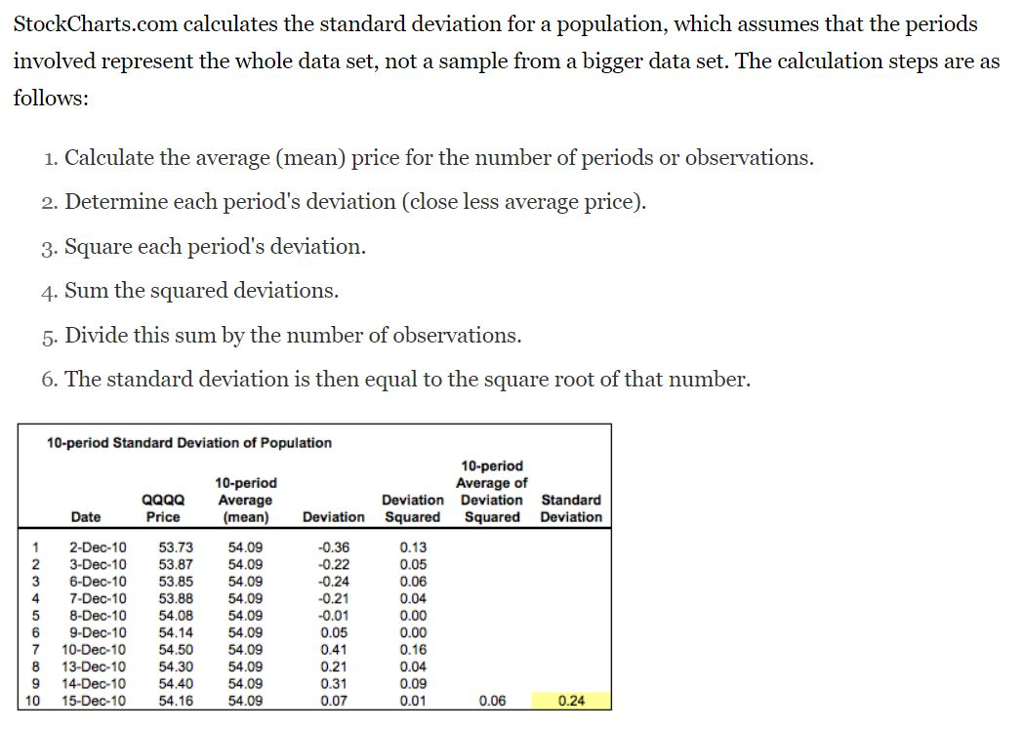
The spreadsheet above shows an example for a 10-period standard deviation using QQQQ data. Notice that the 10-period average is calculated after the 10th period and this average is applied to all 10 periods.
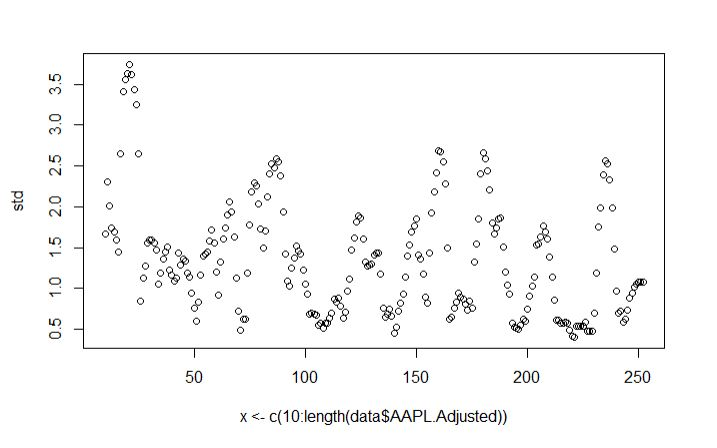
For my example, I am trying to plot apple("APPL") stock data's standard deviation, using the above algorithm provided.
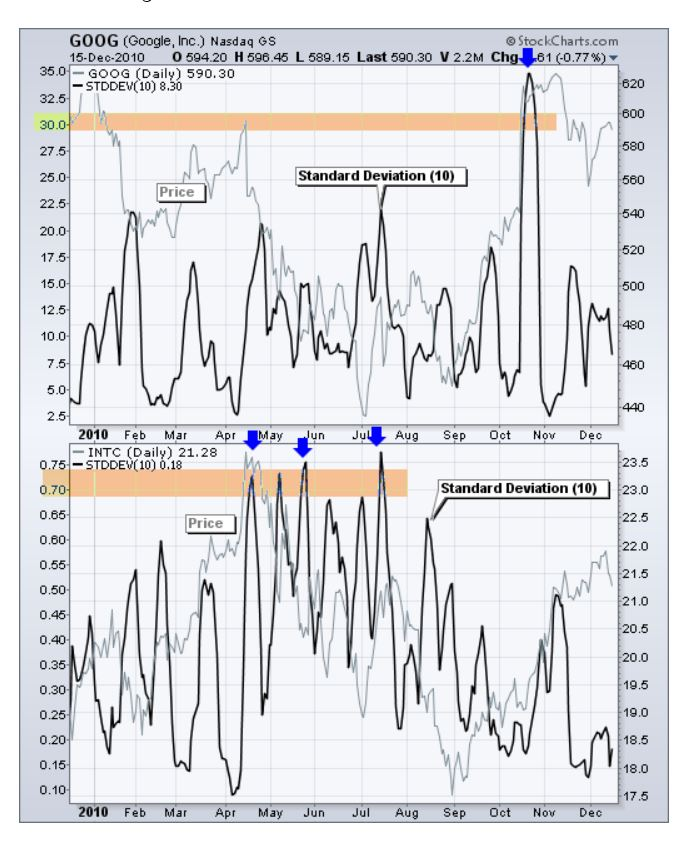
Below is an example plot of google stock data standard deviation. I want to be able to create such a plot.
For this particular example, our professor has asked us to use the built-in functions such as [sd] sparingly i.e. only if not able to write the function ourselves.
A graduate friend of mine has written the code for me and here it is:
```{r} library(quantmod) ```
```{r} data
```{r}
list
x
array_new
```
```{r}
plot(x
```
*I would like to understand how the "BOLD" code is working line-by line and why the paricular functions such as length, lapply, rep were used.
*Is it possible to do this without making it in the form of a list and how to get the output in the form of a data table instead of a list/array.
*Also, how should I get the line plot instead of scatter plot.
*Is there another way of doing this code without using loops and how ?
*Any changes to the code to make it closer to the above google example would be appreciated and if the code is wrong or erraneous, help with writing a new one from the "Calculations" / algorithm I provided above would be very much appreciated.
Step by Step Solution
There are 3 Steps involved in it
Step: 1

Get Instant Access to Expert-Tailored Solutions
See step-by-step solutions with expert insights and AI powered tools for academic success
Step: 2

Step: 3
Ace Your Homework with AI
Get the answers you need in no time with our AI-driven, step-by-step assistance
Get Started
Database Design Application Development And Administration
Authors: Michael V. Mannino
3rd Edition
0071107010, 978-0071107013