Answered step by step
Verified Expert Solution
Question
1 Approved Answer
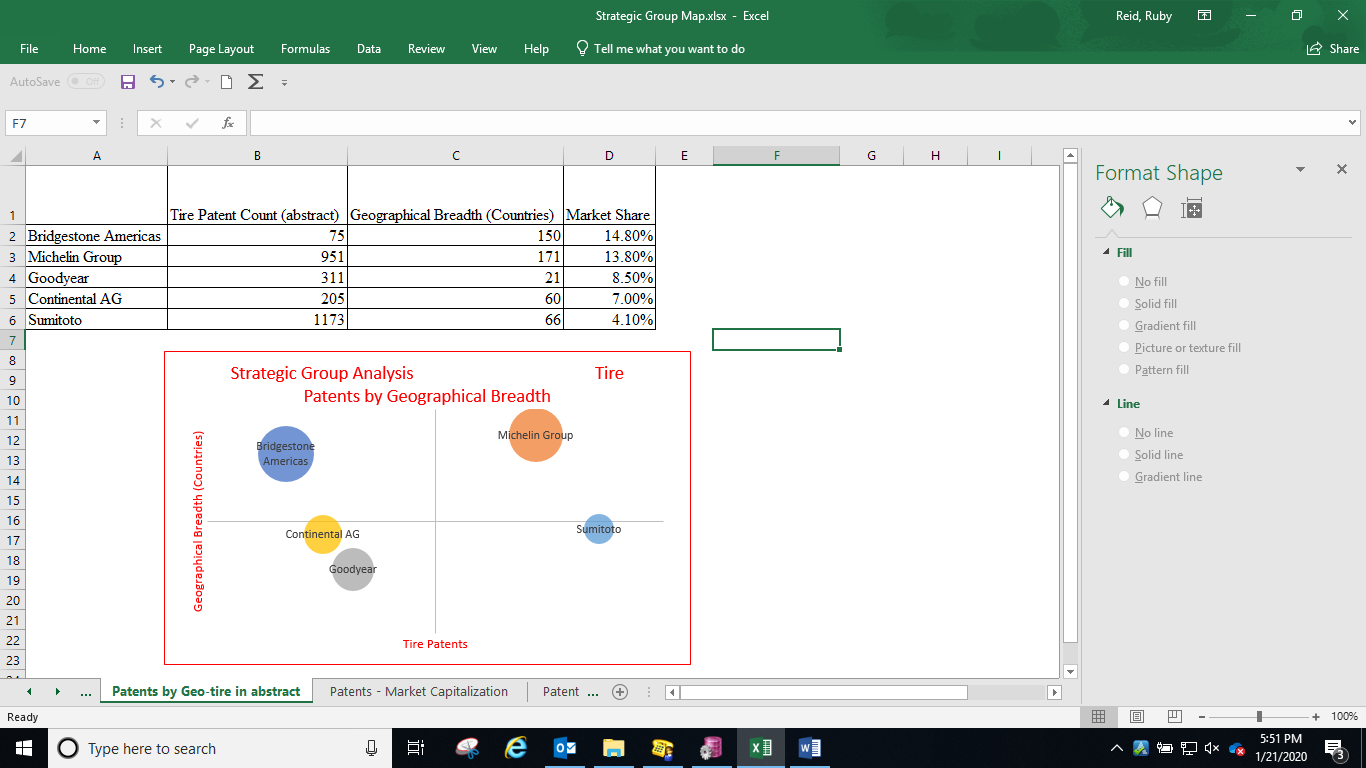
I am trying to explain to the best of my ability what this strategic map shows. It's a patent count by geographical breadth for five
I am trying to explain to the best of my ability what this strategic map shows. It's a patent count by geographical breadth for five companies. I get how the placement mapped, but when I explain it, is it because the number of patents, with fewer countries, makes for a low "bubble".. I am confused the best way to explain the result of the map that I got. I am adding a picture... Am I on the right track for explaining the map itself?

Step by Step Solution
There are 3 Steps involved in it
Step: 1

Get Instant Access to Expert-Tailored Solutions
See step-by-step solutions with expert insights and AI powered tools for academic success
Step: 2

Step: 3

Ace Your Homework with AI
Get the answers you need in no time with our AI-driven, step-by-step assistance
Get Started


