Question
I am trying to figure out how to answer the following questions about results and discussion. I am just assuming it is referring to each
I am trying to figure out how to answer the following questions about results and discussion. I am just assuming it is referring to each table or diagram, but I am not sure and I am not sure what they mean.
This will be the final part of the development of your Key Assignment.
Consider the following information:
RESEARCH REPORT #2 (These data are all artificial in relation to (Type A) personalities.)
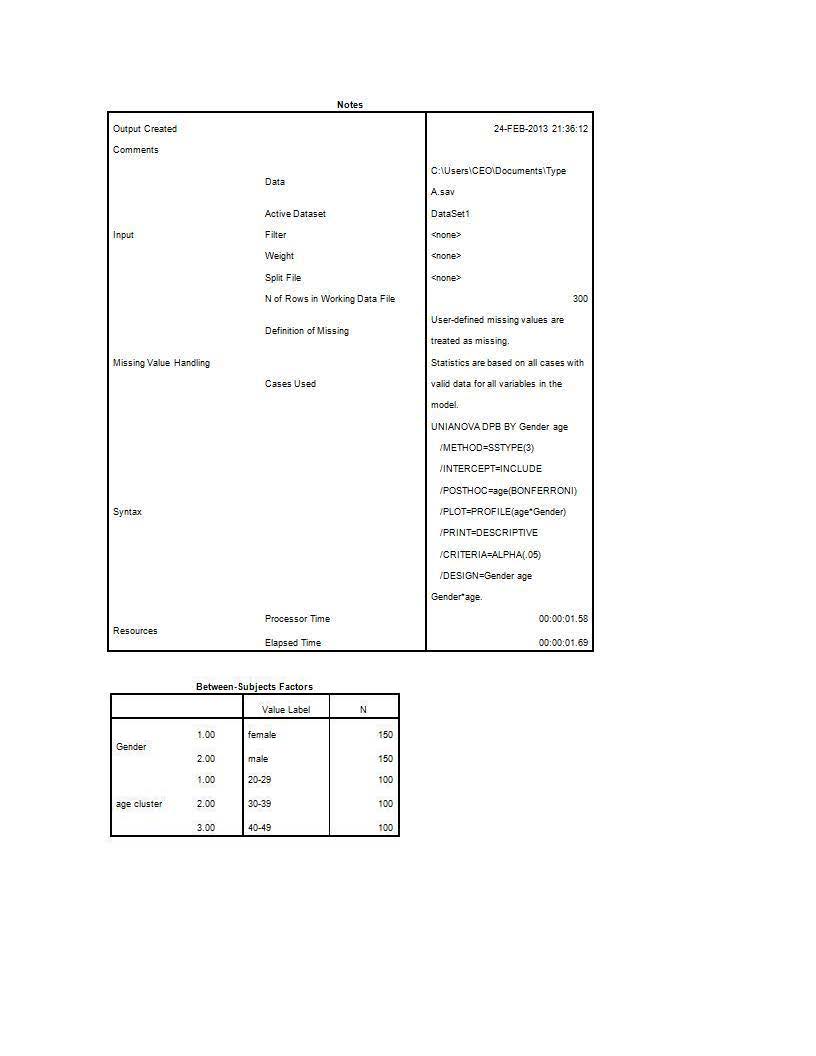
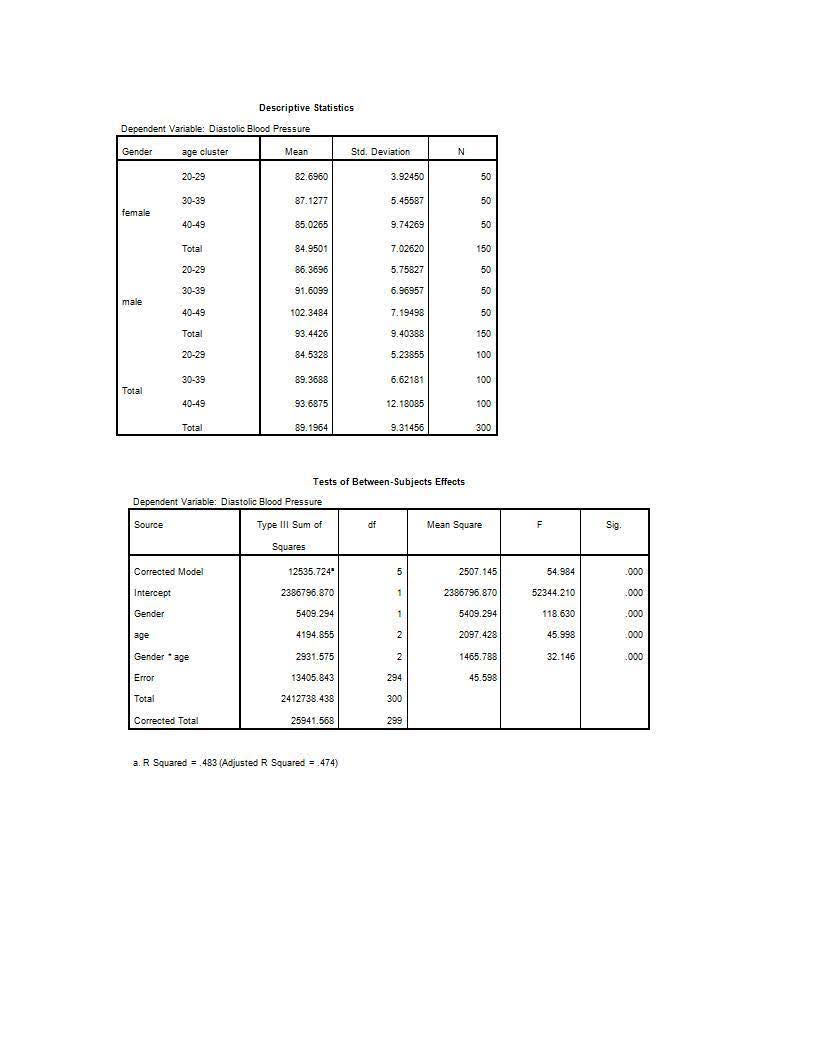
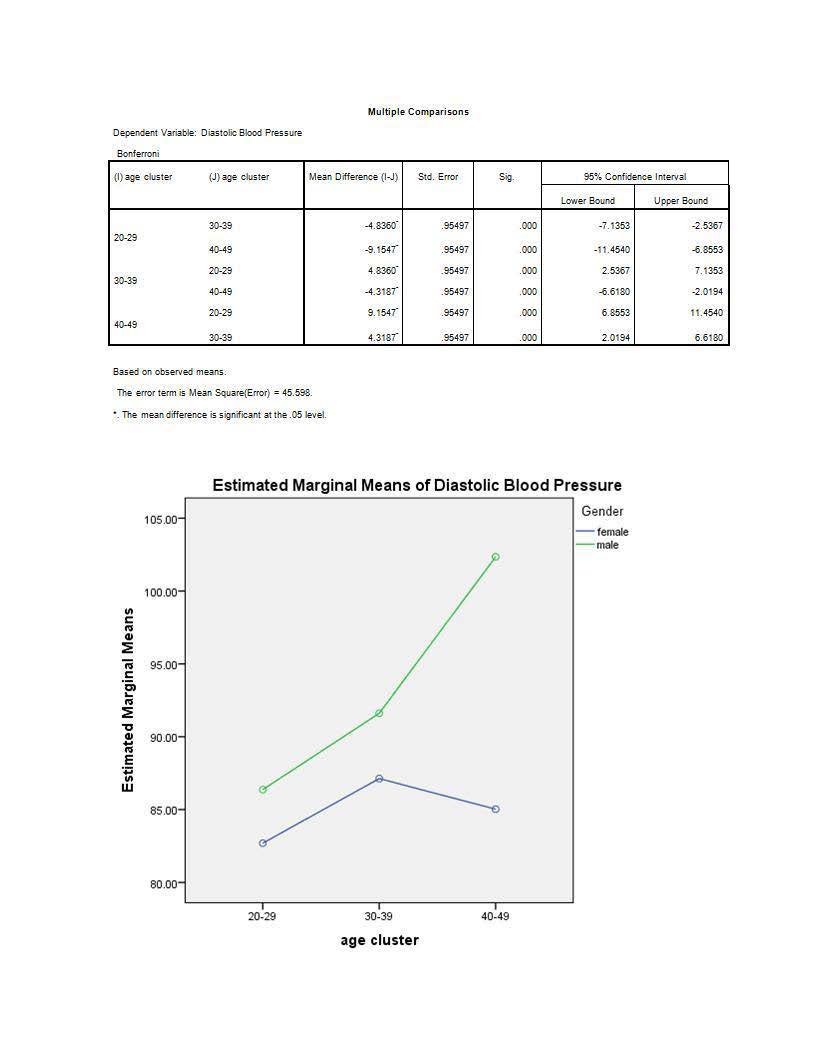
Assume that the subject population for whom data are reported are all (Type A) personalities. The hypotheses being tested were 1) whether there was a difference in DBP risk as a function of increasing age, 2) whether there was a difference in DBP as function of gender, 3) Whether (Type A) men and women show the same pattern of DPB across age groups. This brings in the possibility of a statistical interaction.
The data are below. I have included a graph of the Age by Gender means. I think it will give you a good visual indicator of what is going on in the interaction.
You don't need to include a methods section, but should write up Results and Discussion sections addressing the hypotheses above. Your Results write up must contain APA statistical notation when discussing the test results you have been given. As usual, you can go to outside resources to develop the Discussion section. Be sure that you include a References section.


Step by Step Solution
There are 3 Steps involved in it
Step: 1

Get Instant Access to Expert-Tailored Solutions
See step-by-step solutions with expert insights and AI powered tools for academic success
Step: 2

Step: 3

Ace Your Homework with AI
Get the answers you need in no time with our AI-driven, step-by-step assistance
Get Started


