Answered step by step
Verified Expert Solution
Link Copied!

Question

1 Approved Answer

I am trying to help my son with homework and I really need help understanding this one please. It is question 2 Respectfully, Tiffany 5:23
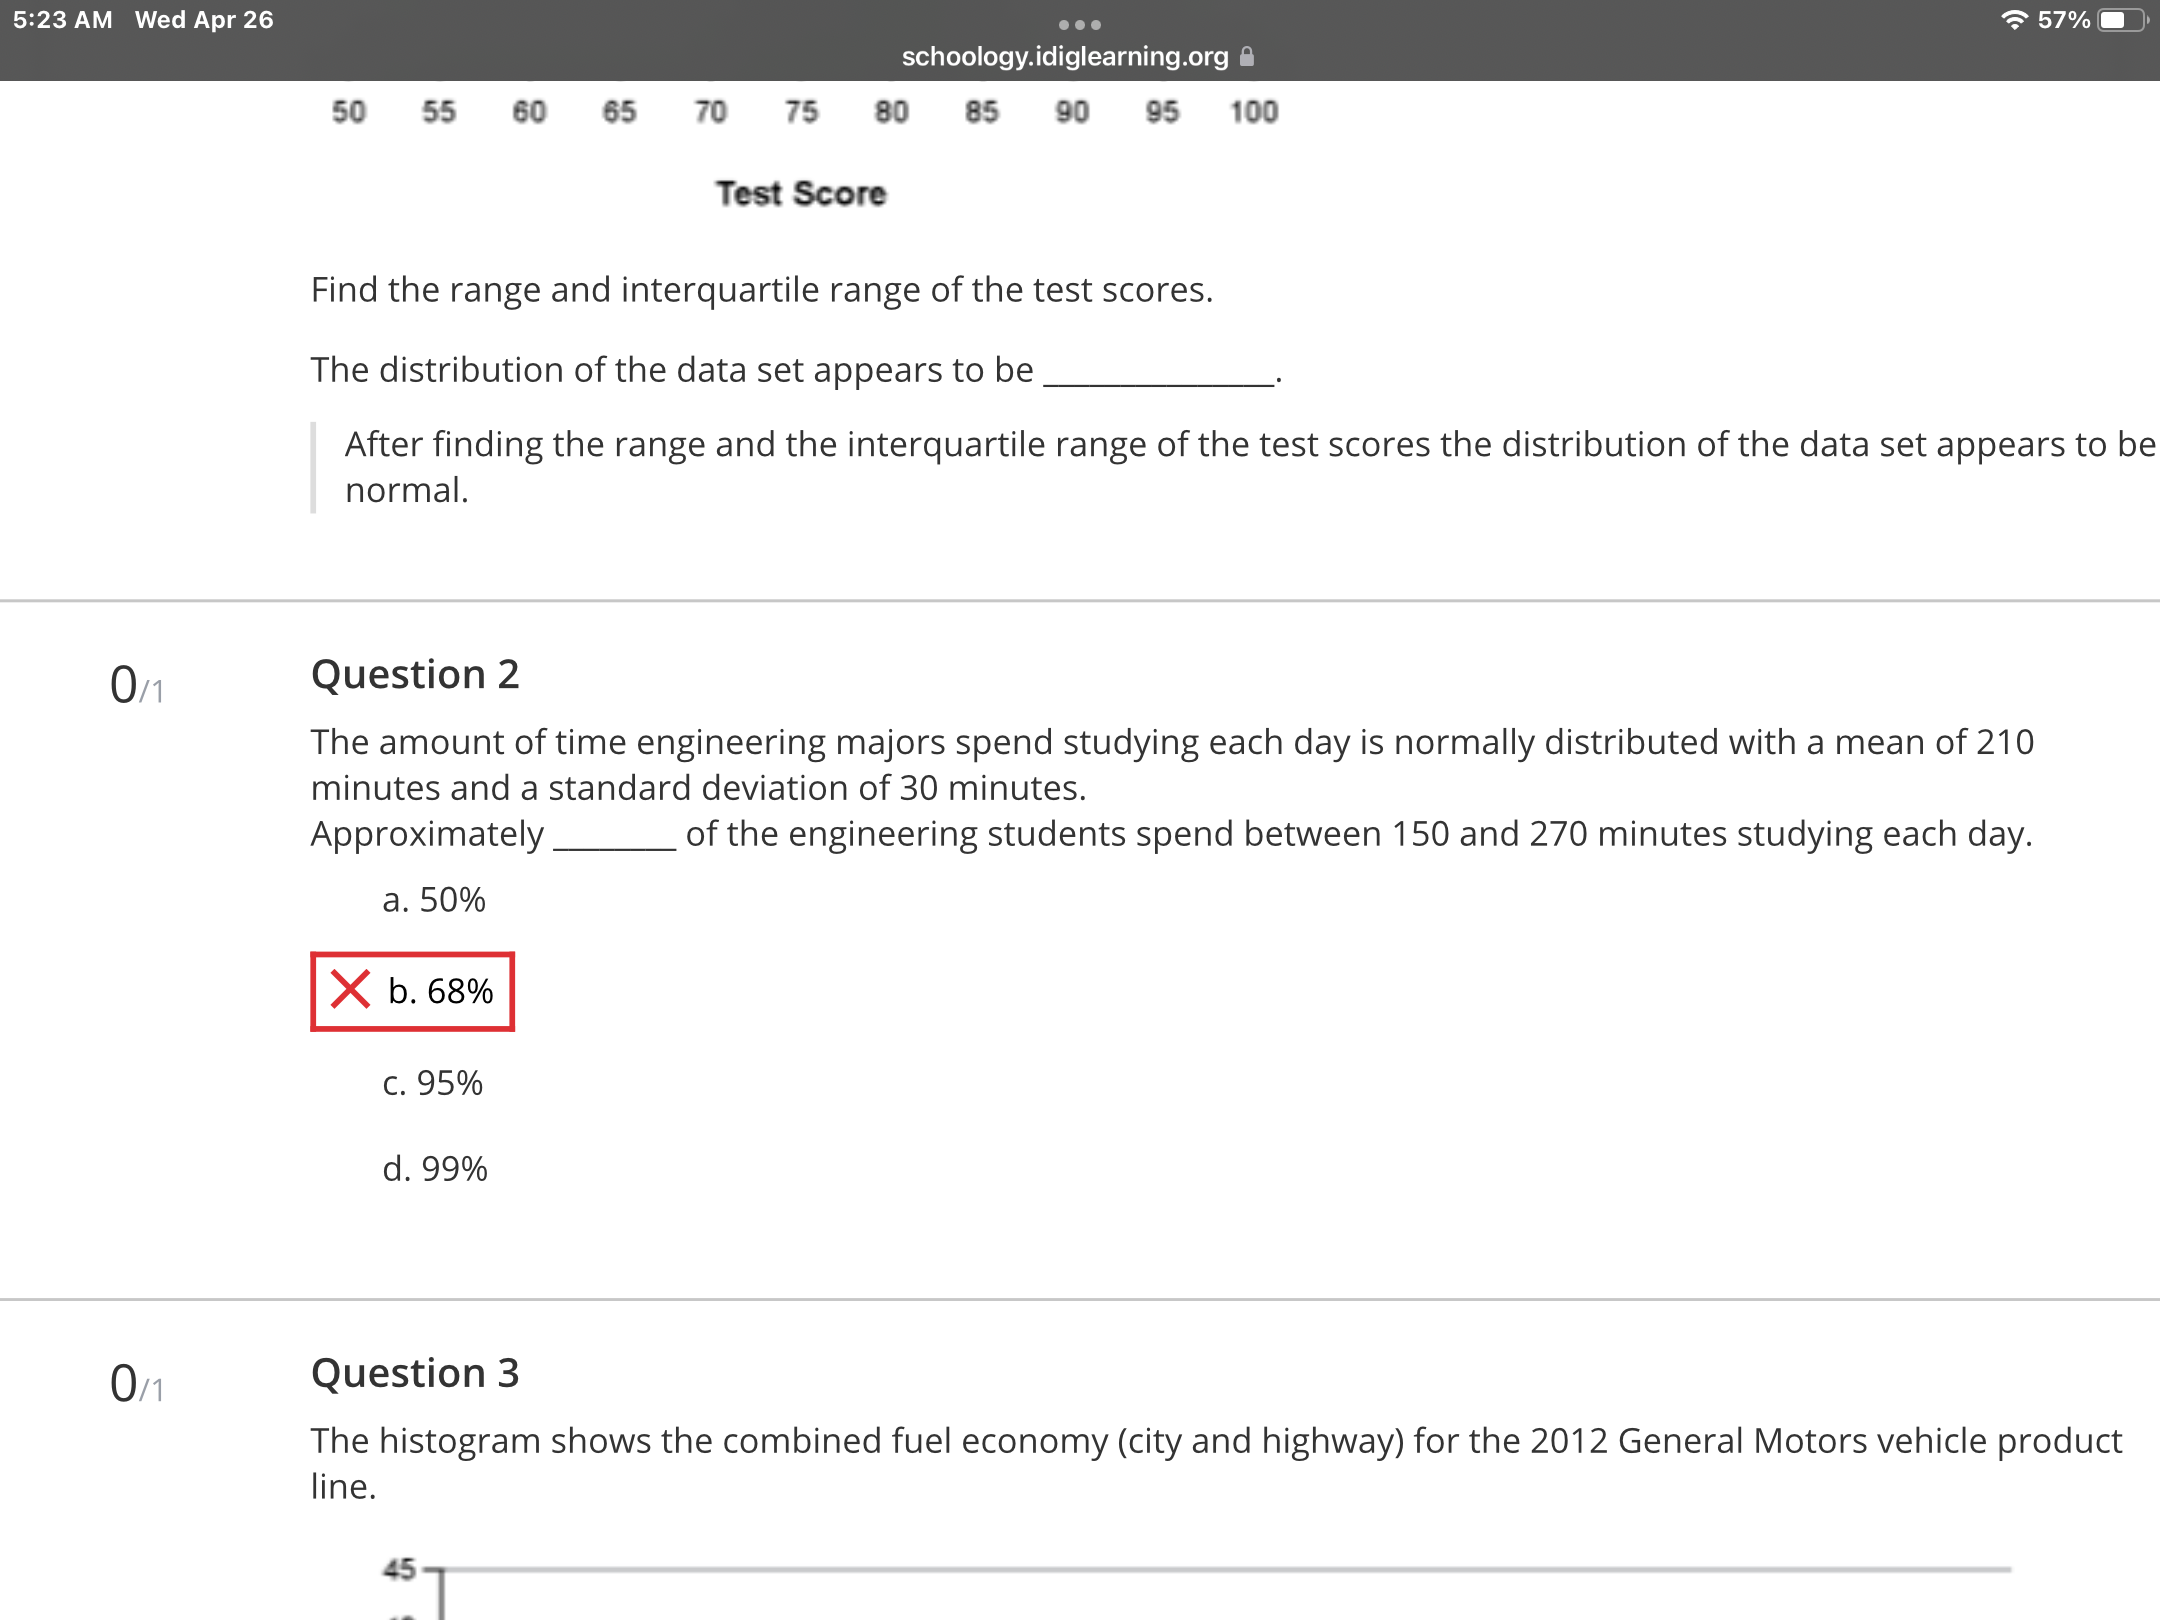
I am trying to help my son with homework and I really need help understanding this one please. It is question 2

Respectfully,

Tiffany

image text in transcribed
5:23 AM Wed Apr 26 57% schoology.idiglearning.org a 50 55 60 65 70 75 80 85 90 95 100 Test Score Find the range and interquartile range of the test scores. The distribution of the data set appears to be After finding the range and the interquartile range of the test scores the distribution of the data set appears to be normal. 0/1 Question 2 The amount of time engineering majors spend studying each day is normally distributed with a mean of 210 minutes and a standard deviation of 30 minutes. Approximately of the engineering students spend between 150 and 270 minutes studying each day. a. 50% X b. 68% c. 95% d. 99% 0/1 Question 3 The histogram shows the combined fuel economy (city and highway) for the 2012 General Motors vehicle product line

Step by Step Solution

There are 3 Steps involved in it

Step: 1

blur-text-image

Get Instant Access to Expert-Tailored Solutions

See step-by-step solutions with expert insights and AI powered tools for academic success

Step: 2

blur-text-image

Step: 3

blur-text-image

Ace Your Homework with AI

Get the answers you need in no time with our AI-driven, step-by-step assistance

Get Started

Recommended Textbook for

An Introduction to Measure Theoretic Probability

Authors: George G. Roussas

2nd edition

128000422, 978-0128000427

More Books

Students also viewed these Mathematics questions