

Question
I am trying to learn about the normal distribution and using python and a udemy course to help. I have two tiny codes I's like
I am trying to learn about the normal distribution and using python and a udemy course to help. I have two tiny codes I's like help distinguishing the difference between the two. Could you explain both graphs and what is going on? the second one is confusing. what is pdf doing. i thought you couldn't find the probabiliy of a single number (should be 0?)Please explain what is going on in code and be prepared for follow up question just in case
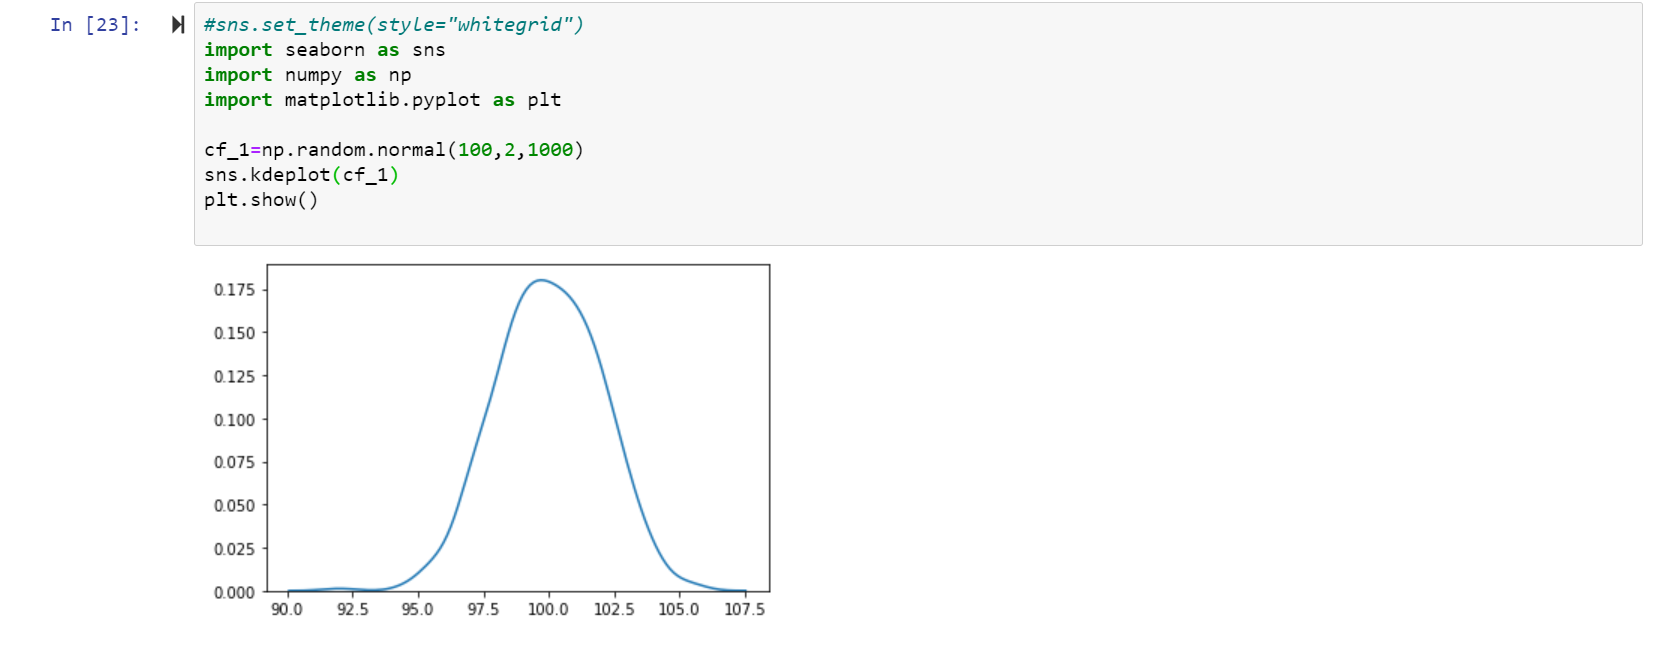
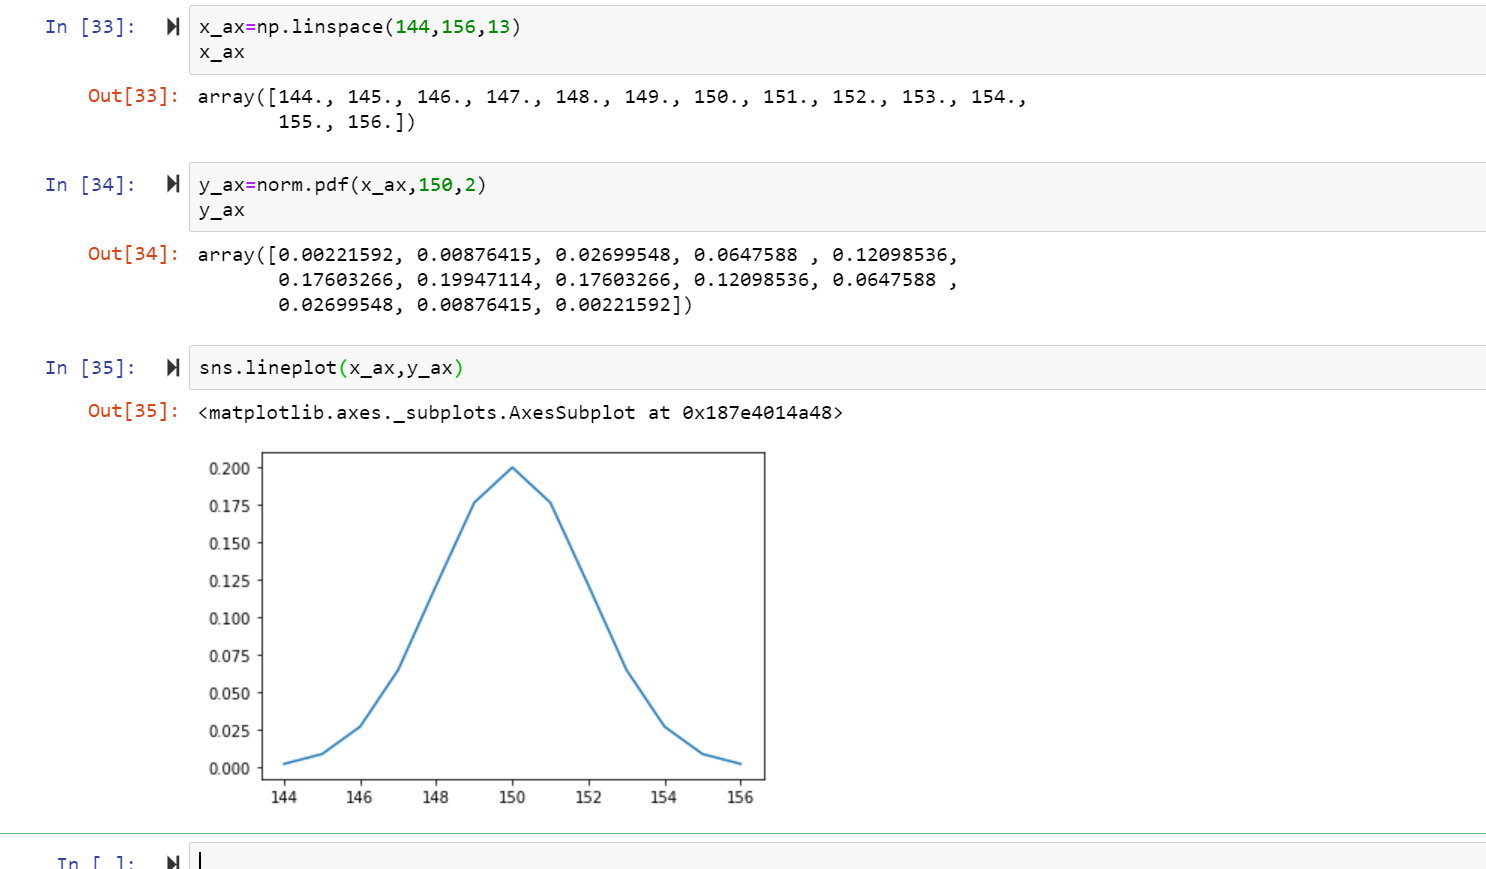
In [23]: #sns.set_theme(style="whitegrid") import seaborn as sns import numpy as np import matplotlib.pyplot as plt cf_1=np.random.normal(100,2,1000) sns.kdeplot(cf_1) plt.show() 0.175 0.150 0.125 0.100 0.075 0.050 0.025 0.000 90.0 92.5 95.0 97.5 100.0 102.5 105.0 107.5 In [33]: Nx_ax=np.linspace(144,156,13) X_ax . Out[33]: array([144., 145., 146., 147., 148., 149., 150., 151., 152., 153., 154., 155., 156.]) In [34]: y_ax=norm.pdf(x_ax, 150,2) y_ax Out[34]: array([0.00221592, 0.00876415, 0.02699548, 0.0647588 0.12098536, 0.17603266, 0.19947114, 0.17603266, 0.12098536, 0.0647588 0.02699548, 0.00876415, 0.00221592]) In [35]: sns.lineplot(x_ax,y_ax) Out[35]:
Step by Step Solution
There are 3 Steps involved in it
Step: 1

Get Instant Access to Expert-Tailored Solutions
See step-by-step solutions with expert insights and AI powered tools for academic success
Step: 2

Step: 3
Ace Your Homework with AI
Get the answers you need in no time with our AI-driven, step-by-step assistance
Get Started
Business Process Driven Database Design With Oracle PL SQL
Authors: Rajeev Kaula
1st Edition
1795532386, 978-1795532389