

Question
I am trying to make a histogram from this infromation instead of a plot graph that I already have. I would like one bar for
I am trying to make a histogram from this infromation instead of a plot graph that I already have. I would like one bar for each year. I have included my entire code and the output that I am given. Please do it in python! Thanks!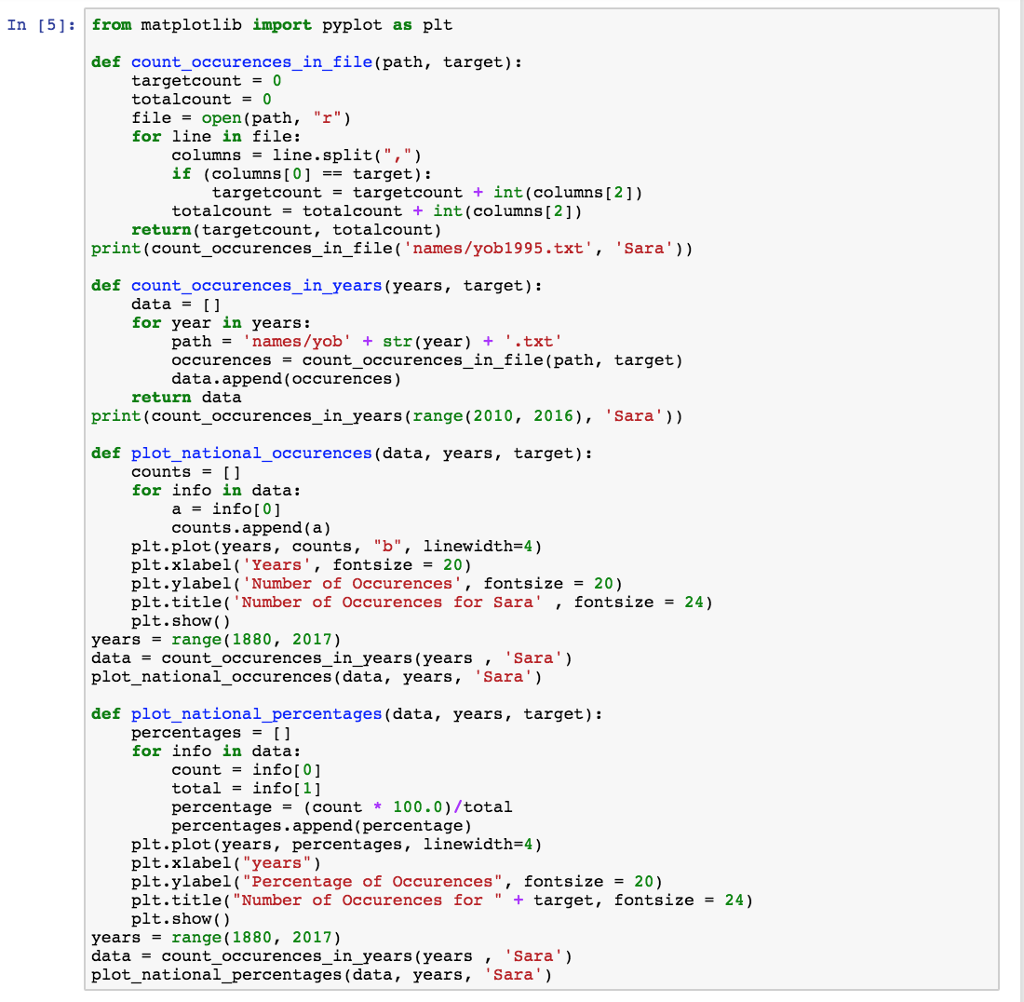
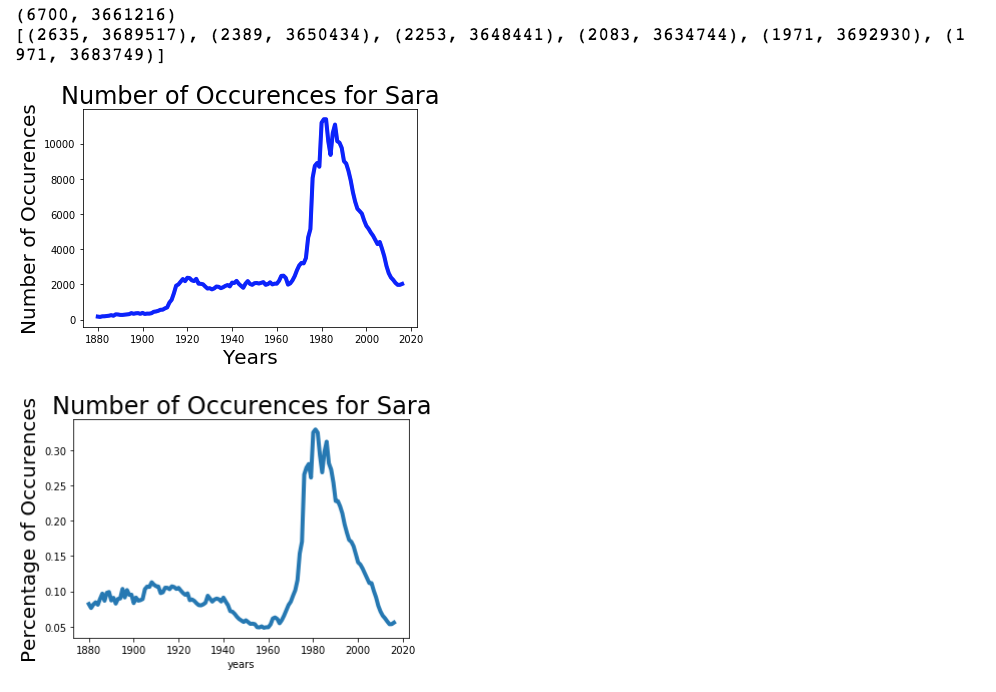
In [5]: from matplotlib import pyplot as plt def count_occurences in file(path, target): targetcount = 0 totalcount = 0 file = open (path, "r") for line in file: columns = line.split(",") if (columns [0] == target): targetcount = targetcount + int (columns[2]) totalcount = totalcount + int (columns [ 2 ]) return(targetcount, totalcount) print(count_occurences_in_file('names/yob1995.txt', 'Sara')) def count_occurences_in_years (years, target): data = [] for year in years: path = 'names/yob' + str(year) + '.txt' occurences = count_occurences_in_file(path, target) data.append(occurences) return data print(count_occurences_in_years (range (2010, 2016), 'Sara' )) def plot_national_occurences (data, years, target): counts = [] for info in data: a = info[0] counts.append(a) plt.plot(years, counts, "b", linewidth=4) plt.xlabel('Years', fontsize = 20) plt.ylabel( 'Number of Occurences', fontsize = 20) plt.title('Number of Occurences for Sara', fontsize = 24) plt.show() years = range (1880, 2017) data = count_occurences_in_years (years, 'Sara') plot_national_occurences (data, years, 'Sara') def plot_national_percentages(data, years, target): percentages = []. for info in data: count = info[0] total = info[1] percentage = (count * 100.0)/total percentages.append(percentage) plt.plot(years, percentages, linewidth=4) plt.xlabel("years") plt.ylabel( "Percentage of Occurences", fontsize = 20) plt.title( "Number of Occurences for " + target, fontsize = 24) plt.show() years = range(1880, 2017) data = count_occurences_in_years (years, 'Sara') plot_national percentages (data, years, 'Sara') In [5]: from matplotlib import pyplot as plt def count_occurences in file(path, target): targetcount = 0 totalcount = 0 file = open (path, "r") for line in file: columns = line.split(",") if (columns [0] == target): targetcount = targetcount + int (columns[2]) totalcount = totalcount + int (columns [ 2 ]) return(targetcount, totalcount) print(count_occurences_in_file('names/yob1995.txt', 'Sara')) def count_occurences_in_years (years, target): data = [] for year in years: path = 'names/yob' + str(year) + '.txt' occurences = count_occurences_in_file(path, target) data.append(occurences) return data print(count_occurences_in_years (range (2010, 2016), 'Sara' )) def plot_national_occurences (data, years, target): counts = [] for info in data: a = info[0] counts.append(a) plt.plot(years, counts, "b", linewidth=4) plt.xlabel('Years', fontsize = 20) plt.ylabel( 'Number of Occurences', fontsize = 20) plt.title('Number of Occurences for Sara', fontsize = 24) plt.show() years = range (1880, 2017) data = count_occurences_in_years (years, 'Sara') plot_national_occurences (data, years, 'Sara') def plot_national_percentages(data, years, target): percentages = []. for info in data: count = info[0] total = info[1] percentage = (count * 100.0)/total percentages.append(percentage) plt.plot(years, percentages, linewidth=4) plt.xlabel("years") plt.ylabel( "Percentage of Occurences", fontsize = 20) plt.title( "Number of Occurences for " + target, fontsize = 24) plt.show() years = range(1880, 2017) data = count_occurences_in_years (years, 'Sara') plot_national percentages (data, years, 'Sara')
Step by Step Solution
There are 3 Steps involved in it
Step: 1

Get Instant Access to Expert-Tailored Solutions
See step-by-step solutions with expert insights and AI powered tools for academic success
Step: 2

Step: 3
Ace Your Homework with AI
Get the answers you need in no time with our AI-driven, step-by-step assistance
Get Started
Advances In Databases And Information Systems 23rd European Conference Adbis 2019 Bled Slovenia September 8 11 2019 Proceedings Lncs 11695
Authors: Tatjana Welzer ,Johann Eder ,Vili Podgorelec ,Aida Kamisalic Latific
1st Edition
3030287297, 978-3030287290