I am very confused. I am trying to solve these but done see anything on the sheets provided with the specific names (like "market value equity" ) on the formula given, im not sure what to reference . Ill post the pictures of the sheets provided to see if anyone can help, thanks: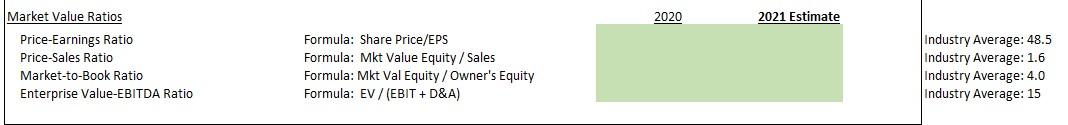
These are the sheets I need to work off of: 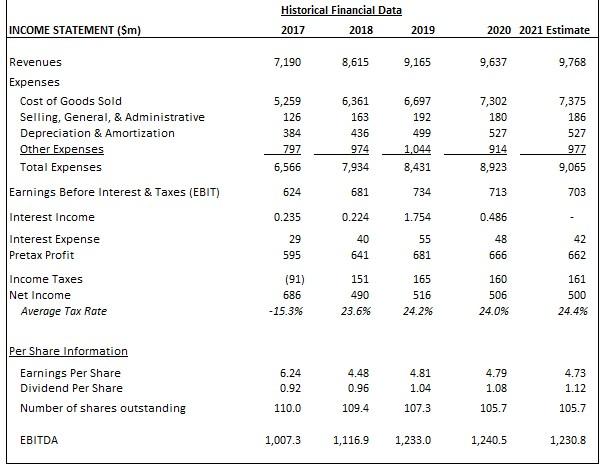
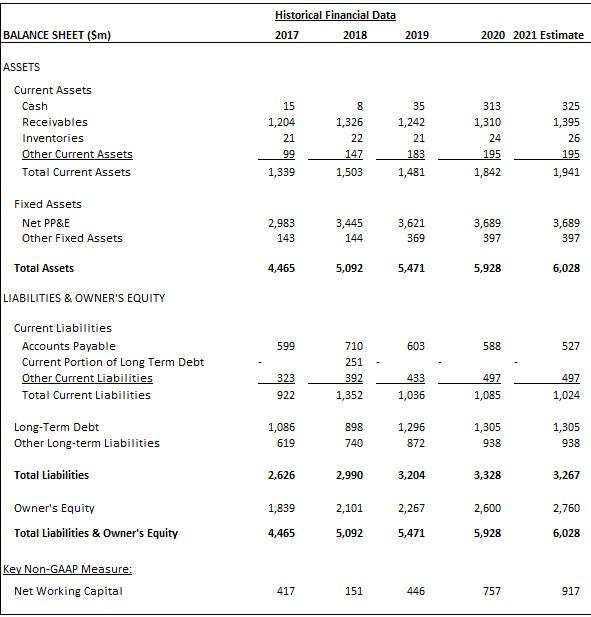
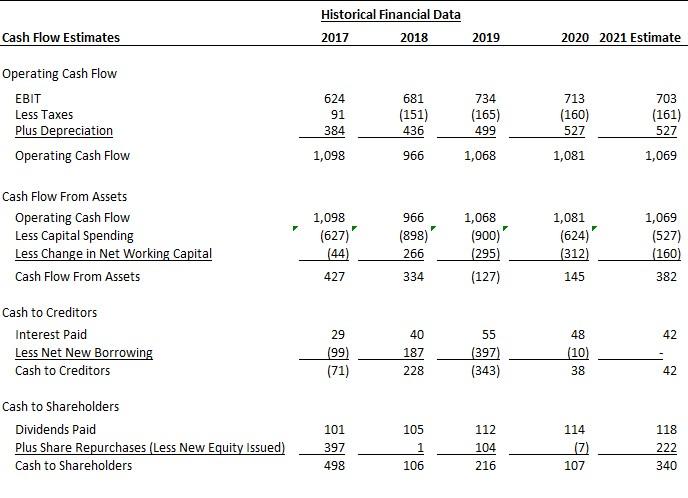
2020 2021 Estimate Market Value Ratios Price-Earnings Ratio Price-Sales Ratio Market-to-Book Ratio Enterprise Value-EBITDA Ratio Formula: Share Price/EPS Formula: Mkt Value Equity / Sales Formula: Mkt Val Equity / Owner's Equity Formula: EV / (EBIT + D&A) Industry Average: 48.5 Industry Average: 1.6 Industry Average: 4.0 Industry Average: 15 Historical Financial Data INCOME STATEMENT ($m) 2017 2018 2019 2020 2021 Estimate 7,190 8,615 9,165 9,637 9,768 5,259 126 384 797 6,361 163 436 974 7,934 6,697 192 499 1,044 8,431 7,302 180 527 914 7,375 186 527 977 6,566 8,923 9,065 Revenues Expenses Cost of Goods Sold Selling, General, & Administrative Depreciation & Amortization Other Expenses Total Expenses Earnings Before Interest & Taxes (EBIT) Interest Income Interest Expense Pretax Profit Income Taxes Net Income Average Tax Rate 624 681 734 713 703 0.235 0.224 1.754 0.486 29 595 40 641 55 681 48 666 42 662 191) 686 -15.3% 151 490 23.6% 165 516 24.2% 160 506 24.0% 161 500 24.496 Per Share Information Earnings Per Share Dividend Per Share Number of shares outstanding 6.24 0.92 4.48 0.96 4.81 1.04 4.79 1.08 4.73 1.12 110.0 109.4 107.3 105.7 105.7 EBITDA 1,007.3 1,116.9 1,233.0 1,240.5 1,230.8 Historical Financial Data BALANCE SHEET($m) 2017 2018 2019 2020 2021 Estimate ASSETS Current Assets Cash Receivables Inventories Other Current Assets Total Current Assets 15 1,204 21 99 1,339 8 1,326 22 147 1,503 35 1,242 21 183 313 1,310 24 195 1,842 325 1,395 26 195 1,941 1,481 Fixed Assets Net PP&E Other Fixed Assets 2,983 143 3,445 144 3,621 369 3,689 397 3,689 397 Total Assets 4,465 5,092 5,471 5,928 6,028 LIABILITIES & OWNER'S EQUITY Current Liabilities Accounts Payable Current Portion of Long Term Debt Other Current Liabilities Total Current Liabilities 599 603 588 527 710 251 392 1,352 433 497 323 922 497 1,024 1,036 1,085 Long-Term Debt Other Long-term Liabilities 1,086 619 898 740 1,296 872 1,305 938 1,305 938 Total Liabilities 2,626 2,990 3,204 3,328 3,267 1,839 2,101 2,267 2,600 2,760 Owner's Equity Total Liabilities & Owner's Equity 4,465 5,092 5,471 5,928 6,028 Key Non-GAAP Measure: Net Working Capital 417 151 446 757 917 Historical Financial Data 2017 2018 Cash Flow Estimates 2019 2020 2021 Estimate Operating Cash Flow EBIT Less Taxes Plus Depreciation Operating Cash Flow 624 91 384 681 (151) 436 734 (165) 499 713 (160) 527 1,081 703 (161) 527 1,098 966 1,068 1,069 Cash Flow From Assets Operating Cash Flow Less Capital Spending Less Change in Net Working Capital Cash Flow From Assets 1,098 (627) (44) 427 966 (898) 266 1,068 (900) (295) (127) 1,081 (624) (312) 1,069 (527) (160) 334 145 382 42 Cash to Creditors Interest Paid Less Net New Borrowing Cash to Creditors 29 (99) (71) 40 187 228 55 (397) (343) 48 (10) 38 42 Cash to Shareholders Dividends Paid Plus Share Repurchases (Less New Equity Issued) Cash to Shareholders 105 101 397 498 112 104 216 114 (7) 107 118 222 340 106 2020 2021 Estimate Market Value Ratios Price-Earnings Ratio Price-Sales Ratio Market-to-Book Ratio Enterprise Value-EBITDA Ratio Formula: Share Price/EPS Formula: Mkt Value Equity / Sales Formula: Mkt Val Equity / Owner's Equity Formula: EV / (EBIT + D&A) Industry Average: 48.5 Industry Average: 1.6 Industry Average: 4.0 Industry Average: 15 Historical Financial Data INCOME STATEMENT ($m) 2017 2018 2019 2020 2021 Estimate 7,190 8,615 9,165 9,637 9,768 5,259 126 384 797 6,361 163 436 974 7,934 6,697 192 499 1,044 8,431 7,302 180 527 914 7,375 186 527 977 6,566 8,923 9,065 Revenues Expenses Cost of Goods Sold Selling, General, & Administrative Depreciation & Amortization Other Expenses Total Expenses Earnings Before Interest & Taxes (EBIT) Interest Income Interest Expense Pretax Profit Income Taxes Net Income Average Tax Rate 624 681 734 713 703 0.235 0.224 1.754 0.486 29 595 40 641 55 681 48 666 42 662 191) 686 -15.3% 151 490 23.6% 165 516 24.2% 160 506 24.0% 161 500 24.496 Per Share Information Earnings Per Share Dividend Per Share Number of shares outstanding 6.24 0.92 4.48 0.96 4.81 1.04 4.79 1.08 4.73 1.12 110.0 109.4 107.3 105.7 105.7 EBITDA 1,007.3 1,116.9 1,233.0 1,240.5 1,230.8 Historical Financial Data BALANCE SHEET($m) 2017 2018 2019 2020 2021 Estimate ASSETS Current Assets Cash Receivables Inventories Other Current Assets Total Current Assets 15 1,204 21 99 1,339 8 1,326 22 147 1,503 35 1,242 21 183 313 1,310 24 195 1,842 325 1,395 26 195 1,941 1,481 Fixed Assets Net PP&E Other Fixed Assets 2,983 143 3,445 144 3,621 369 3,689 397 3,689 397 Total Assets 4,465 5,092 5,471 5,928 6,028 LIABILITIES & OWNER'S EQUITY Current Liabilities Accounts Payable Current Portion of Long Term Debt Other Current Liabilities Total Current Liabilities 599 603 588 527 710 251 392 1,352 433 497 323 922 497 1,024 1,036 1,085 Long-Term Debt Other Long-term Liabilities 1,086 619 898 740 1,296 872 1,305 938 1,305 938 Total Liabilities 2,626 2,990 3,204 3,328 3,267 1,839 2,101 2,267 2,600 2,760 Owner's Equity Total Liabilities & Owner's Equity 4,465 5,092 5,471 5,928 6,028 Key Non-GAAP Measure: Net Working Capital 417 151 446 757 917 Historical Financial Data 2017 2018 Cash Flow Estimates 2019 2020 2021 Estimate Operating Cash Flow EBIT Less Taxes Plus Depreciation Operating Cash Flow 624 91 384 681 (151) 436 734 (165) 499 713 (160) 527 1,081 703 (161) 527 1,098 966 1,068 1,069 Cash Flow From Assets Operating Cash Flow Less Capital Spending Less Change in Net Working Capital Cash Flow From Assets 1,098 (627) (44) 427 966 (898) 266 1,068 (900) (295) (127) 1,081 (624) (312) 1,069 (527) (160) 334 145 382 42 Cash to Creditors Interest Paid Less Net New Borrowing Cash to Creditors 29 (99) (71) 40 187 228 55 (397) (343) 48 (10) 38 42 Cash to Shareholders Dividends Paid Plus Share Repurchases (Less New Equity Issued) Cash to Shareholders 105 101 397 498 112 104 216 114 (7) 107 118 222 340 106