

Answered step by step
Verified Expert Solution
Question
1 Approved Answer
I am very slow, please show and explain to me step by step. Thank you so much. Edit 1: That is all I have. He
I am very slow, please show and explain to me step by step. Thank you so much.
Edit 1: That is all I have. He does not giving fs
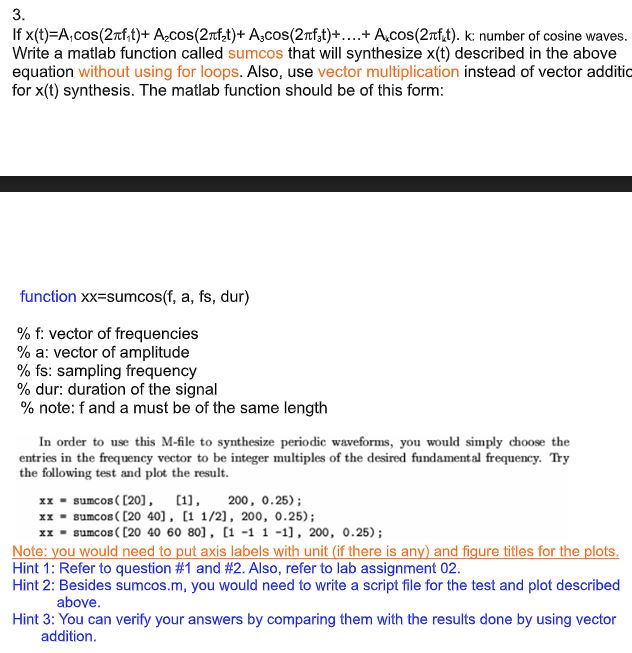
3. If x(t)=A, cos (2rft)+ A2cos(2rfd)+ AsCosCa t)-. . . . + AkcosCaft). k: number of cosine waves. Write a matlab function called sumcos that will synthesize x(t) described in the above equation without using for loops. Also, use vector multiplication instead of vector additic for x(t) synthesis. The matlab function should be of this form: function xx sumcos(f, a, fs, dur) % f: vector of frequencies % a: vector of amplitude % fs: sampling frequency % dur: duration of the signal % note: f and a must be of the same length In order to use this M-file to synthesize periodic waveforms, you would simply choose the entries in the frequency vector to be integer multiples of the desired fundamental frequency. Try the following test and plot the result xx sumcos ( [20], 1, 200, 0.25); xx sumcos( [20 40], [1 1/2], 200, 0.25); xx sumcos ( [20 40 60 80], [1 -1 1 -1, 200, 0.25); Note: you would need to put axis labels with unit (if there is any) and figure titles for the plots Hint 1 : Refer to question #1 and #2. Also, refer to lab assignment 02. Hint 2: Besides sumcos.m, you would need to write a script file for the test and plot described above. Hint 3: You can verify your answers by comparing them with the results done by using vector addition. 3. If x(t)=A, cos (2rft)+ A2cos(2rfd)+ AsCosCa t)-. . . . + AkcosCaft). k: number of cosine waves. Write a matlab function called sumcos that will synthesize x(t) described in the above equation without using for loops. Also, use vector multiplication instead of vector additic for x(t) synthesis. The matlab function should be of this form: function xx sumcos(f, a, fs, dur) % f: vector of frequencies % a: vector of amplitude % fs: sampling frequency % dur: duration of the signal % note: f and a must be of the same length In order to use this M-file to synthesize periodic waveforms, you would simply choose the entries in the frequency vector to be integer multiples of the desired fundamental frequency. Try the following test and plot the result xx sumcos ( [20], 1, 200, 0.25); xx sumcos( [20 40], [1 1/2], 200, 0.25); xx sumcos ( [20 40 60 80], [1 -1 1 -1, 200, 0.25); Note: you would need to put axis labels with unit (if there is any) and figure titles for the plots Hint 1 : Refer to question #1 and #2. Also, refer to lab assignment 02. Hint 2: Besides sumcos.m, you would need to write a script file for the test and plot described above. Hint 3: You can verify your answers by comparing them with the results done by using vector additionStep by Step Solution
There are 3 Steps involved in it
Step: 1

Get Instant Access to Expert-Tailored Solutions
See step-by-step solutions with expert insights and AI powered tools for academic success
Step: 2

Step: 3
Ace Your Homework with AI
Get the answers you need in no time with our AI-driven, step-by-step assistance
Get Started
Systems Analysis And Synthesis Bridging Computer Science And Information Technology
Authors: Barry Dwyer
1st Edition
0128054492, 9780128054499