I am working on doing an analysis of a company for my accounting class. can you please review what I have and correct what I have wrong. Also, Help me with the ones I have left blank as I can not find the right information to solve these. Thank you so much!!
| Ratio: | Formula: | Year: | Formula: | Total: |
| Current Ratio: | Current Assets / Current Liabilities | 2018 | 566,951 / 379,743 | 1.49 |
| Acid-Test Ratio | Cash + Short- Term Investments + Current Receivables / Current Liabilities | 2018 | 520,976 / 379,743 | 1.37 |
| Inventory Turnover | Cost of Goods Sold / Average Inventory | 2018 | 2,130,188 / ? | |
| Total Asset Turnover | Net Sales/ Average Total Assets | 2018 | 361,972 / ? | |
| Days Sales In Inventory | Ending Inventory / Cost of Goods Sold x 365 | 2018 | 45,975 / 2,130,188 * 365 | 7.88 |
| Debit Ratio | Total Liabilities / Total Assets | 2018 | 3,947,306 / 907,385 | 4.35 |
| Equity Ratio | Total Equity / Total Assets | 2018 | 907,385 / 907,385 | 1.00 |
| Debit-to-Equity Ratio | Total Liabilities / Total Equity | 2018 | 3,947,306 / 907,385 | 4.35 |
| Profit Margin Ratio | Net Income / Net Sales | 2018 | 361,972 / ? | |
| Gross Margin Ratio | Net Sales - Cost of Goods Sold / Net Sales | 2018 | ? | |
| Basic Earnings Per Share | Net Income - preferred Dividends / Weighted-Average Common Shares Outstanding | 2018 | ? | |
| Dividend Yield | Annual Cash Dividends Per Share / Market Price Per Share | 2018 | ? | |
| Current Ratio: | Current Assets / Current Liabilities | 2019 | 787,617 / 453,831 | 1.74 |
| Acid-Test Ratio | Cash + Short- Term Investments + Current Receivables / Current Liabilities | 2019 | 734,663 / 453,831 | 1.62 |
| Inventory Turnover | Cost of Goods Sold / Average Inventory | 2019 | 2,216,774 / ? | |
| Total Asset Turnover | Net Sales/ Average Total Assets | 2019 | 400,709 / 1,144,738 | 0.35 |
| Days Sales In Inventory | Ending Inventory / Cost of Goods Sold x 365 | 2019 | 52,955 / 2,216,774 * 365 | 8.72 |
| Debit Ratio | Total Liabilities / Total Assets | 2019 | 4,797,851 / 1,382,092 | 3.47 |
| Equity Ratio | Total Equity / Total Assets | 2019 | 1,382,092 / 1,382,092 | 1.00 |
| Debit-to-Equity Ratio | Total Liabilities / Total Equity | 2019 | 4,797,851 / 1,382,092 | 3.47 |
| Profit Margin Ratio | Net Income / Net Sales | 2019 | 400,709 / ? | |
| Gross Margin Ratio | Net Sales - Cost of Goods Sold / Net Sales | 2019 | ? | |
| Basic Earnings Per Share | Net Income - preferred Dividends / Weighted-Average Common Shares Outstanding | 2019 | ? | |
| Dividend Yield | Annual Cash Dividends Per Share / Market Price Per Share | 2019 | ? | |
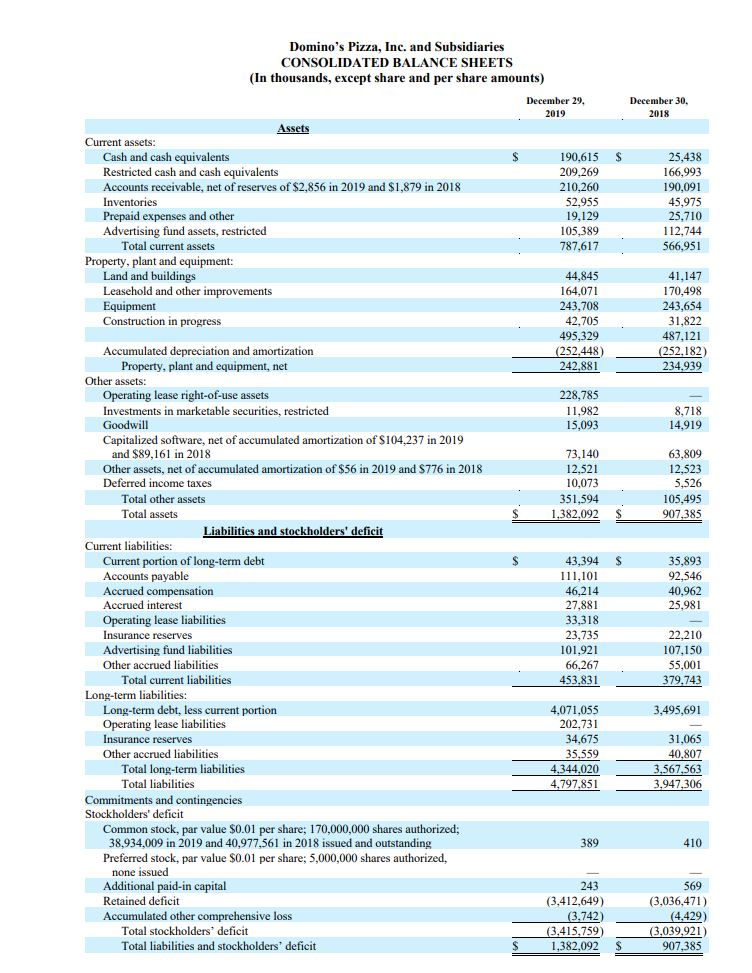
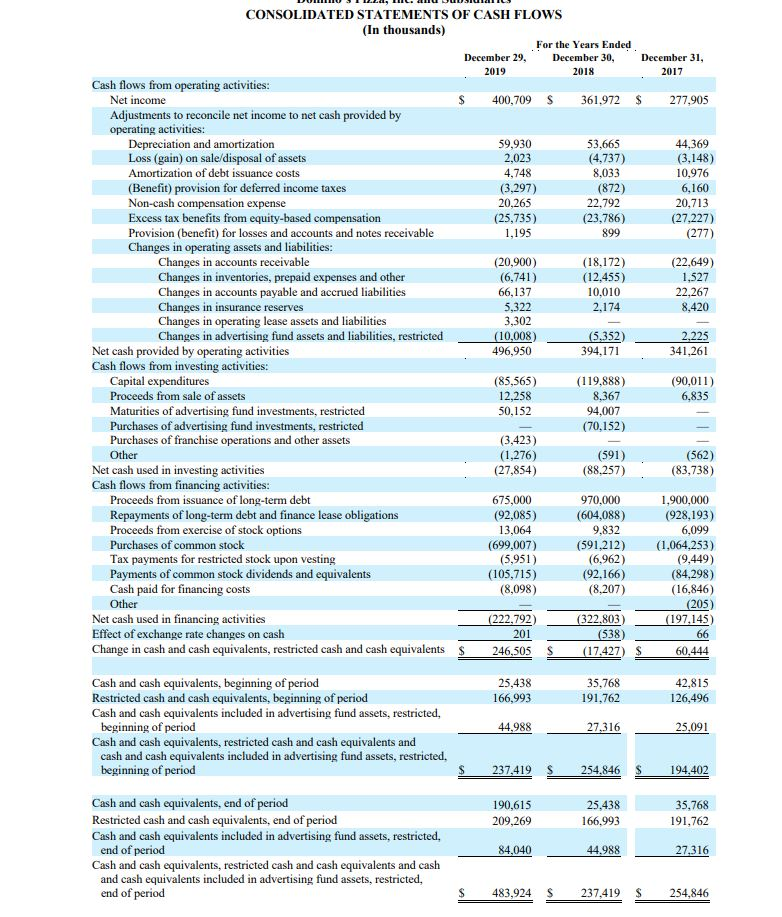

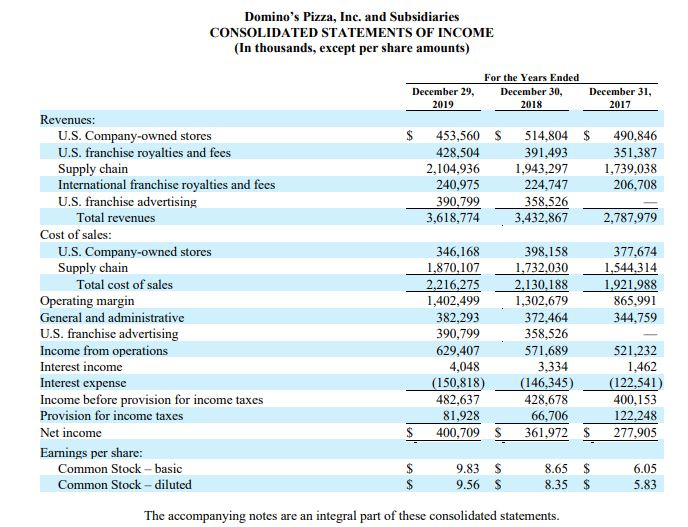
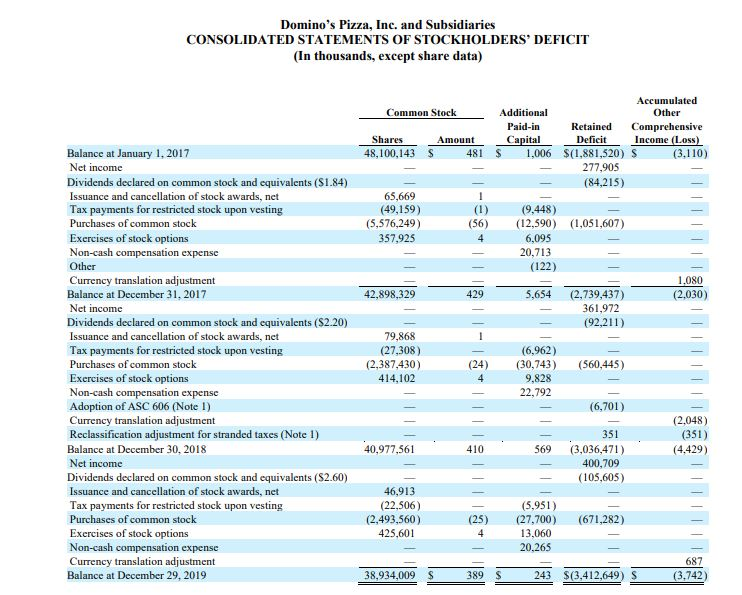
Domino's Pizza, Inc. and Subsidiaries CONSOLIDATED BALANCE SHEETS (In thousands, except share and per share amounts) December 29. 2019 December 30, 2018 $ $ Assets Current assets: Cash and cash equivalents Restricted cash and cash equivalents Accounts receivable, net of reserves of $2,856 in 2019 and $1.879 in 2018 Inventories Prepaid expenses and other Advertising fund assets, restricted Total current assets Property, plant and equipment: Land and buildings Leasehold and other improvements Equipment Construction in progress 190,615 209.269 210,260 52.955 19,129 105,389 787.617 25,438 166,993 190,091 45,975 25.710 112.744 566,951 44,845 164,071 243.708 42.705 495,329 (252,448) 242,881 41.147 170,498 243.654 31,822 487,121 (252.182) 234.939 228,785 11.982 15,093 8,718 14,919 73,140 12,521 10,073 351,594 1,382,092 63,809 12,523 5,526 105,495 907,385 $ S 35,893 92,546 40,962 25,981 Accumulated depreciation and amortization Property, plant and equipment, net Other assets: Operating lease right-of-use assets Investments in marketable securities, restricted Goodwill Capitalized software, net of accumulated amortization of $104,237 in 2019 and $89,161 in 2018 Other assets, net of accumulated amortization of $56 in 2019 and S776 in 2018 Deferred income taxes Total other assets Total assets Liabilities and stockholders' deficit Current liabilities: Current portion of long-term debt Accounts payable Accrued compensation Accrued interest Operating lease liabilities Insurance reserves Advertising fund liabilities Other accrued liabilities Total current liabilities Long-term liabilities: Long-term debt, less current portion Operating lease liabilities Insurance reserves Other accrued liabilities Total long-term liabilities Total liabilities Commitments and contingencies Stockholders' deficit Common stock, par value $0.01 per share: 170,000,000 shares authorized; 38,934,009 in 2019 and 40,977,561 in 2018 issued and outstanding Preferred stock, par value $0.01 per share: 5,000,000 shares authorized, none issued Additional paid-in capital Retained deficit Accumulated other comprehensive loss Total stockholders' deficit Total liabilities and stockholders' deficit 43.394 111,101 46,214 27,881 33,318 23,735 101.921 66,267 453,831 22,210 107,150 55,001 379,743 3,495,691 4.071,055 202.731 34,675 35,559 4,344,020 4,797,851 31,065 40,807 3,567,563 3,947,306 389 410 243 (3.412.649) (3.742) (3.415.759) 1,382,092 569 (3,036,471) (4,429) (3,039,921) 907,385 2019 CONSOLIDATED STATEMENTS OF CASH FLOWS (In thousands) For the Years Ended December 29, December 30, December 31, 2018 2017 Cash flows from operating activities: Net income $ 400,709 S 361.972 $ 277,905 Adjustments to reconcile net income to net cash provided by operating activities: Depreciation and amortization 59,930 53,665 44,369 Loss (gain) on sale/disposal of assets 2,023 (4.737) (3,148) Amortization of debt issuance costs 4,748 8,033 10,976 (Benefit) provision for deferred income taxes (3,297) (872) 6,160 Non-cash compensation expense 20.265 22.792 20,713 Excess tax benefits from equity-based compensation (25,735) (23,786) (27,227) Provision (benefit) for losses and accounts and notes receivable 1,195 899 (277) Changes in operating assets and liabilities: Changes in accounts receivable (20,900) (18.172) (22,649) Changes in inventories, prepaid expenses and other (6,741) (12.455) 1,527 Changes in accounts payable and accrued liabilities 66,137 10,010 22,267 Changes in insurance reserves 5,322 2,174 8,420 Changes in operating lease assets and liabilities 3.302 Changes in advertising fund assets and liabilities, restricted (10,008) (5,352) 2,225 Net cash provided by operating activities 496,950 394,171 341,261 Cash flows from investing activities: Capital expenditures (85,565) (119.888) (90,011) Proceeds from sale of assets 12.258 8,367 6,835 Maturities of advertising fund investments, restricted 50,152 94,007 Purchases of advertising fund investments, restricted (70.152) Purchases of franchise operations and other assets (3,423) Other (1,276) (591) (562) Net cash used in investing activities (27,854) (88.257) (83,738) Cash flows from financing activities: Proceeds from issuance of long-term debt 675,000 970,000 1,900,000 Repayments of long-term debt and finance lease obligations (92,085) (604,088) (928,193) Proceeds from exercise of stock options 13,064 9,832 6,099 Purchases of common stock (699,007) (591.212) (1,064.253) Tax payments for restricted stock upon vesting (5,951) (6,962) (9,449) Payments of common stock dividends and equivalents (105,715) (92.166) (84,298) Cash paid for financing costs (8,098) (8.207) (16,846) Other (205) Net cash used in financing activities (222,792) (322.803) (197.145) Effect of exchange rate changes on cash 201 (538) Change in cash and cash equivalents, restricted cash and cash equivalents $ 246,505 $ (17.427) $ 60.444 66 25,438 166,993 35,768 191,762 42,815 126,496 Cash and cash equivalents, beginning of period Restricted cash and cash equivalents, beginning of period Cash and cash equivalents included in advertising fund assets, restricted, beginning of period Cash and cash equivalents, restricted cash and cash equivalents and cash and cash equivalents included in advertising fund assets, restricted, beginning of period 44.988 27.316 25.091 237,419 S 254,846 $ 194,402 190,615 209,269 25,438 166,993 35,768 191,762 Cash and cash equivalents, end of period Restricted cash and cash equivalents, end of period Cash and cash equivalents included in advertising fund assets, restricted, end of period Cash and cash equivalents, restricted cash and cash equivalents and cash and cash equivalents included in advertising fund assets, restricted, end of period 84,040 44,988 27,316 $ 483,924 S 237.419 S 254,846 Domino's Pizza, Inc. and Subsidiaries CONSOLIDATED STATEMENTS OF COMPREHENSIVE INCOME (In thousands) Net income Currency translation adjustment Comprehensive income For the Years Ended December 29, December 30, 2019 2018 $ 400,709 $ 361,972 687 (2,048) $ 401,396 $ 359,924 December 31, 2017 $ 277,905 1.080 $ 278,985 The accompanying notes are an integral part of these consolidated statements. Domino's Pizza, Inc. and Subsidiaries CONSOLIDATED STATEMENTS OF INCOME (In thousands, except per share amounts) December 29, 2019 For the Years Ended December 30, 2018 December 31, 2017 $ 453,560 $ $ 514,804 391,493 1,943,297 224.747 358,526 3,432.867 490,846 351,387 1,739,038 206,708 2,104,936 240,975 390,799 3,618,774 2,787,979 Revenues: U.S. Company-owned stores U.S. franchise royalties and fees Supply chain International franchise royalties and fees U.S. franchise advertising Total revenues Cost of sales: U.S. Company-owned stores Supply chain Total cost of sales Operating margin General and administrative U.S. franchise advertising Income from operations Interest income Interest expense Income before provision for income taxes Provision for income taxes Net income Earnings per share: Common Stock - basic Common Stock - diluted 377,674 1,544,314 1.921.988 865,991 344,759 346,168 1,870,107 2.216,275 1,402,499 382,293 390,799 629,407 4,048 (150,818) 482,637 81,928 400,709 398,158 1,732,030 2.130.188 1,302,679 372,464 358,526 571,689 3,334 (146,345) 428,678 66,706 361,972 521,232 1,462 (122,541) 400,153 122,248 277,905 $ S $ $ $ 9.83 9.56 $ $ 8.65 8.35 $ $ 6.05 5.83 The accompanying notes are an integral part of these consolidated statements. Domino's Pizza, Inc. and Subsidiaries CONSOLIDATED STATEMENTS OF STOCKHOLDERS' DEFICIT (In thousands, except share data) Accumulated Common Stock Additional Other Paid-in Retained Comprehensive Shares Amount Capital Deficit Income (Loss) 48,100,143 S 4 81 $ 1,006 S(1.881,520) S (3.110) 277,905 (84,215) 65,669 (49,159) (1) (9,448) (5,576,249) (56) (12,590) (1,051,607) 357,925 6,095 20,713 (122) 42,898,329 11111- 5,654 (2.030) (2,739,437) 361,972 (92,211) Balance at January 1, 2017 Net income Dividends declared on common stock and equivalents (S1.84) Issuance and cancellation of stock awards, net Tax payments for restricted stock upon vesting Purchases of common stock Exercises of stock options Non-cash compensation expense Other Currency translation adjustment Balance at December 31, 2017 Net income Dividends declared on common stock and equivalents (S2.20) Issuance and cancellation of stock awards, net Tax payments for restricted stock upon vesting Purchases of common stock Exercises of stock options Non-cash compensation expense Adoption of ASC 606 (Note 1) Currency translation adjustment Reclassification adjustment for stranded taxes (Note 1) Balance at December 30, 2018 Net income Dividends declared on common stock and equivalents (S2.60) Issuance and cancellation of stock awards, net Tax payments for restricted stock upon vesting Purchases of common stock Exercises of stock options Non-cash compensation expense Currency translation adjustment Balance at December 29, 2019 79,868 (27,308) (2,387,430) 414,102 (6,962) (30,743) 9.828 22,792 (560,445) (6,701) (2,048) (351) (4.429) 40,977,561 410 351 (3,036,471) 400,709 (105,605) 5 69 46,913 (22,506) (2,493,560) 425,601 (5,951) (27,700) 13,060 20,265 (671,282) 38,934,009 $ 389 243 $(3,412,649) S (3.742)


