

Answered step by step
Verified Expert Solution
Question
1 Approved Answer
i answer most this budget but please complete it with explain the slove .. and analyse it the last photo is a clear slove Analyzing
i answer most this budget but please complete it with explain the slove .. and analyse it
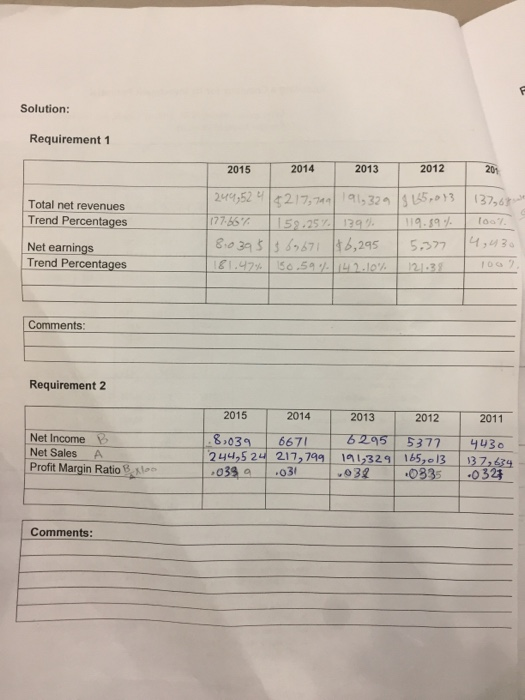
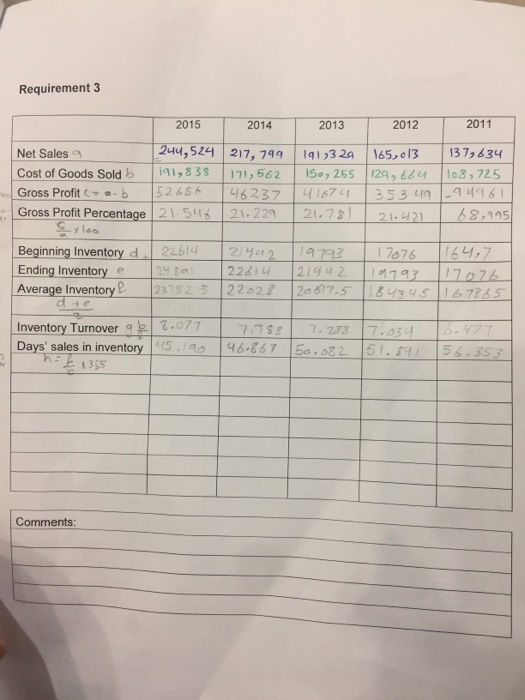
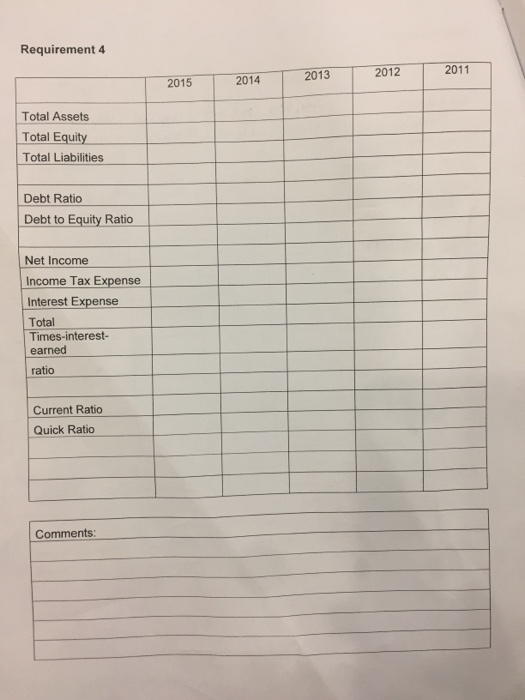
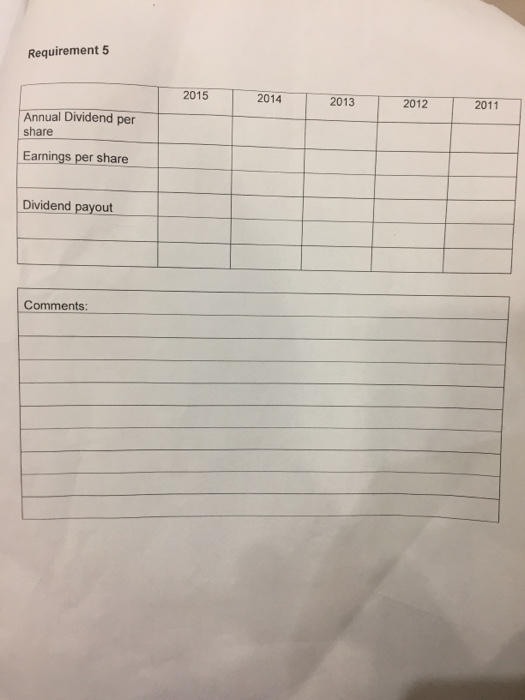
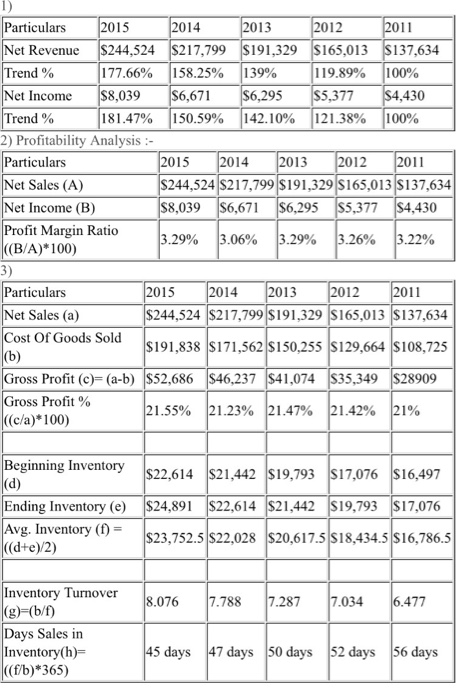
Analyzing a Company for its Investment Potential In its annual report, WRS Athletic Supply, Inc., includes the following five-year financial summary. WRS ATHLETIC SUPPLY, INC. Five-Year Financial Summary (Partial adapted) 2010 2011 $137,634 17% 2014 2013 2012 5344,524 5217599 $191,129 $165,013 16% 20% 5% 6% 1,873 1,78 1,615 191,838 171,562 150,235 129,664 96 5% 2,001 1,391 108,725 41,236 36,356 31.679 27,408 22,516 1,063 (138) 4,487 8,039 1,357 (171) 3,897 6,671 1,383 (185) 3,692 6,295 1,045 (204) 3,138 5.377 803 (1891 2740 4,430 Dollars in thouder b rita) Net sales Net sales increase Domestic comparative store sales increase Other income Cost of sales Operating, selling, and general and administrative expenses Interest Interest expense Interest income Income tax expense Net income Per share of common stock Net income Dividends Finandal Position Current awets, excluding inventory Inventories at LIFO cost Property, plant, and equipment, net Total assets Current liabilities Long-term debe Shareholders' equity Financial Ratios Acid-test ratio Rate of return on total assets Rate of return on shareholders' equity 1.49 0.28 1.41 0.24 1.21 0.20 0.99 0.16 0.10 $16,497 $ 30,463 24,891 51,904 94,685 32,617 22,731 39,337 S 27,878 22,614 48,750 81,527 27.282 21,143 35,102 $ 26,555 $ 24,356 21,442 19,793 40,934 35,969 78,130 70,349 28,949 25.803 17,838 18,712 31,343 25.834 $ 21,132 17,076 25,973 49,996 16,762 12,122 21,112 0.9 13 0.9 10.2% 21.6% 1.0 9.9% 20.1% 10.3% 22.0% 10.7% 22.9% 27.4% Requirement 1. Analyze the company's financial summary for the fiscal years 2011-2015 to decide whether to invest in the common stock of WRS. Include the following sections in your analysis, and fully explain your final decision. Trend analysis for net sales and net income (use 2011 as the base year). b. Profitability analysis. Evaluate the ability to sell inventory (WRS uses the LIFO method). d. Evaluate the ability to pay debts. e. Evaluate the dividends. Solution: Requirement 1 2015 2014 2013 2012 2013 Total net revenues Trend Percentages 244,52 4 217,744 191,324 515,013137,67 177.66% 152,25% 139% 119.89% 100% 810393 /s 69671 +6,295 5.377 4,40 161.47% 50.591/ 414 2.10%. 121-3 Net earnings Trend Percentages Comments: Requirement 2 Net Income B Net Sales A Profit Margin Ratio 2015 2014 2013 2012 2011 8,039 6671 7295 5377 4430 244,524 217,799 191,329 165,- 13137,634 0399 .03 .03 .0335 .0325 Comments: Requirement 3 2015 2014 2013 2012 2011 Net Sales 244,524 217, 799 191,329 165,013 137,634 Cost of Goods Sold b 191,835 171,562 150, 255 [129,664 108,725 Gross Profit - ab 152686 46237 41674 353 ug -94961 Gross Profit Percentage 21.546 21.229 21.781 21.4216 8,195 sxloo Beginning Inventory d. 226142 /442 14793 17076 164,7 Ending Inventory e 2980 22814 21942 1793 1774 Average Inventory 23752522022 20617.5 1843451 67285 Inventory Turnover 9 2.077 7.758 7.238 Days' sales in inventory 115.194 6.867 50.82 h E 1355 7.854 51.89 56.353 Comments: Requirement 4 2015 2014 2013 2012 2011 Total Assets Total Equity Total Liabilities Debt Ratio Debt to Equity Ratio Net Income Income Tax Expense Interest Expense Total Times-interest earned ratio Current Ratio Quick Ratio Comments: Requirement 5 2015 2014 2013 2012 2011 Annual Dividend per share Earnings per share Dividend payout Comments: Particulars 2015 2014 2013 2012 2011 Net Revenue $244,524 $217,799 $191,329 $165,013 $137,634 Trend % 177.66% 158.25% 139% 119.89% 100% Net Income $8,03956,67156,295 $5,377 $4,430 Trend % 181.47% 150.59% 142.10% 121.38% 100% 2) Profitability Analysis :- Particulars 2015 2014 2013 2012 2011 Net Sales (A) $244,524 $217,799 $191,329 165,013 $137,634 Net Income (B) $8,039 $6,671 $6,295 $5,377 $4,430 Profit Margin Ratio 3.29% 3.06% 3.29% 3.26% ((B/A)*100) 3.22% Particulars 2015 2014 2013 2012 2011 Net Sales (a) $244,524 $217,799 $191,329 $165,013 $137,634 Cost Of Goods Sold $191,838 $171,562 $150,255 S129,664 $108,725 (6) Gross Profit (c)=(a-b) $52,686 $46,237 $41,074 $35,349 $28909 Gross Profit % 21.55% 21.23% 21.47% 21.42% 21% ((c/a)*100) $22,614 $21,442 $19,793 $17,076 $16,497 Beginning Inventory (d) Ending Inventory (e) Avg. Inventory (t) = k(d+e)/2) $24,891 $22,614 $21,442 $19,793 $17,076 $23,752.5 522,028 $20,617.5 S18,434.5 $16,786.5 8.076 7.788 7.287 7.034 6.477 Inventory Turnover (g)-(b/f) Days Sales in Inventory(h) ((f/b)*365) 45 days 47 days 50 days 52 days 56 days the last photo is a clear slove 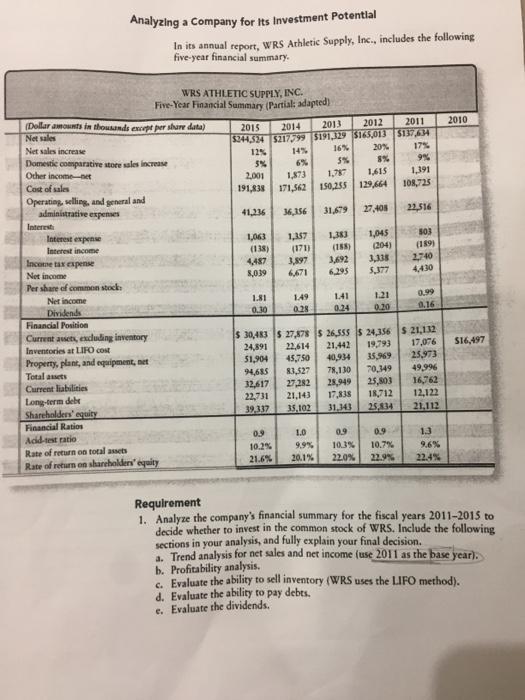
Step by Step Solution
There are 3 Steps involved in it
Step: 1

Get Instant Access to Expert-Tailored Solutions
See step-by-step solutions with expert insights and AI powered tools for academic success
Step: 2

Step: 3
Ace Your Homework with AI
Get the answers you need in no time with our AI-driven, step-by-step assistance
Get Started
You Are An Amazing Auditor Simply Fantastic All The Other Auditors Total Disasters Everyone Agree Believe Me
Authors: Auditor Gift
1st Edition
1656655861, 978-1656655868