Answered step by step
Verified Expert Solution
Question
1 Approved Answer
I believe you have to find week 3, not sure. this is the only information provided MARKET SEGMENT SATURDAY SUNDAY MONDAY TUESDAY WEDNESDAY THURSDAY FRIDAY

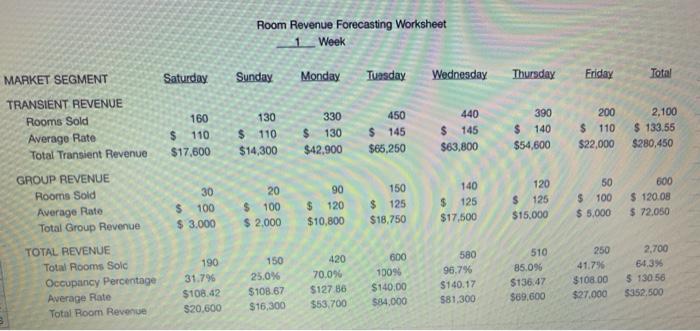

I believe you have to find week 3, not sure.
this is the only information provided
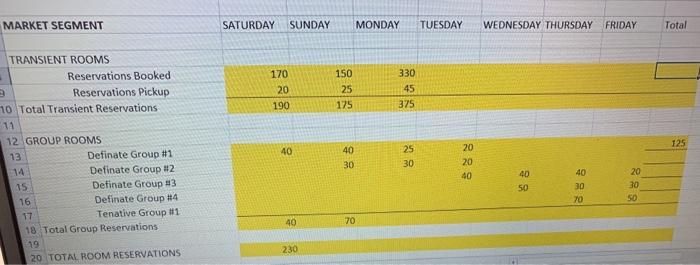
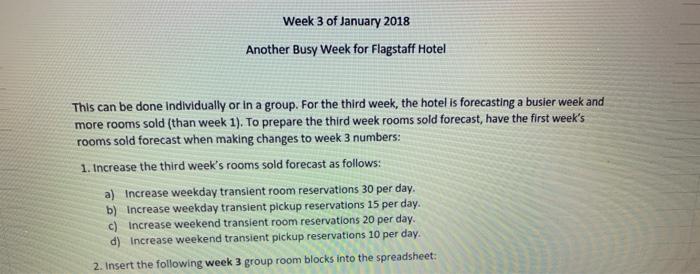
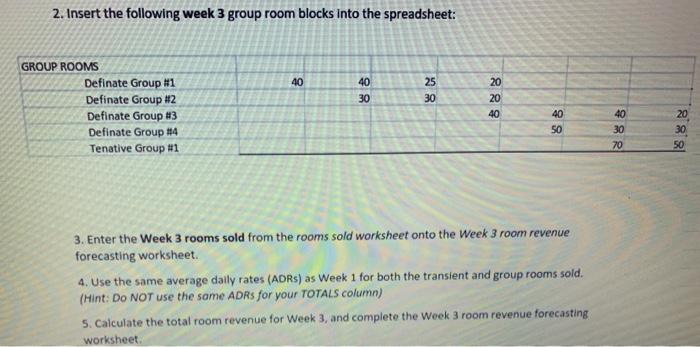
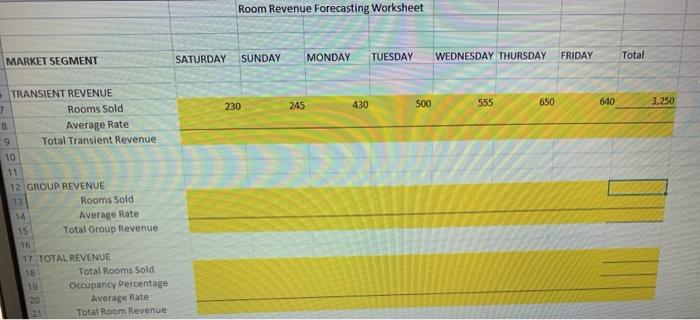
MARKET SEGMENT SATURDAY SUNDAY MONDAY TUESDAY WEDNESDAY THURSDAY FRIDAY Total 170 20 190 150 25 175 330 45 375 TRANSIENT ROOMS Reservations Booked Reservations Pickup 10 Total Transient Reservations 11 12 GROUP ROOMS 13 Definate Group #1 14 Definate Group 2 Definate Group #13 Definate Group #14 17 Tenative Group #1 18 Total Group Reservations 125 40 40 30 25 30 20 20 40 40 50 15 16 40 30 70 20 30 50 40 70 230 20 TOTAL ROOM RESERVATIONS Rooms Sold Forecasting Worksheet-600 Rooms Week Offset Friday! Saturday Sunday MARKET SEGMENT Monday Tuesday Wednesday Thursday Total Friday 400 TRANSIENT ROOMS Reservations Bocked Reservations Pickup Total Transient Reservations 150 10 160 120 10 130 300 30 350 40 390 400 40 440 50 450 180 20 200 1900 200 2.100 Week 3 of January 2018 Another Busy Week for Flagstaff Hotel This can be done Individually or in a group. For the third week, the hotel is forecasting a busier week and more rooms sold (than week 1). To prepare the third week rooms sold forecast, have the first week's rooms sold forecast when making changes to week 3 numbers: 1. Increase the third week's rooms sold forecast as follows: a) Increase weekday transient room reservations 30 per day. b) Increase weekday transient pickup reservations 15 per day. c) Increase weekend transient room reservations 20 per day. d) Increase weekend transient pickup reservations 10 per day. 2. Insert the following week 3 group room blocks into the spreadsheet: 2. Insert the following week 3 group room blocks into the spreadsheet: 40 40 30 25 30 GROUP ROOMS Definate Group #1 Definate Group #2 Definate Group #3 Definate Group #4 Tenative Group #1 20 20 40 40 50 40 30 70 20 30 50 3. Enter the Week 3 rooms sold from the rooms sold worksheet onto the Week 3 room revenue forecasting worksheet. 4. Use the same average daily rates (ADRs) as Week 1 for both the transient and group rooms sold. (Hint: Do NOT use the same ADRs for your TOTALS column) 5. Calculate the total room revenue for Week 3, and complete the Week 3 room revenue forecasting worksheet Room Revenue Forecasting Worksheet SATURDAY SUNDAY MARKET SEGMENT MONDAY TUESDAY FRIDAY WEDNESDAY THURSDAY Total 245 230 500 430 555 640 650 3,250 TRANSIENT REVENUE 7 Rooms Sold 8 Average Rate 9 Total Transient Revenue 10 12.GROUP REVENUE 13 Rooms Sold 14 Average rate Total Group Revenue 15 17 TOTAL REVENUE Total Rooms Sold 19 Occupancy Percentage Average Rate 21 Total Room Revenue Room Revenue Forecasting Worksheet 1_Week Saturday Sunday Monday MARKET SEGMENT Tuasday Wednesday Thursday Friday Total 160 $ 110 $17,600 130 $ 110 $14,300 330 $ 130 $42,900 450 $ 145 $65,250 440 $ 145 $63,800 390 $ 140 $54,600 200 $ 110 $22,000 2,100 $ 133,55 $280,450 TRANSIENT REVENUE Rooms Sold Average Rate Total Transient Revenue GROUP REVENUE Rooms Sold Average Rate Total Group Revenue TOTAL REVENUE Total Rooms Solc Occupancy Percentage Average Rate Total Room Revenue 30 $ 100 $ 3.000 20 $ 100 $ 2.000 90 $ 120 $10,800 150 $ 125 $18.750 140 $ 125 $17,500 120 $ 125 $15.000 50 $ 100 $ 5.000 800 $ 120.08 $ 72.050 190 31.796 $108.42 $20.600 150 25.0% $108.67 $16,300 420 70.0% $127 86 $53.700 600 100% $140,00 $84.000 580 96,7% $140.17 581.300 510 85.096 $136.47 $69.600 250 41.796 $108.00 $27.000 2,700 64,3% $130 56 $352,500 3. Enter the Week 3 rooms sold from the rooms sold worksheet onto the Week 3 room revenue forecasting worksheet. 4. Use the same average daily rates (ADRs) as Week 1 for both the transient and group rooms sold. (Hint: Do NOT use the same ADRs for your TOTALS column) 5. Calculate the total room revenue for Week 3, and complete the Week 3 room revenue forecasting worksheet. MARKET SEGMENT SATURDAY SUNDAY MONDAY TUESDAY WEDNESDAY THURSDAY FRIDAY Total 170 20 190 150 25 175 330 45 375 TRANSIENT ROOMS Reservations Booked Reservations Pickup 10 Total Transient Reservations 11 12 GROUP ROOMS 13 Definate Group #1 14 Definate Group 2 Definate Group #13 Definate Group #14 17 Tenative Group #1 18 Total Group Reservations 125 40 40 30 25 30 20 20 40 40 50 15 16 40 30 70 20 30 50 40 70 230 20 TOTAL ROOM RESERVATIONS Rooms Sold Forecasting Worksheet-600 Rooms Week Offset Friday! Saturday Sunday MARKET SEGMENT Monday Tuesday Wednesday Thursday Total Friday 400 TRANSIENT ROOMS Reservations Bocked Reservations Pickup Total Transient Reservations 150 10 160 120 10 130 300 30 350 40 390 400 40 440 50 450 180 20 200 1900 200 2.100 Week 3 of January 2018 Another Busy Week for Flagstaff Hotel This can be done Individually or in a group. For the third week, the hotel is forecasting a busier week and more rooms sold (than week 1). To prepare the third week rooms sold forecast, have the first week's rooms sold forecast when making changes to week 3 numbers: 1. Increase the third week's rooms sold forecast as follows: a) Increase weekday transient room reservations 30 per day. b) Increase weekday transient pickup reservations 15 per day. c) Increase weekend transient room reservations 20 per day. d) Increase weekend transient pickup reservations 10 per day. 2. Insert the following week 3 group room blocks into the spreadsheet: 2. Insert the following week 3 group room blocks into the spreadsheet: 40 40 30 25 30 GROUP ROOMS Definate Group #1 Definate Group #2 Definate Group #3 Definate Group #4 Tenative Group #1 20 20 40 40 50 40 30 70 20 30 50 3. Enter the Week 3 rooms sold from the rooms sold worksheet onto the Week 3 room revenue forecasting worksheet. 4. Use the same average daily rates (ADRs) as Week 1 for both the transient and group rooms sold. (Hint: Do NOT use the same ADRs for your TOTALS column) 5. Calculate the total room revenue for Week 3, and complete the Week 3 room revenue forecasting worksheet Room Revenue Forecasting Worksheet SATURDAY SUNDAY MARKET SEGMENT MONDAY TUESDAY FRIDAY WEDNESDAY THURSDAY Total 245 230 500 430 555 640 650 3,250 TRANSIENT REVENUE 7 Rooms Sold 8 Average Rate 9 Total Transient Revenue 10 12.GROUP REVENUE 13 Rooms Sold 14 Average rate Total Group Revenue 15 17 TOTAL REVENUE Total Rooms Sold 19 Occupancy Percentage Average Rate 21 Total Room Revenue Room Revenue Forecasting Worksheet 1_Week Saturday Sunday Monday MARKET SEGMENT Tuasday Wednesday Thursday Friday Total 160 $ 110 $17,600 130 $ 110 $14,300 330 $ 130 $42,900 450 $ 145 $65,250 440 $ 145 $63,800 390 $ 140 $54,600 200 $ 110 $22,000 2,100 $ 133,55 $280,450 TRANSIENT REVENUE Rooms Sold Average Rate Total Transient Revenue GROUP REVENUE Rooms Sold Average Rate Total Group Revenue TOTAL REVENUE Total Rooms Solc Occupancy Percentage Average Rate Total Room Revenue 30 $ 100 $ 3.000 20 $ 100 $ 2.000 90 $ 120 $10,800 150 $ 125 $18.750 140 $ 125 $17,500 120 $ 125 $15.000 50 $ 100 $ 5.000 800 $ 120.08 $ 72.050 190 31.796 $108.42 $20.600 150 25.0% $108.67 $16,300 420 70.0% $127 86 $53.700 600 100% $140,00 $84.000 580 96,7% $140.17 581.300 510 85.096 $136.47 $69.600 250 41.796 $108.00 $27.000 2,700 64,3% $130 56 $352,500 3. Enter the Week 3 rooms sold from the rooms sold worksheet onto the Week 3 room revenue forecasting worksheet. 4. Use the same average daily rates (ADRs) as Week 1 for both the transient and group rooms sold. (Hint: Do NOT use the same ADRs for your TOTALS column) 5. Calculate the total room revenue for Week 3, and complete the Week 3 room revenue forecasting worksheet Step by Step Solution
There are 3 Steps involved in it
Step: 1

Get Instant Access to Expert-Tailored Solutions
See step-by-step solutions with expert insights and AI powered tools for academic success
Step: 2

Step: 3

Ace Your Homework with AI
Get the answers you need in no time with our AI-driven, step-by-step assistance
Get Started


