Answered step by step
Verified Expert Solution
Link Copied!

Question

1 Approved Answer

I cannot seem to get this right, please help I am lost Past records suggest that the mean annual income, Ilir of teachers in state

I cannot seem to get this right, please help I am lost
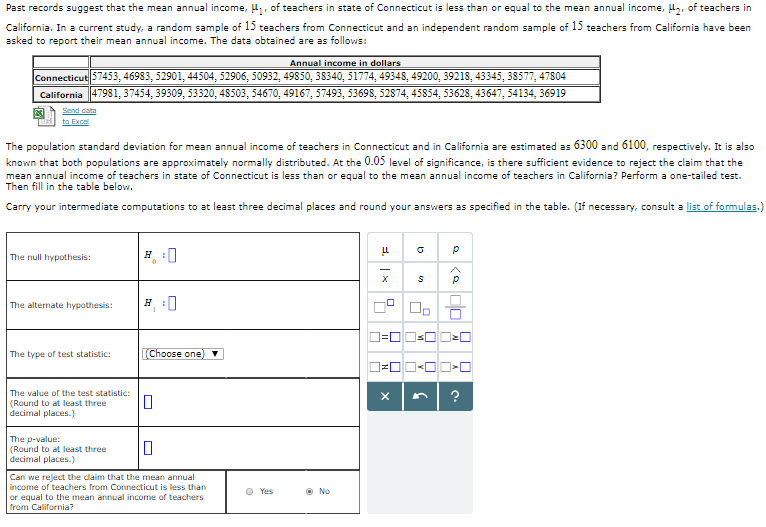
image text in transcribed
Past records suggest that the mean annual income, Ilir of teachers in state of Connecticut is less than or equal to the mean annual income, Ilor of teachers in California. In a current study, a random sample of 1) teachers from Connecticut and an independent random sample of 15 teachers from California have been asked to report their mean annual income. The data obtained are as follows: Annual income in dollars Connecticut| 57453, 46983, 52901, 44504, 52906, 50932, 49850, 38340, 51774, 49348, 49200, 39218, 43345, 38577, 47804 California 47981, 37454, 39309, 53320, 48503, 54670, 49167, 57493, 53698, 52874, 45854, 53628, 43647, 54134, 36919 Sand data DO ENDe The population standard deviation for mean annual income of teachers in Connecticut and in California are estimated as 6300 and 6100, respectively. It is also known that both populations are approximately normally distributed. At the 0.05 level of significance, is there sufficient evidence to reject the claim that the Then fill in the table below. mean annual income of teachers in state of Connecticut is less than or equal to the mean annual income of teachers in California? Perform a one-tailed test. Carry your intermediate computations to at least three decimal places and round your answers as specified in the table. (If necessary, consult a list of formulas.) The null hypothesis: H :I LL P x p The alternate hypothesis: H :0 nL Do 1=00=0 0=0 The type of test statistic: [Choose one) The value of the test statistic: Round to at least three X ? decimal places.) The p-value: Round to at least three decimal places.) Can we reject the claim that the mean annual income of teachers from Connecticut is less than or equal to the mean annual income of teachers O Yes O No from California

Step by Step Solution

There are 3 Steps involved in it

Step: 1

blur-text-image

Get Instant Access to Expert-Tailored Solutions

See step-by-step solutions with expert insights and AI powered tools for academic success

Step: 2

blur-text-image

Step: 3

blur-text-image

Ace Your Homework with AI

Get the answers you need in no time with our AI-driven, step-by-step assistance

Get Started

Recommended Textbook for

Transportation A Global Supply Chain Perspective

Authors: John J. Coyle, Robert A. Novak, Brian Gibson, Edward J. Bard

8th edition

9781305445352, 1133592961, 130544535X, 978-1133592969

More Books

Students also viewed these Mathematics questions