

Answered step by step
Verified Expert Solution
Question
1 Approved Answer
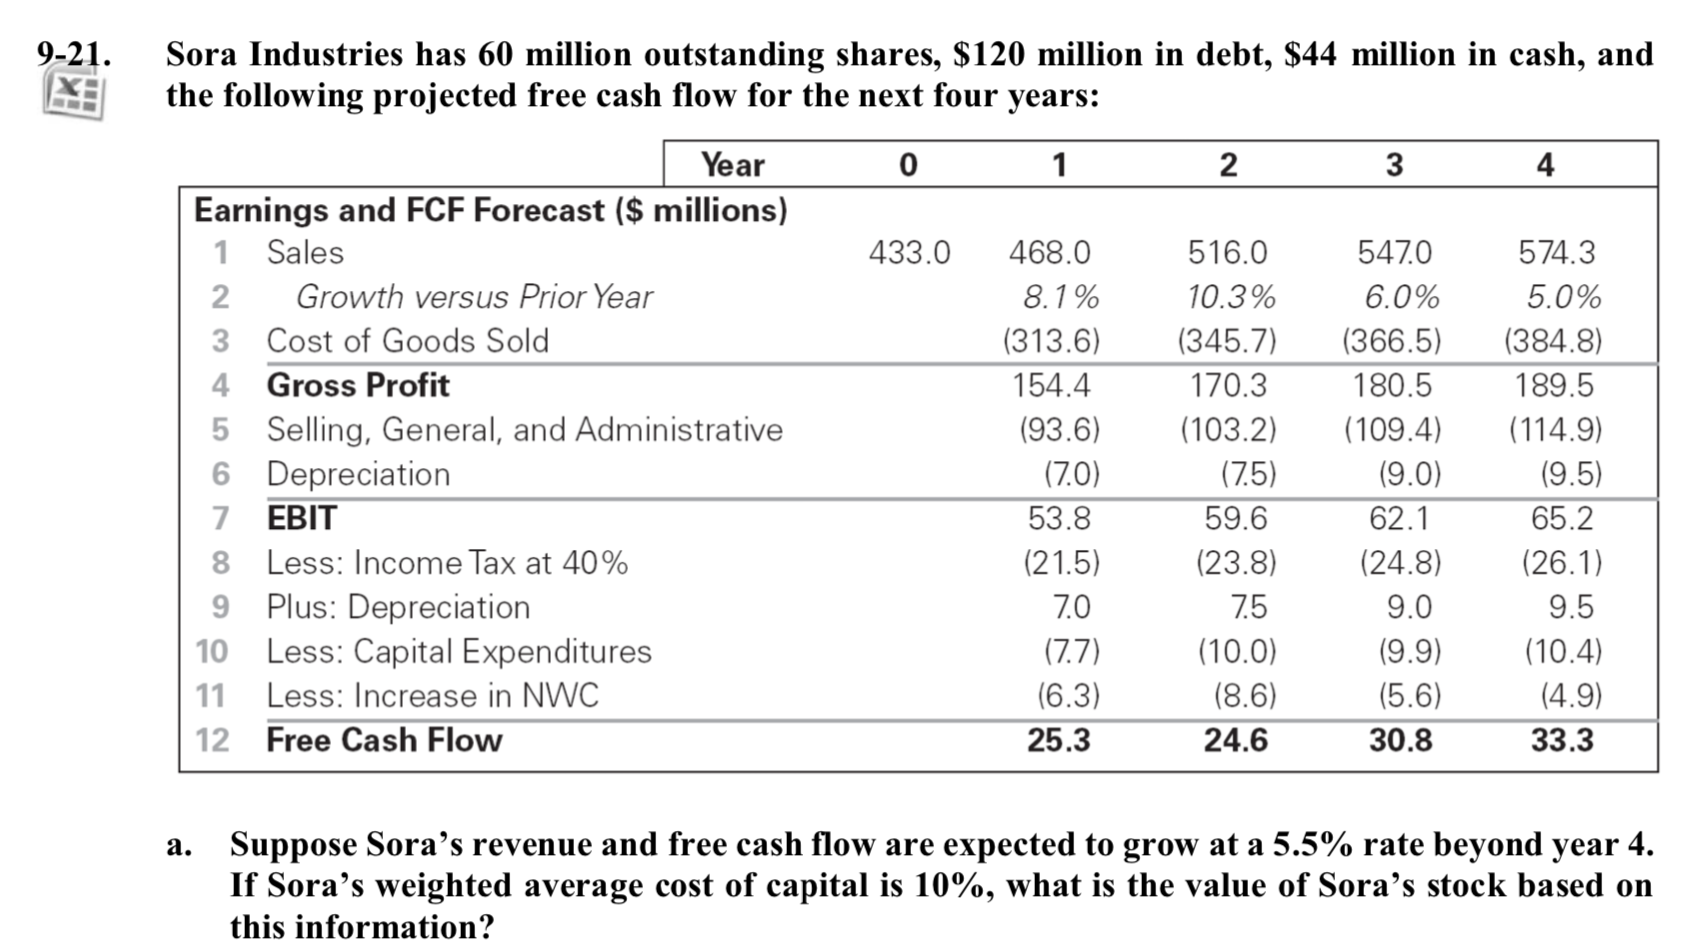
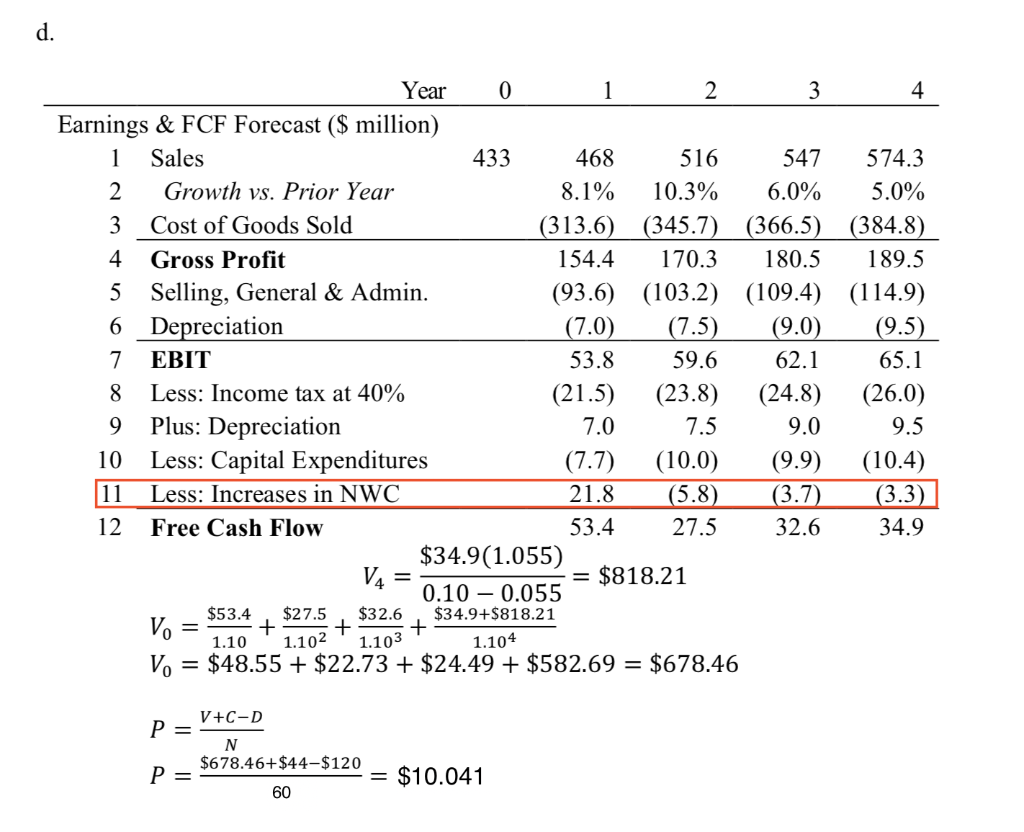
I can't understand how to calculate increase in nwc (year1 to 4, in a red box I marked) in answer of question d. Here are
I can't understand how to calculate increase in nwc (year1 to 4, in a red box I marked) in answer of question d.
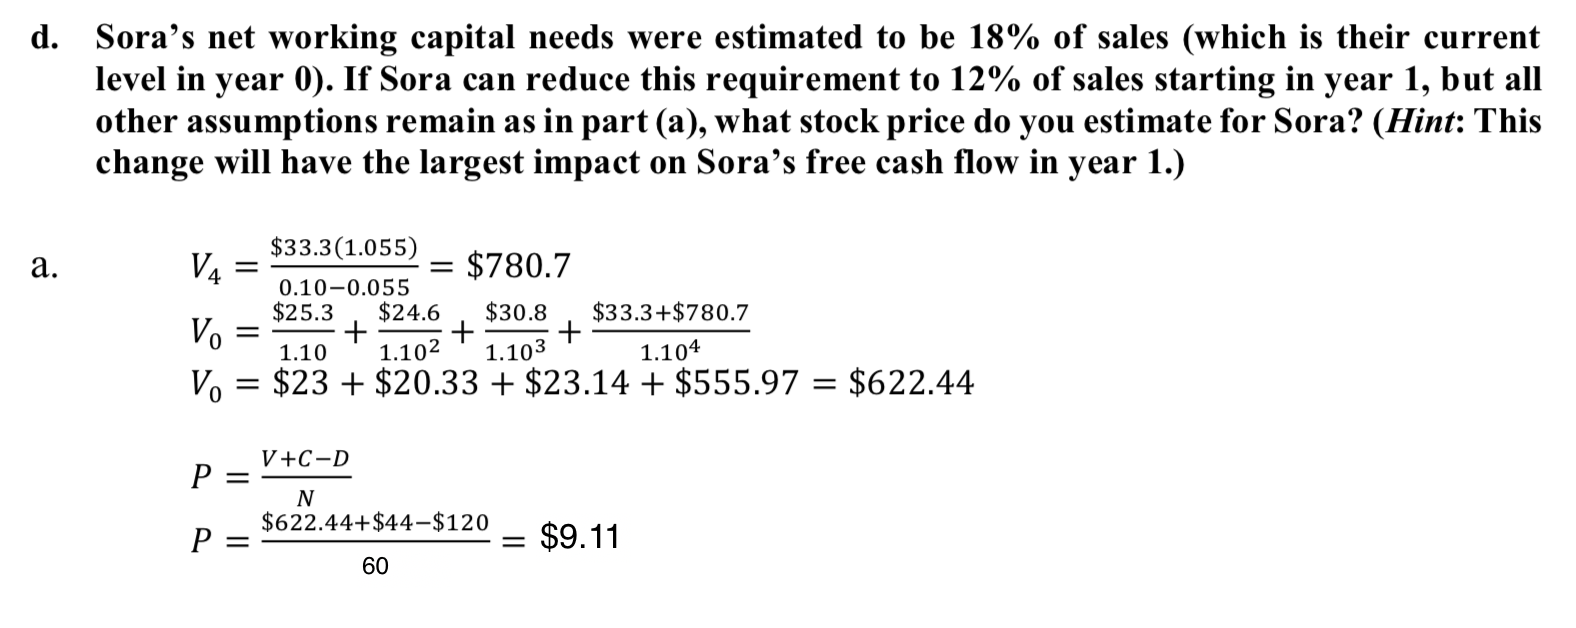
Here are the question a and d, and answers of them.
Please explain me how to calculate them.
Thanks:)
Step by Step Solution
There are 3 Steps involved in it
Step: 1

Get Instant Access to Expert-Tailored Solutions
See step-by-step solutions with expert insights and AI powered tools for academic success
Step: 2

Step: 3
Ace Your Homework with AI
Get the answers you need in no time with our AI-driven, step-by-step assistance
Get Started
Real Life Money An Honest Guide To Taking Control Of Your Finances
Authors: Clare Seal
1st Edition
1472272293, 978-1472272294