Answered step by step
Verified Expert Solution
Question
1 Approved Answer
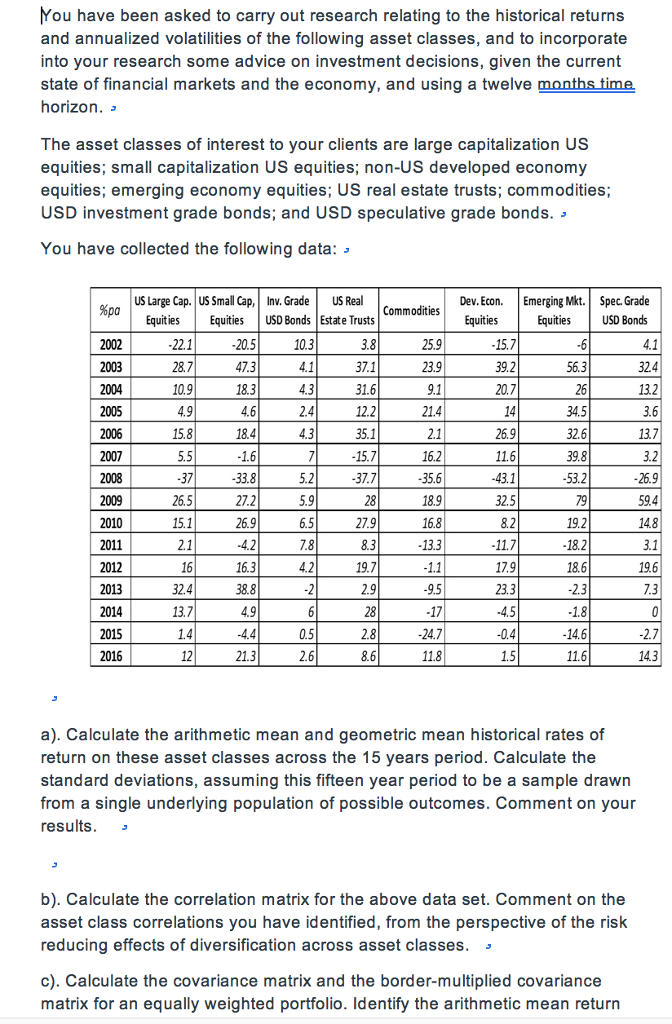
I can't upload the excel data. Please type these data to excel to calculate(When you need to use the excel) Please help me to answer
I can't upload the excel data. Please type these data to excel to calculate(When you need to use the excel)


Please help me to answer these questions. And I can 't upload the excel file. So the data just provide with photo. Thanks.
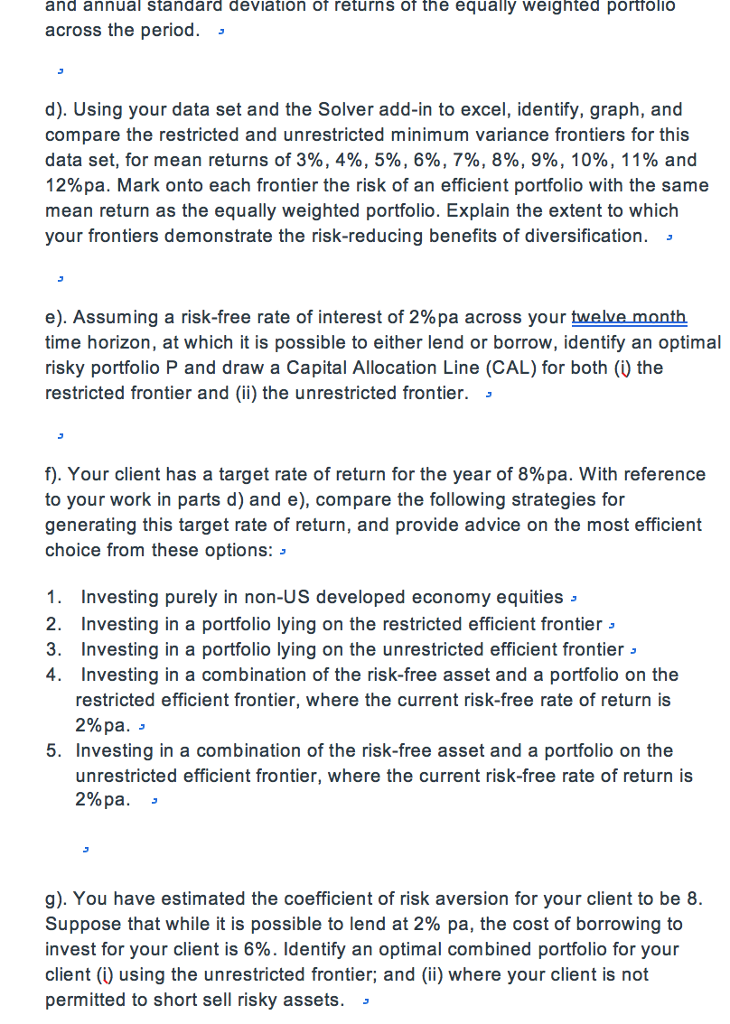
You have been asked to carry out research relating to the historical returns and annualized volatilities of the following asset classes, and to incorporate into your research some advice on investment decisions, given the current state of financial markets and the economy, and using a twelve horizon. The asset classes of interest to your clients are large capitalization US equities; small capitalization US equities; non-US developed economy equities; emerging economy equities; US real estate trusts; commodities; USD investment grade bonds; and USD speculative grade bonds. You have collected the following data: US Large Cap. US Small Cap, Inv. Grade US Real Dev.Econ. Emerging Mkt. Spec. Grade Equities %pa Commodities Equities USD Bonds Equities EquitiesUSD Bonds Estate Trusts 3.8 37.1 25.9 23.9 22.1 287 10.9 49 15.8 20.5 10.3 15.7 39.2 20.7 56.3 324 183 13.2 12.2 35.1 15.7 37.7 21.4 34.5 32.6 9.8 53.2 2005 18.4 26.9 11.6 2006 13.7 37 26.5 15.1 2.1 16 16.2 35.6 18.9 16.8 13.3 33.8 27.2 26.9 26.9 59.4 148 3.1 19.6 2009 2010 2011 2012 2013 2014 2015 2016 32.5 8.2 11.7 17.9 23.3 6.5 27.9 19.2 18.2 18.6 2.3 16.3 38.8 13.7 17 24.7 11.8 0.5 21.3 8.6 11.6 14.3 a). Calculate the arithmetic mean and geometric mean historical rates of return on these asset classes across the 15 years period. Calculate the standard deviations, assuming this fifteen year period to be a sample drawn from a single underlying population of possible outcomes. Comment on your results. > b). Calculate the correlation matrix for the above data set. Comment on the asset class correlations you have identified, from the perspective of the risk reducing effects of diversification across asset classes. c). Calculate the covariance matrix and the border-multiplied covariance matrix for an equally weighted portfolio. Identify the arithmetic mean returrnStep by Step Solution
There are 3 Steps involved in it
Step: 1

Get Instant Access to Expert-Tailored Solutions
See step-by-step solutions with expert insights and AI powered tools for academic success
Step: 2

Step: 3

Ace Your Homework with AI
Get the answers you need in no time with our AI-driven, step-by-step assistance
Get Started


