

Question
I can't wait to rate Download monthly historical Tesla stock price data from the Yahoo Finance website https://au.finance.yahoo.com/quote/TSLA/history?p=TSLA. Go to 'Historical data', se- lect the
I can't wait to rate
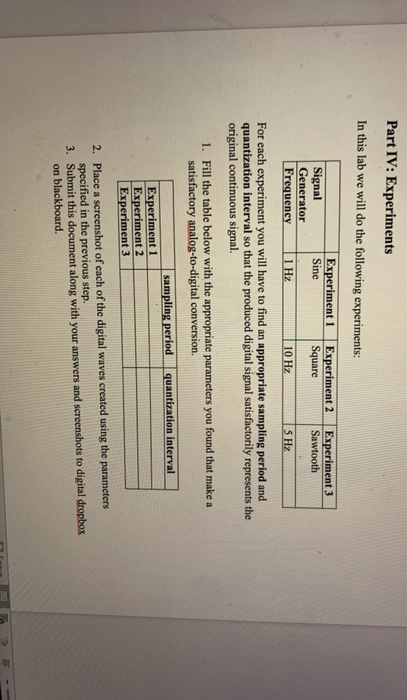
Download monthly historical Tesla stock price data from the Yahoo Finance website https://au.finance.yahoo.com/quote/TSLA/history?p=TSLA. Go to 'Historical data', se- lect the maximum time period by choosing 'Max' from the 'Time period' drop down menu, select 'Historical prices' from the 'Show' drop down menu, and finally choose 'Monthly' from the 'Fre- quency' drop down menu. Select 'Apply' and 'Download'. We will use the 'Date' variable and the 'Close' price for the sample July 2010 - March 2021 for this analysis. (10 marks)
Preliminary data analysis: Provide a plot of the data and discuss the important features of the close price time series. Discuss any potential problems for modelling the data. (10 marks)
Data transformation: The close price time series contains prices, but we are interested in mod- elling returns. Transform the time series to first differences and comment on the features of the transformed series. Do you expect any potential problems for modelling the transformed time series data? Would there be any benefit in modelling the first differences of the logarithm of the close price? (10 marks)
Develop a univariate time series model: Estimate an AR(p) model for the log returns. Explain how you use a correlogram and a statistical test for selecting the lag order p. (10 marks)
Standard errors: Check whether the standard errors of the estimates in an AR(4) model for log returns have to be adjusted. In case you conclude that that is the case, provide the adjusted standard errors. (10 marks)
Seasonality: Test whether there is seasonality in an AR(4) model for the log returns. (10 marks)
Incorporating qualitative information: In Questions 4, 5, and 6 you developed a standard time series model for log returns. However, we are not looking at a standard time series. We are looking at the log returns of Tesla stocks. The CEO of Tesla has been the topic of the news several times. How would you include the pieces of information in Figures 1-3 in your time series model? Estimate the coefficients in this model and discuss the results. Test the hypothesis that these three events have the same effect on the log returns of the Tesla stock. (10 marks)
Parameter interpretation: Using your model from Question 7, estimate and interpret the short- run and the long-run effects of the events in Figures 1-3. (10 marks)
Structural break: If we were to use our time series model to forecast future values of Tesla stock returns, we may not want to estimate the coefficients on all available data. The dynamics of the returns may change over time, so an estimation sample with only recent data included may provide a more accurate prediction of the future. Test whether the dynamics of the Tesla stock returns changed after the start of the Covid crisis in January 2020. (10 marks)
Prediction interval: Use your best time series model, estimated on the best estimation window according to Question 9, to construct and interpret the 95% prediction interval for next's month log return of the Tesla stock
Step by Step Solution
There are 3 Steps involved in it
Step: 1

Get Instant Access to Expert-Tailored Solutions
See step-by-step solutions with expert insights and AI powered tools for academic success
Step: 2

Step: 3
Ace Your Homework with AI
Get the answers you need in no time with our AI-driven, step-by-step assistance
Get Started
Beginning Algebra A Text/Workbook
Authors: Charles P McKeague
2nd Edition
1483271242, 9781483271248