

Answered step by step
Verified Expert Solution
Question
1 Approved Answer
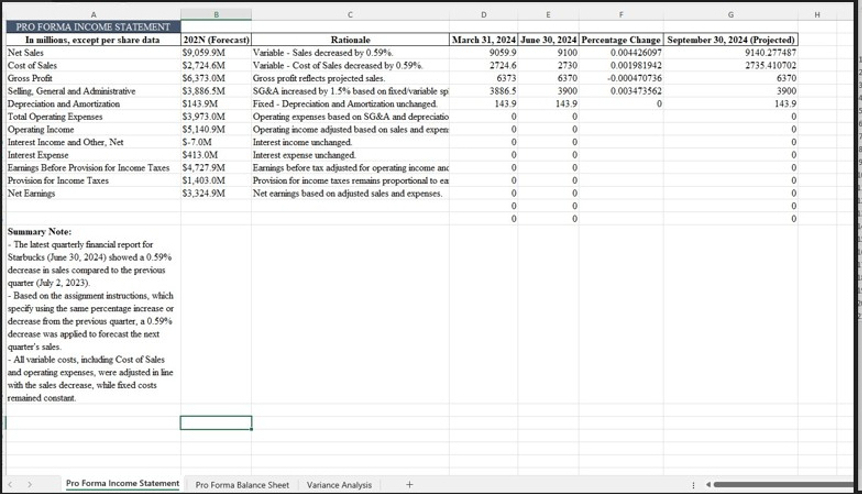
I completed the first 2 tabs but cannot understand how to do the Variance Analysis. In the Variance Analysis project, table [ [ A
I completed the first tabs but cannot understand how to do the Variance Analysis. In the Variance Analysis project, tableABCDEFGHPRO FORMA INCOME STATEMENTIn millions, except per share data,N ForecastRationale,March June Percentage Change,September ProjectedNet Sales,$MVariable Sales decreased by Cost of Sales,$MVariable Cost of Sales decreased by Gross Profit,$MGross profit reflects projected sales.,Selling General and Administrative,$MSG&A increased by based on fixedvariable spDepreciation and Amortization,$MFixed Depreciation and Amortization unchanged.,Total Operating Expenses,$MOperating expenses based on SG&A and depreciatio,Operating Income,$MOperating income adjusted based on sales and expen:,Interest Income and Other, Net,$MInterest income unchanged.,Interest Expense,$MInterest expense unchanged.,Earnings Before Provision for Income Taxes,$MEarnings before tax adjusted for operating income anc,Provision for Income Taxes,$MProvision for income taxes remains proportional to eaNet Earnings,$MNet earnings based on adjusted sales and expenses.,tableSummary Note: The latest quarterly financial report forStarbucks June showed a decrease in sales compared to the previousquarter July Based on the assignment instructions, whichspecify using the same percentage increase ordecrease from the previous quarter, a decrease was applied to forecast the nextquarters sales. All variable costs, including Cost of Salesand operating expenses, were adjusted in linewith the sales decrease, while fixed costsremained constant. Pro Forma Income Statement,Pro Forma Bala,ance Sheet Variance Analysis
Complete the Variance Analysis Sheet on the appropriate tab in the Financial Forecasting Template, using the downloaded data.
Calculate a quarterly variance analysis using the Variance Analysis tab of the Financial Forecasting Template the same template you used in Week Complete the following in your variance analysis:
In the Excel template, insert the line items.
In Column CPrevious Quarter, NN enter the previous quarters previous to the most recent quarter numbers as the budget.
In Column DCurrent Quarter, NN enter the current most recent quarters actual numbers.
In Column E the spreadsheet will calculate the dollar difference between the budget and actual numbers.
In Column F the spreadsheet will calculate the percentage change.
In Column G provide a rationale for the variances.
Note: This needs to be an MBA level of analysis. or line items in the variance analysis are significantly below expectations. You must have at least or moreline items in your variance analysis.
Step by Step Solution
There are 3 Steps involved in it
Step: 1

Get Instant Access to Expert-Tailored Solutions
See step-by-step solutions with expert insights and AI powered tools for academic success
Step: 2

Step: 3
Ace Your Homework with AI
Get the answers you need in no time with our AI-driven, step-by-step assistance
Get Started
Using Financial Accounting Information The Alternative to Debits and Credits
Authors: Gary A. Porter, Curtis L. Norton
7th Edition
978-0-538-4527, 0-538-45274-9, 978-1133161646