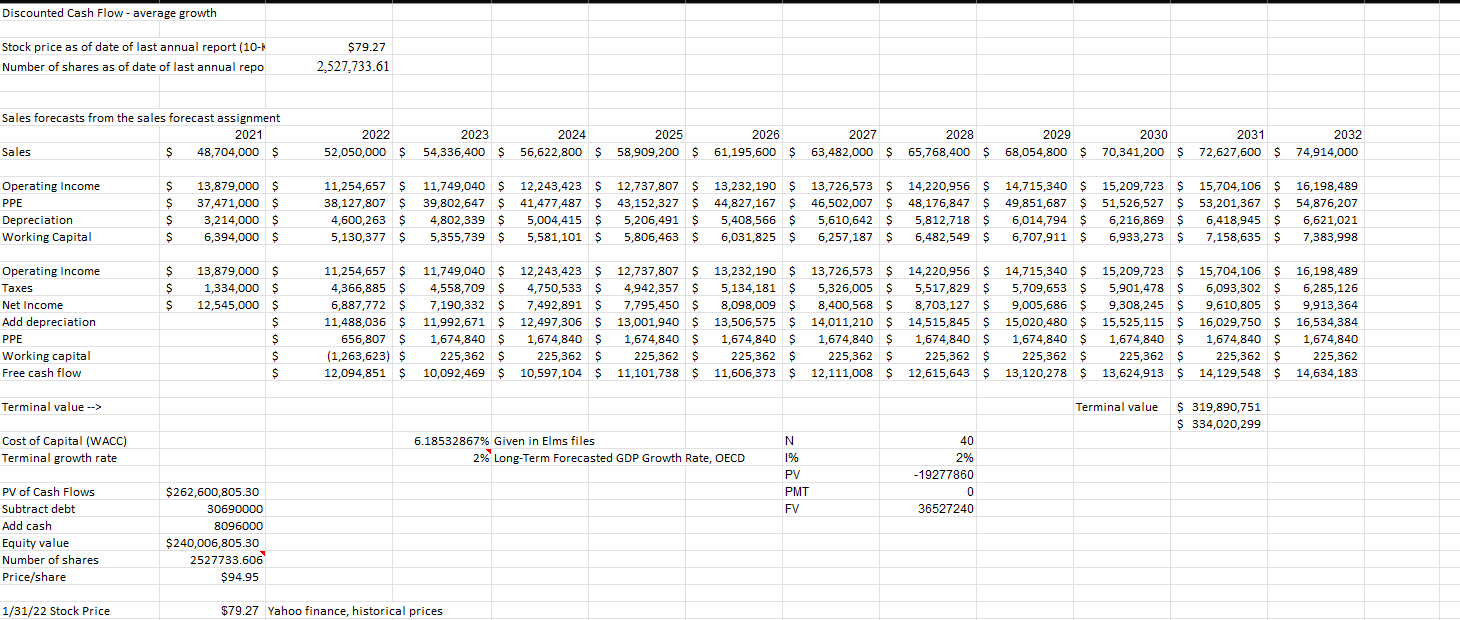
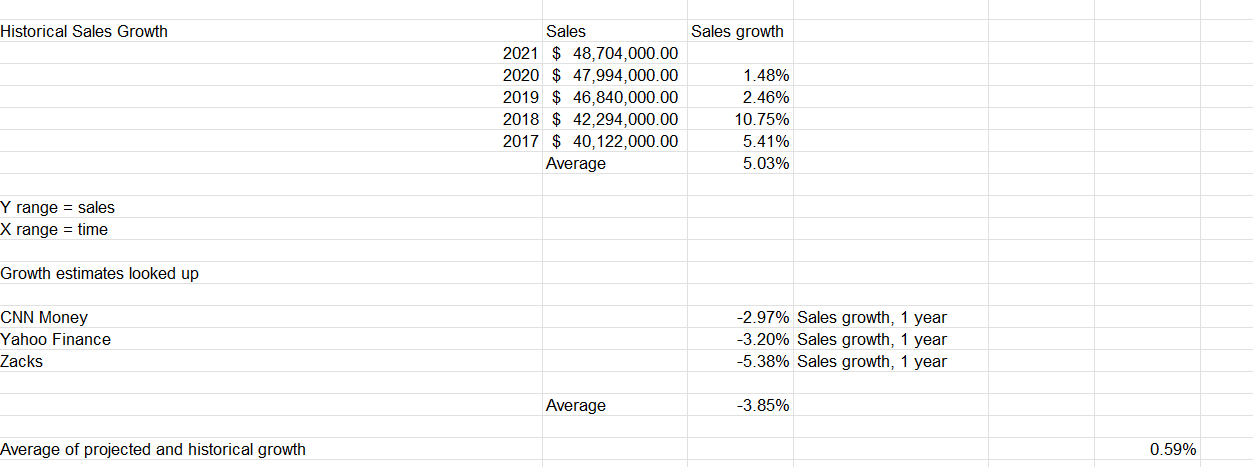
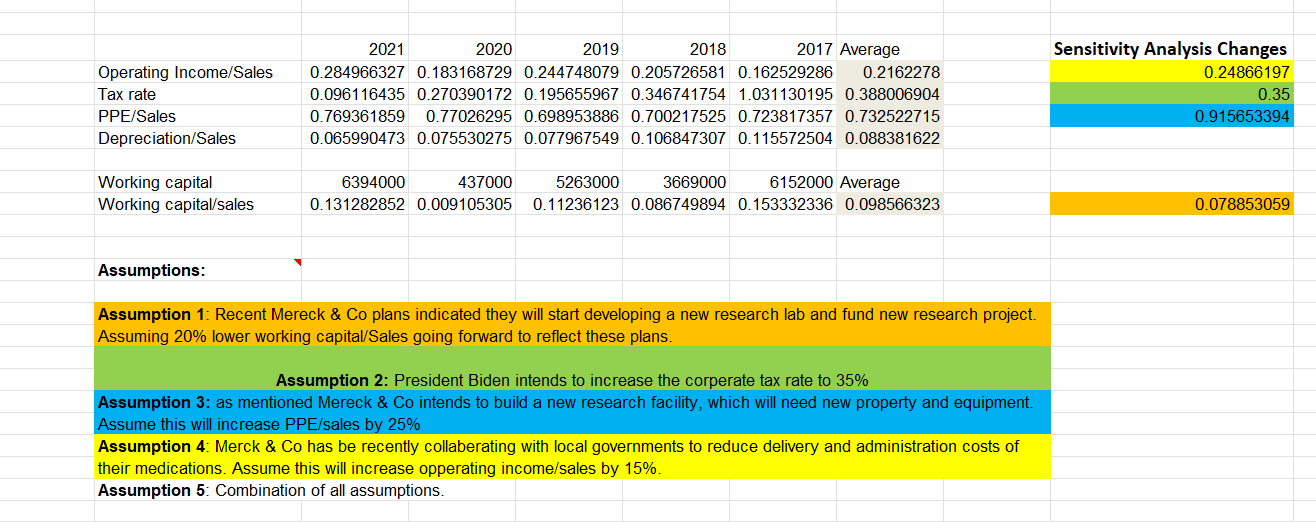
I conducted a DCF on MRK and need to answer the following questions.
 I can answer F and rest are based on this DCF:


A. What is your goal in doing the discounted cash flow analysis? B. What are the key questions you are trying to answer in this project? C. Does your evidence and data support the valuation of the company you analyzed? D. What techniques and concepts did you use to analyze and value your company? E. What assumptions did you make in coming up with your calculated value and stock price of your company? Why are your assumptions reasonable? F. What variables from that analysis showed the biggest effect on the stock price? As a result, what is your recommendation about the variables affecting the stock value? G. From what point of view are you analyzing the stock value? In other words, might there be some inherent biases in your overall analysis? Discounted Cash Flow - average growth Stock price as of date of last annual report (10-1 Number of shares as of date of last annual repo $79.27 2,527,733.61 Sales forecasts from the sales forecast assignment 2021 Sales $ 48,704,000 $ 2022 52,050,000 $ 2023 2024 2025 2026 2027 2028 2029 2030 2031 2032 54,336,400 $ 56,622,800 $ 58,909,200 $ 61,195,600 $ 63,482,000 $ 65,768,400 $ 68,054,800 $ 70,341,200 $ 72,627,600 $ 74,914,000 Operating Income PPE Depreciation Working Capital $ $ $ $ $ 13,879,000 $ 37,471,000 $ 3,214,000 $ 6,394,000 $ 11,254,657 S 38,127,807 $ 4,600,263 $ 5,130,377 $ 11,749,040 $ 12,243,423 $ 12,737,807 S 39,802,647 $ 41,477,487 $ 43,152,327 $ 4,802,339 $ 5,004,415 $ 5,206,491 S 5,355,739 $ 5,581,101 $ 5,806,463 $ 13,232,190 $ 13,726,573 $ 44,827,167 $ 46,502,007 $ 5,408,566 $ 5,610,642 $ 6,031,825 $ 6,257,187 $ 14,220,956 $ 14,715,340 $ 48,176,847 $ 49,851,687 $ 5,812,718 $ 6,014,794 $ 6,482,549 $ 6,707,911 $ 15,209,723 $ 15,704,106 $ 16,198,489 51,526,527 $ 53,201,367 $ 53,201,367 $ 54,876,207 6,216,869 $ 6,418,945 $ 6,621,021 6,933,273 $ 7,158,635 $ 7,383,998 $ $ $ $ Operating Income Taxes Net Income Add depreciation PPE Working capital Free cash flow 13,879,000 $ 1,334,000 $ 12,545,000 $ $ 11,254,657 $ 4,366,885 $ 6,887,772 $ 11,488,036 $ 656,807 $ (1,263,623) $ 12,094,851 $ 11,749,040 $ 4,558,709 $ 7,190,332 $ 11,992,671 $ 1,674,840 $ 225,362 $ 10,092,469 $ 12,243,423 $ 12,737,807 $ 4,750,533 $ 4,942,357 $ 7,492,891 $ 7,795,450 $ 12,497,306 $ 13,001,940 $ 1,674,840 $ 1,674,840 $ 225,362 $ 225,362 $ 10,597,104 $ 11,101,738 $ 13,232,190 $ 5,134,181 $ 8,098,009 S 13,506,575 $ 1,674,840 $ 225,362 $ 11,606,373 $ 13,726,573 $ 5,326,005 $ 8,400,568 $ 14,011,210 $ 1,674,840 $ 225,362 $ 12,111,008 $ 14,220,956 $ 14,715,340 $ 5,517,829 $ 5,709,653 $ 8,703,127 $ 9,005,686 $ 14,515,845 $ 15,020,480 $ 1,674,840 $ 1,674,840 $ 225,362 $ 225,362 $ 12,615,643 $ 13,120,278 $ 15,209,723 s 15,704,106 $ 5,901,478 $ 6,093,302 $ 9,308,245 $ 9,610,805 $ 15,525,115 $ 16,029,750 $ 1,674,840 $ 1,674,840 $ 225,362 $ 225,362 $ 13,624,913 $ 14,129,548 $ 16,198,489 6,285,126 9,913,364 16,534,384 1,674,840 225,362 14,634,183 $ $ $ Terminal value --> Terminal value $ 319,890,751 $ 334,020,299 Cost of Capital (WACC) Terminal growth rate 6.18532867% Given in Elms files 2% Long-Term Forecasted GDP Growth Rate, OECD N 1% PV PMT FV 40 2% - 19277860 0 36527240 PV of Cash Flows Subtract debt Add cash Equity value Number of shares Price/share $262,600,805.30 30690000 8096000 $240,006,805.30 2527733.606 $94.95 1/31/22 Stock Price $79.27 Yahoo finance, historical prices Historical Sales Growth Sales growth Sales 2021 $ 48,704,000.00 2020 $ 47,994,000.00 2019 $ 46,840,000.00 2018 $ 42,294,000.00 2017 $ 40,122,000.00 Average 1.48% 2.46% 10.75% 5.41% 5.03% Y range = sales X range = time Growth estimates looked up CNN Money Yahoo Finance Zacks -2.97% Sales growth, 1 year -3.20% Sales growth, 1 year -5.38% Sales growth, 1 year Average -3.85% Average of projected and historical growth 0.59% Operating Income/Sales Tax rate PPE/Sales Depreciation/Sales 2021 2020 2019 2018 2017 Average 0.284966327 0.183168729 0.244748079 0.205726581 0.162529286 0.2162278 0.096116435 0.270390172 0.195655967 0.346741754 1.031130195 0.388006904 0.769361859 0.77026295 0.698953886 0.700217525 0.723817357 0.732522715 0.065990473 0.075530275 0.077967549 0.106847307 0.115572504 0.088381622 Sensitivity Analysis Changes 0.24866197 0.35 0.915653394 Working capital Working capital/sales 6394000 437000 0.131282852 0.009105305 0 5263000 3669000 6152000 Average 0.11236123 0.086749894 0.153332336 0.098566323 0.078853059 Assumptions: Assumption 1: Recent Mereck & Co plans indicated they will start developing a new research lab and fund new research project. Assuming 20% lower working capital/Sales going forward to reflect these plans. Assumption 2: President Biden intends to increase the corperate tax rate to 35% Assumption 3: as mentioned Mereck & Co intends to build a new research facility, which will need new property and equipment. Assume this will increase PPE/sales by 25% Assumption 4: Merck & Co has be recently collaberating with local governments to reduce delivery and administration costs of their medications. Assume this will increase opperating income sales by 15%. Assumption 5: Combination of all assumptions. A. What is your goal in doing the discounted cash flow analysis? B. What are the key questions you are trying to answer in this project? C. Does your evidence and data support the valuation of the company you analyzed? D. What techniques and concepts did you use to analyze and value your company? E. What assumptions did you make in coming up with your calculated value and stock price of your company? Why are your assumptions reasonable? F. What variables from that analysis showed the biggest effect on the stock price? As a result, what is your recommendation about the variables affecting the stock value? G. From what point of view are you analyzing the stock value? In other words, might there be some inherent biases in your overall analysis? Discounted Cash Flow - average growth Stock price as of date of last annual report (10-1 Number of shares as of date of last annual repo $79.27 2,527,733.61 Sales forecasts from the sales forecast assignment 2021 Sales $ 48,704,000 $ 2022 52,050,000 $ 2023 2024 2025 2026 2027 2028 2029 2030 2031 2032 54,336,400 $ 56,622,800 $ 58,909,200 $ 61,195,600 $ 63,482,000 $ 65,768,400 $ 68,054,800 $ 70,341,200 $ 72,627,600 $ 74,914,000 Operating Income PPE Depreciation Working Capital $ $ $ $ $ 13,879,000 $ 37,471,000 $ 3,214,000 $ 6,394,000 $ 11,254,657 S 38,127,807 $ 4,600,263 $ 5,130,377 $ 11,749,040 $ 12,243,423 $ 12,737,807 S 39,802,647 $ 41,477,487 $ 43,152,327 $ 4,802,339 $ 5,004,415 $ 5,206,491 S 5,355,739 $ 5,581,101 $ 5,806,463 $ 13,232,190 $ 13,726,573 $ 44,827,167 $ 46,502,007 $ 5,408,566 $ 5,610,642 $ 6,031,825 $ 6,257,187 $ 14,220,956 $ 14,715,340 $ 48,176,847 $ 49,851,687 $ 5,812,718 $ 6,014,794 $ 6,482,549 $ 6,707,911 $ 15,209,723 $ 15,704,106 $ 16,198,489 51,526,527 $ 53,201,367 $ 53,201,367 $ 54,876,207 6,216,869 $ 6,418,945 $ 6,621,021 6,933,273 $ 7,158,635 $ 7,383,998 $ $ $ $ Operating Income Taxes Net Income Add depreciation PPE Working capital Free cash flow 13,879,000 $ 1,334,000 $ 12,545,000 $ $ 11,254,657 $ 4,366,885 $ 6,887,772 $ 11,488,036 $ 656,807 $ (1,263,623) $ 12,094,851 $ 11,749,040 $ 4,558,709 $ 7,190,332 $ 11,992,671 $ 1,674,840 $ 225,362 $ 10,092,469 $ 12,243,423 $ 12,737,807 $ 4,750,533 $ 4,942,357 $ 7,492,891 $ 7,795,450 $ 12,497,306 $ 13,001,940 $ 1,674,840 $ 1,674,840 $ 225,362 $ 225,362 $ 10,597,104 $ 11,101,738 $ 13,232,190 $ 5,134,181 $ 8,098,009 S 13,506,575 $ 1,674,840 $ 225,362 $ 11,606,373 $ 13,726,573 $ 5,326,005 $ 8,400,568 $ 14,011,210 $ 1,674,840 $ 225,362 $ 12,111,008 $ 14,220,956 $ 14,715,340 $ 5,517,829 $ 5,709,653 $ 8,703,127 $ 9,005,686 $ 14,515,845 $ 15,020,480 $ 1,674,840 $ 1,674,840 $ 225,362 $ 225,362 $ 12,615,643 $ 13,120,278 $ 15,209,723 s 15,704,106 $ 5,901,478 $ 6,093,302 $ 9,308,245 $ 9,610,805 $ 15,525,115 $ 16,029,750 $ 1,674,840 $ 1,674,840 $ 225,362 $ 225,362 $ 13,624,913 $ 14,129,548 $ 16,198,489 6,285,126 9,913,364 16,534,384 1,674,840 225,362 14,634,183 $ $ $ Terminal value --> Terminal value $ 319,890,751 $ 334,020,299 Cost of Capital (WACC) Terminal growth rate 6.18532867% Given in Elms files 2% Long-Term Forecasted GDP Growth Rate, OECD N 1% PV PMT FV 40 2% - 19277860 0 36527240 PV of Cash Flows Subtract debt Add cash Equity value Number of shares Price/share $262,600,805.30 30690000 8096000 $240,006,805.30 2527733.606 $94.95 1/31/22 Stock Price $79.27 Yahoo finance, historical prices Historical Sales Growth Sales growth Sales 2021 $ 48,704,000.00 2020 $ 47,994,000.00 2019 $ 46,840,000.00 2018 $ 42,294,000.00 2017 $ 40,122,000.00 Average 1.48% 2.46% 10.75% 5.41% 5.03% Y range = sales X range = time Growth estimates looked up CNN Money Yahoo Finance Zacks -2.97% Sales growth, 1 year -3.20% Sales growth, 1 year -5.38% Sales growth, 1 year Average -3.85% Average of projected and historical growth 0.59% Operating Income/Sales Tax rate PPE/Sales Depreciation/Sales 2021 2020 2019 2018 2017 Average 0.284966327 0.183168729 0.244748079 0.205726581 0.162529286 0.2162278 0.096116435 0.270390172 0.195655967 0.346741754 1.031130195 0.388006904 0.769361859 0.77026295 0.698953886 0.700217525 0.723817357 0.732522715 0.065990473 0.075530275 0.077967549 0.106847307 0.115572504 0.088381622 Sensitivity Analysis Changes 0.24866197 0.35 0.915653394 Working capital Working capital/sales 6394000 437000 0.131282852 0.009105305 0 5263000 3669000 6152000 Average 0.11236123 0.086749894 0.153332336 0.098566323 0.078853059 Assumptions: Assumption 1: Recent Mereck & Co plans indicated they will start developing a new research lab and fund new research project. Assuming 20% lower working capital/Sales going forward to reflect these plans. Assumption 2: President Biden intends to increase the corperate tax rate to 35% Assumption 3: as mentioned Mereck & Co intends to build a new research facility, which will need new property and equipment. Assume this will increase PPE/sales by 25% Assumption 4: Merck & Co has be recently collaberating with local governments to reduce delivery and administration costs of their medications. Assume this will increase opperating income sales by 15%. Assumption 5: Combination of all assumptions
 I can answer F and rest are based on this DCF:


