I currently am making a graph on excel, and I want to add an extra data point that I obtained from interpolation of the data
I currently am making a graph on excel, and I want to add an extra data point that I obtained from interpolation of the data sets I used for the plot. Like so,

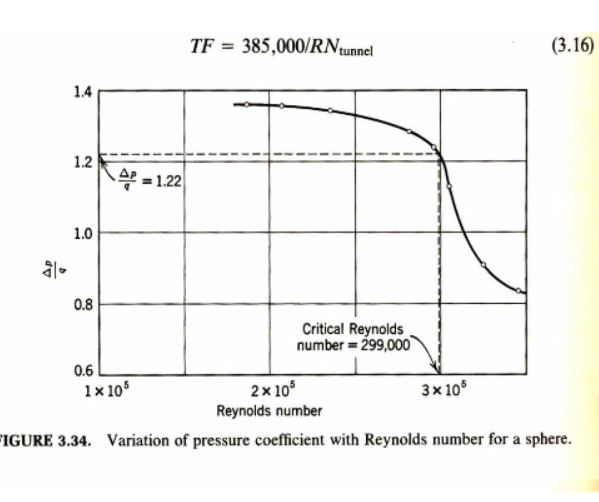
My graph looks very similar to this one, except I want to add the dotted line that starts at the y axis value of 1.22 and connect it with the critical reynolds number I obtained by interpolation of the data set I used. Is it possible to add this dotted line at a y value of 1.22 without having to change the increments on the y axis? and the same for the x value I obtained. Thanks
TF = 385,000/RNtunnel (3.16) 1.4 2- A P 2 = 1.22 1.0 0.8 Critical Reynolds number = 299,000 0.6 2 x 10 Reynolds number 1x10⁵ 3x 10⁶ IGURE 3.34. Variation of pressure coefficient with Reynolds number for a sphere. TF = 385,000/RNtunnel (3.16) 1.4 2- A P 2 = 1.22 1.0 0.8 Critical Reynolds number = 299,000 0.6 2 x 10 Reynolds number 1x10⁵ 3x 10⁶ IGURE 3.34. Variation of pressure coefficient with Reynolds number for a sphereStep by Step Solution
There are 3 Steps involved in it
Step: 1

See step-by-step solutions with expert insights and AI powered tools for academic success
Step: 2

Step: 3

Ace Your Homework with AI
Get the answers you need in no time with our AI-driven, step-by-step assistance
Get Started


