Answered step by step
Verified Expert Solution
Question
1 Approved Answer
i Data 1 / 5 75 IDENTIFY THE INDUSTRY-ANALYSIS OF FINANCIAL STATEMENT DATA Since companies in the same industry face similar opportunities and constraints, they
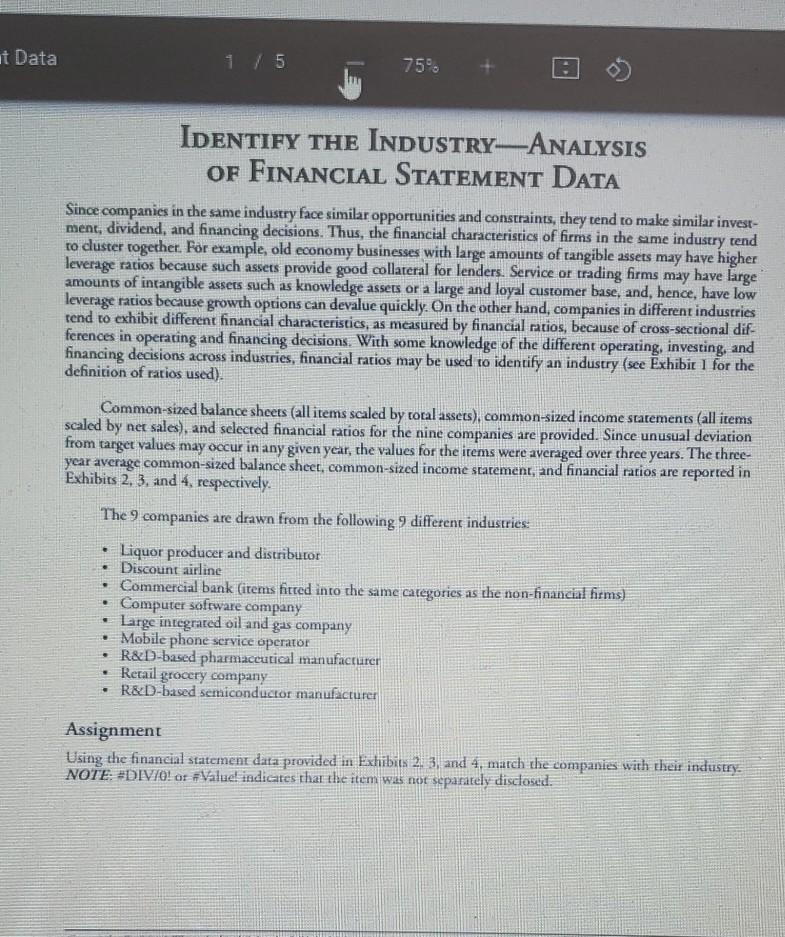
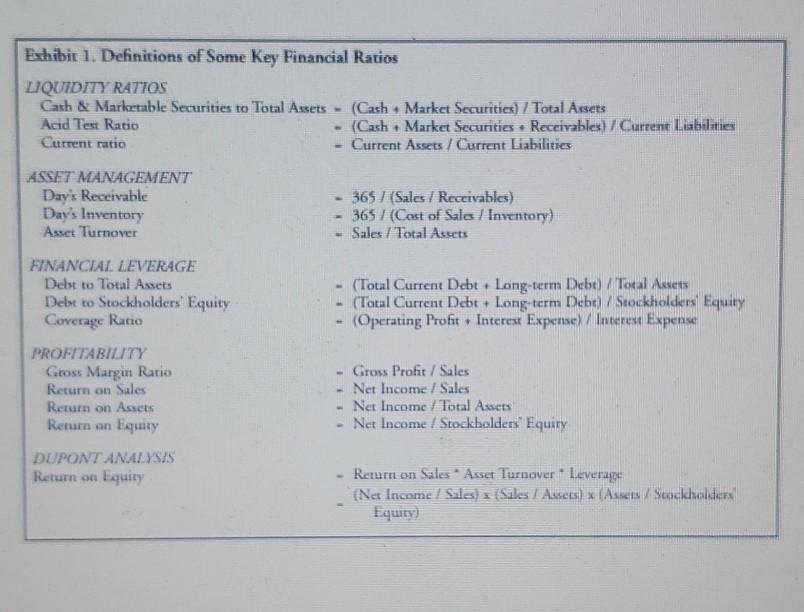
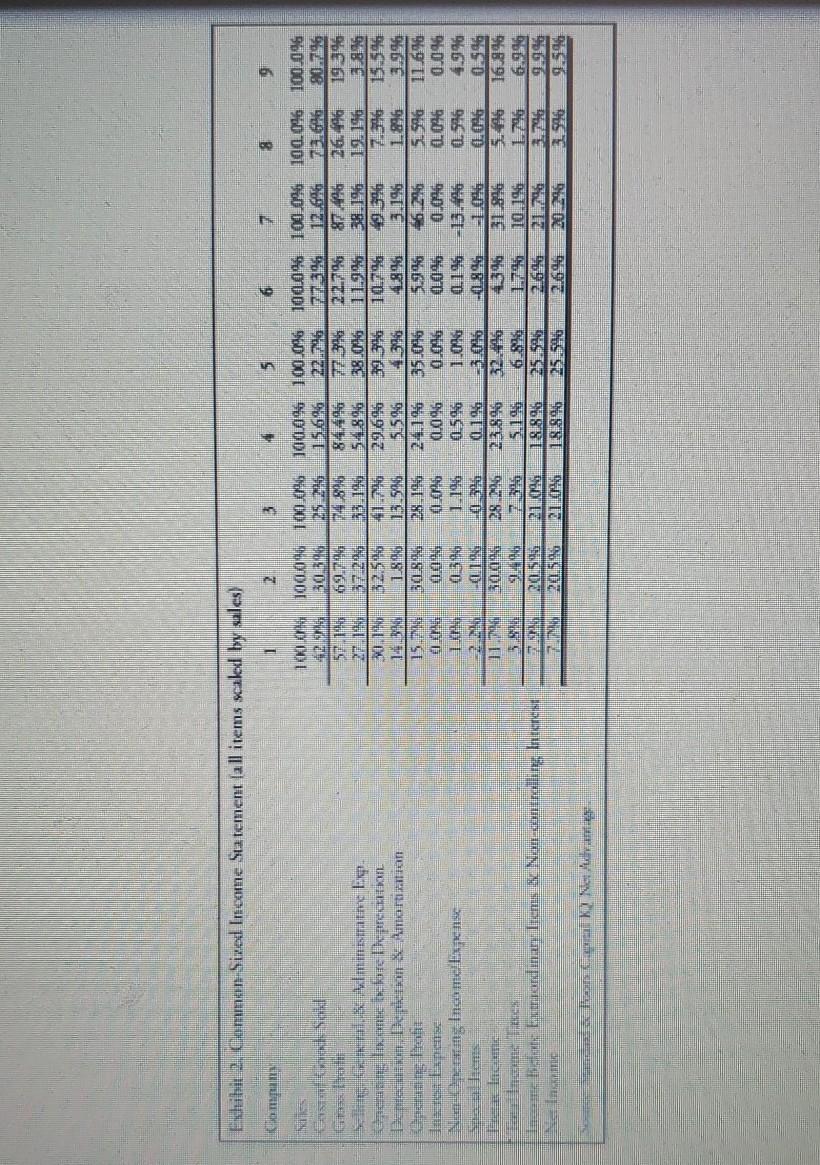
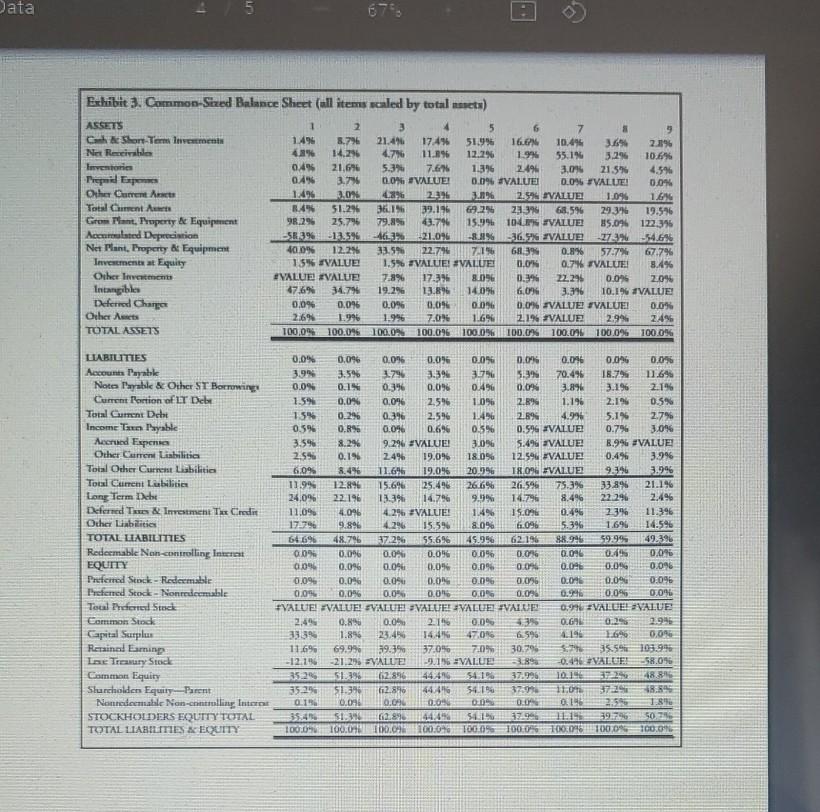
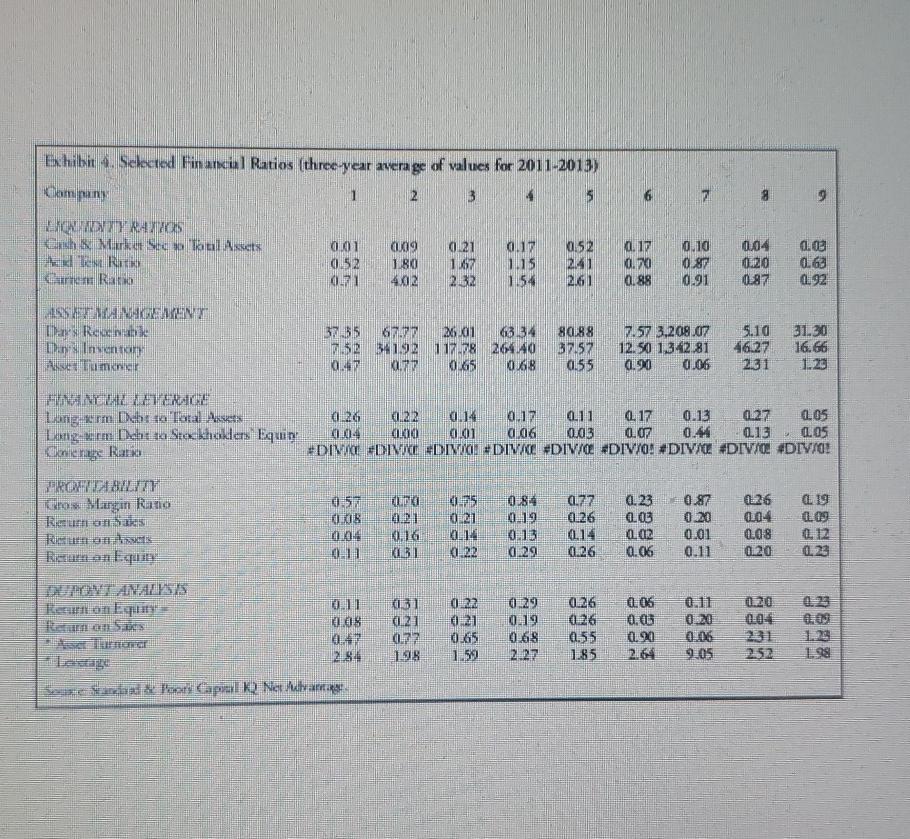
i Data 1 / 5 75 IDENTIFY THE INDUSTRY-ANALYSIS OF FINANCIAL STATEMENT DATA Since companies in the same industry face similar opportunities and constraints, they tend to make similar invest- ment, dividend, and financing decisions. Thus, the financial characteristics of firms in the same industry tend ro cluster together. For example, old economy businesses with large amounts of rangible assets may have higher leverage ratios because such assets provide good collateral for lenders. Service or trading firms may have large amounts of intangible assets such as knowledge assets or a large and loyal customer base, and, hence, have low leverage ratios because growth options can devalue quickly. On the other hand, companies in different industries tend to exhibit different hinancial characteristics, as measured by financial ratios, because of cross-sectional dif- ferences in operating and financing decisions. With some knowledge of the different operating, investing, and financing decisions across industries, financial ratios may be used to identify an industry (see Exhibit 1 for the definition of ratios used). Common-sized balance sheets (all items scaled by total assets), common-sized income statements (all items scaled by net sales), and selected financial ratios for the nine companies are provided. Since unusual deviation from target values may occur in any given year, the values for the items were averaged over three years. The three- year average common-sized balance sheet, common-sized income statement, and financial ratios are reported in Exhibits 2, 3, and 4, respectively. The 9 companies are drawn from the following 9 different industries Liquor producer and distributor Discount airline Commercial bank (items fitted into the same categories as the non-financial firms) Computer sofrware company Large integrated oil and gas company Mobile phone service operator R&D-based pharmaceutical manufacturer Retail grocery company R&D-based semiconductor manufacturer Assignment Using the financial statement data provided in Exhibits 2. 3, and 4, match the companies with their industry- NOTE: #DIV/0! 0 F Value indicates that the item was not separately disclosed. Exhibit 1. Definitions of Some Key Financial Ratios LIQUIDITY RATIOS Cash & Marketable Securities to Total Assets - (Cash Market Securities) / Total Assets Acid Test Ratio (Gash. Market Securities Receivables) / Current Liabilities Current ratio Current Assets / Current Liabilities ASSET MANAGEMENT Day's Receivable Day's Inventory Asset Turnover 365 (Sales ! Receivables) 365 / (Cost of Sales / Inventory) Sales / Total Assets (Total Current Debt. Long-term Debe) / Tocal Assets (Total Current Debt. Longterm Debt / Stockholders Equity (Operating Profit. Interest Expense) / Interest Expenser FINANCIAL LEVERAGE Debt to Total Assets Debt to Stockholders Equity Coverage Ratio PROFITABILITY Gross Margin Ratio Return on Sales Return on Assets Retum on Equity DUPONT ANALYSIS Return on Equity Gross Profit/Sales Net Income / Sales Net Income / Total Assets Net Income / Stockholders' Equity Rerum on Sales Asset lurnover - Leverage {Net Income Sales) I Sales Assets) Assets Scodicholders Equity) Esbit 2. Common Sized Income Statement lall items scaled by ules) 1 2 3 5 6 B 9 ada al. Wministarn Eg. brechasing loon backare prodhon Detection Dekton & Amaralian 100 1000 100.096 1000 100.096 100.0% 100.0% 100.0% 100.096 393 25 25 15626 22.126 77305 12.6 90-7196 69.74 FB 26.496 1939 372 33.190 54896 3806 38.196 12.196 30 41796 29.646 49596 15.596 14.30 1.8186 13.56 5.5.96 4.396 4.8% 1.896 3.946 15.2 B084 28.196 24.1% 46.296 51596 11.676 0096 0.996 0.04 0.006 0.046 0.096 1 1.196 95% 1.0% 0.19613.46 4.996 2010 019 3016 (1996 01.096 0.596 11. 28.2:16 32.4% 31 916 16.996 5. 9496 7355 5145 6.846 10.196 1.796 6.996 2016 21046 18.896 25.593 264 9.99% LINN 20596 21 18.995 2.696 31.590 9.594 WID Iako la Namming Inaime Expanse Seaca liems ) NID SIDE uc Income Boate bucurordinary Item No-controllin Interest Sociazione Q2 Newlane - Data 5 67% . Exhibit 3. Common-Sized Balance Sheet (all items scaled by total asets) ASSETS 1 2 3 4 5 7 9 Gh & Short Term Investments 1.49 8.796 21.49 17:49 51.996 16. 10.45 3.6% 2.8% Net Receivables 43 14.296 4.7% 11.895 12.296 1.9 55.18 3.296 10.6% Inventorn 0.4% 21.6% 5.3% 7.68 1.896 2496 3.09 21.5% 4.5% Prepaid Expo 0.4% 3.7% 0.0%. #VALUE! 0.0% VALUE 0.0% FVALUEI 0.0% Other Current Art 1.496 20. 226 2.09 2.574 VALUE 1.0% 1.6% Total Cament A 3.4% 51.2% 36.16 39.17 69.29 23. 68.596 29.3 19.576 Grom Plant Property & Equipment 98.296 25.7% 79.8% 43.79 15.99 104 VALUE 25.0% 122.356 Accumulated Depreciation SE3% -12.5% 46.3% 21.09 -33% $36.9% VALUE 273%-54.6 Net Plant, Property & Equipment 40.0% 12.2% 33.94 22.79 7.1% 68.3% 0.8% 57.7% 67.7% Investments Equity 15% SVALUE 1.5% #VALUE! #VALUE! 01.05 0.7% FVALUE! 8.4% Other In HYALUE VALUE 7.8% 17.39 8096 0.3% 22.296 0.09 20% Intangibles 47.6% 34.79 19.296 13.8% 140% 6,0% 3.16 10.19 VALUE Deferred Charges 0.0% 0.09 0.09 0.05 0.06 0,0% VALUE VALUE 0.0% Other Acts 2:6% 1.996 1.996 7.09 1.6% 2.1% VALUE 2.9% 24% TOTAL ASSETS 100,0% 100.0% 100.0 100.0% 100.0% 100.0% 100.000 100.0% 100.0% LABILITIES Accounts Payable Notes lwyable & Other ST Borrowing Current Portion of LT Debe Total Current Dehat Income Tax Payable Accrued Expenie Other Current abilities Total Other Current Liabilities Total Current Lubilities Long Term Dehu Deferred T & Investment The Credit Other Liabilities TOTAL LIABILITIES Redeemable Non-controlling Internet EQUITY Preferred Stock - Redermable Preferred Stock - Nonmdeemable Total Trend Stock Common Stock Capital Surplus Reinad Eaming I e Traury Stock Common Equity Sluncholdens EquityParent Nonredeemable Non-controlling Internet STOCKHOLDERS EQUITY TOTAL TOTAL LIABILITIES & EQUITY 0.0% 0.096 0.0% 0.09 0.056 0.0 0.06 0.046 0.096 3.99 3.5% 3.79 3.59 3075 5. 70.49 18.79 11.6% 0.0% 0.1 0.3% 0.09 0.496 0.0% 3.89 3.196 219 1.59 0.0% 0.096 2.5% 10% 2.8% 1.196 2:19 0.5% 15% 0.296 0.3% 2.596 11498 2.8% 4.99 5.1 2.7% 0.5% 0.1% 0.096 0.6% 0.5% 0.596 VALUE 0.7% 3.0% 3.59 8.2% 9.296 VALUE! 3.0% 5.496 VALUE 8.996 VALUE 2.596 0.1% 24% 19.09% 18.0% 12.594 VALUE 0.496 3.9% 60% 8.49 11.66 19.096 20.99 18.09 EVALUE 9.396 3.9% 11.9% 12.896 15.6% 25.496 26.6% 26.596 75.3% 33.89 21.196 24,0% 22.196 13.3% 14.7% 9.03% 14.796 8.496 22296 2.496 11.09 14.096 4.29 VALLE! 1.4% 15.09 0.4% 23% 11:39 1779 9.896 4.296 15.59 8.0% 19.096 5.3% 1.6% 14.596 64696 48.796 3726 55.6% 45.996 62 196 88.99 59.99 49.396 0.0% 0.096 0.0 0.096 0.0% 0.0% 0.096 0.49 0.09 0.09 0.046 0.09 0.09 0.0% 0.00 0.0 0.09 0.096 0.096 0.04 0.05 DON 0.096 0.096 0.0 0.0% 0.096 0.0 0.096 0.0 0.06 0.0 0.0% 0.99 0.09% #VALUE#VALUE! VALUE VALUE VALUE VALUE 0.9% VALUE VALUE 0.89 0.04 21 0.0% O.GAL 0.29 3339 1.8% 23:44 14:49 4705 6.596 4.100 0.09 11.69 69.99 39:39 37.09% % 7.0% 30.29 S. 35.59 103.99 - 12.196-21.295 VALLE -9.196 VALUE -0.446 VALUE 58.0% 35.21.24 62.896 44.490 54.1937.996 10.19 12348.8% 35.2% 51.3% f2.860 44.46 54.194 370 11.0 37-19 1.9 0198 0.07 0.04 0.04 009 0196 1.898 35.41. 62.83 144915915995026 1000 1000 100.000.040 TOG 05 1000 096 100.0 100.0 0.09 Exhibit 4. Selected Financial Ratios (three-year average of values for 2011-2013) Company 2 3 4 5 2 6 7 g 9 LONDRES Kinh & Market C m nl Assets NIE Gure RANO 0.01 0.52 021 0209 LO 4.02 021 1.67 2.32 0.17 1.15 154 0.52 241 2.61 0.17 0.70 0.88 0.10 0.87 0.91 0.04 020 0.87 0.00 0.63 0.92 ASSEMENT Das Rechable Day Inventory mer 6717 225.01 63.34 te 419 117.78 264.40 07 0.77 065 0.68 80,88 B7.57 0.55 7.57 3.208.07 12.50 1.342.81 0.90 0.06 5.10 46.27 231 3130 16.66 1.23 ENCE Longerme Dobrna Tora Assen 026 0.22 0.14 0.17 0.11 0.17 0.13 27 2.05 Lorigem Debt 10 Stokholders Equin 004 2010 0.01 01.06 0.03 0.07 0.4 0.13 Concrage Ratio #DIVIDIO DI #DIV/KE #DIV/O #DIV/0! #DIV/C#DIV/0! #DIV/0! 205 ROTWF o Margin Ratio kanon Sales Pants Brumon Equine 95 COB Cuma 21 16 131 05 0 1 21 0 22 0.84 019 013 0:29 0.77 0.26 01: 0.26 0.23 0.03 01.02 0.87 0.20 0.01 0.11 0:26 0.04 0.08 0120 19 01.09 12 0.23 11 0.06 DIT ANALYSIS (131 (121 008 RSDOS 022 0.21 0.65 1 59 0.29 0.19 9.68 2.27 0.26 026 0.55 1.85 0.06 0.0 0.90 26 0.11 0.20 0.06 9.05 1.20 0.04 231 252 0.09 1.23 1.98 24 198 Sexe Sardai Port Gpal Net Mallvarnare
Step by Step Solution
There are 3 Steps involved in it
Step: 1

Get Instant Access to Expert-Tailored Solutions
See step-by-step solutions with expert insights and AI powered tools for academic success
Step: 2

Step: 3

Ace Your Homework with AI
Get the answers you need in no time with our AI-driven, step-by-step assistance
Get Started


