

Answered step by step
Verified Expert Solution
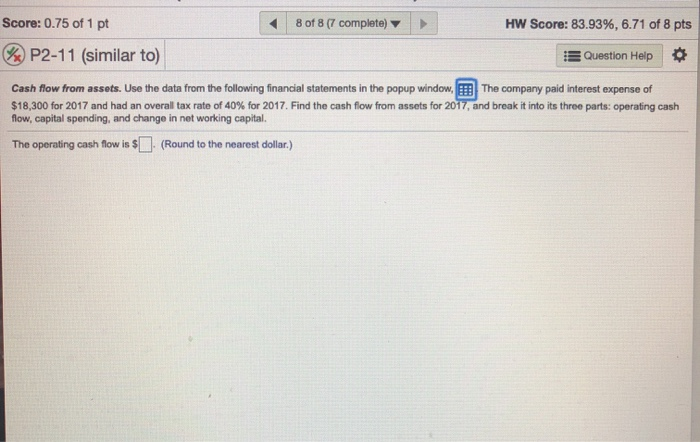
Question
1 Approved Answer
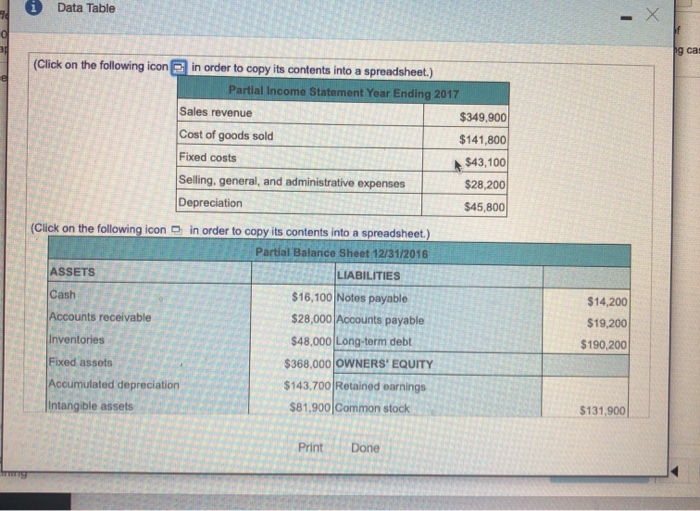
i Data Table (Click on the following icon in order to copy its contents into a spreadsheet.) Partial Income Statement Year Ending 2017 Sales revenue
Step by Step Solution
There are 3 Steps involved in it
Step: 1

Get Instant Access to Expert-Tailored Solutions
See step-by-step solutions with expert insights and AI powered tools for academic success
Step: 2

Step: 3
Ace Your Homework with AI
Get the answers you need in no time with our AI-driven, step-by-step assistance
Get Started
Financial Management Concepts and Applications
Authors: Stephen Foerster
1st edition
013293664X, 978-0132936644