I desperately need help! Please give me step by step instructions of what to enter into each cell as a formula. Thank you!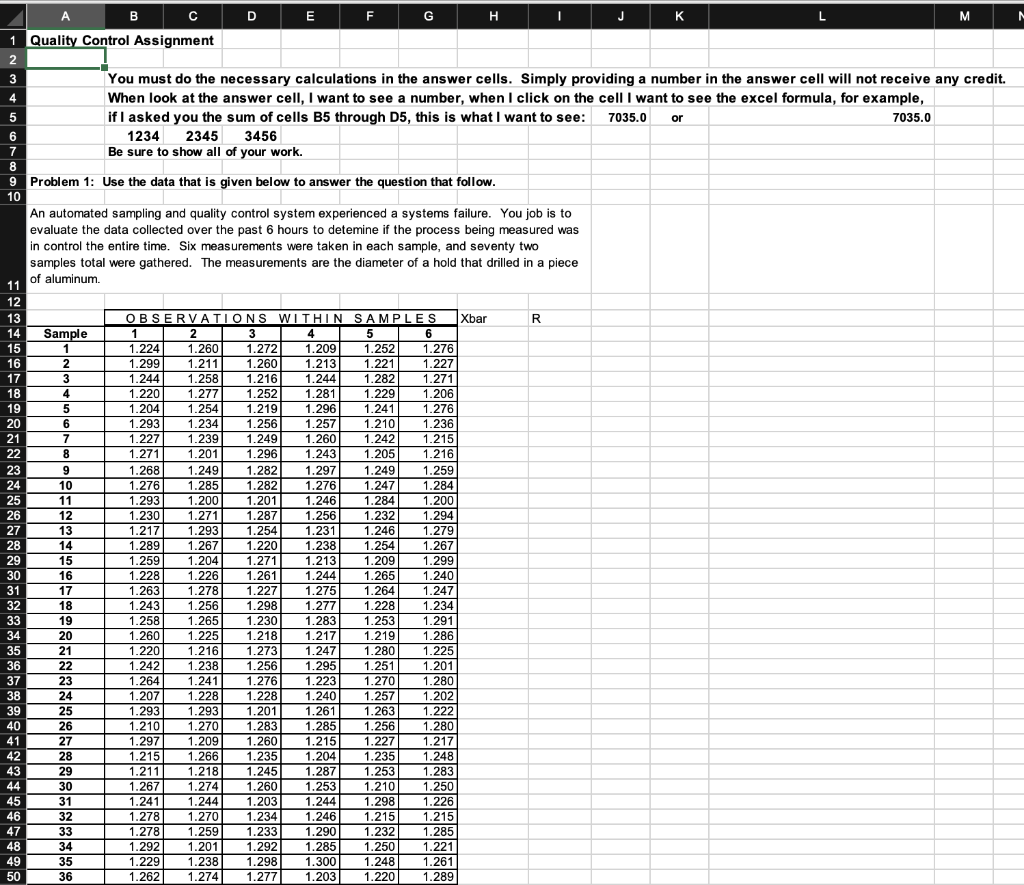
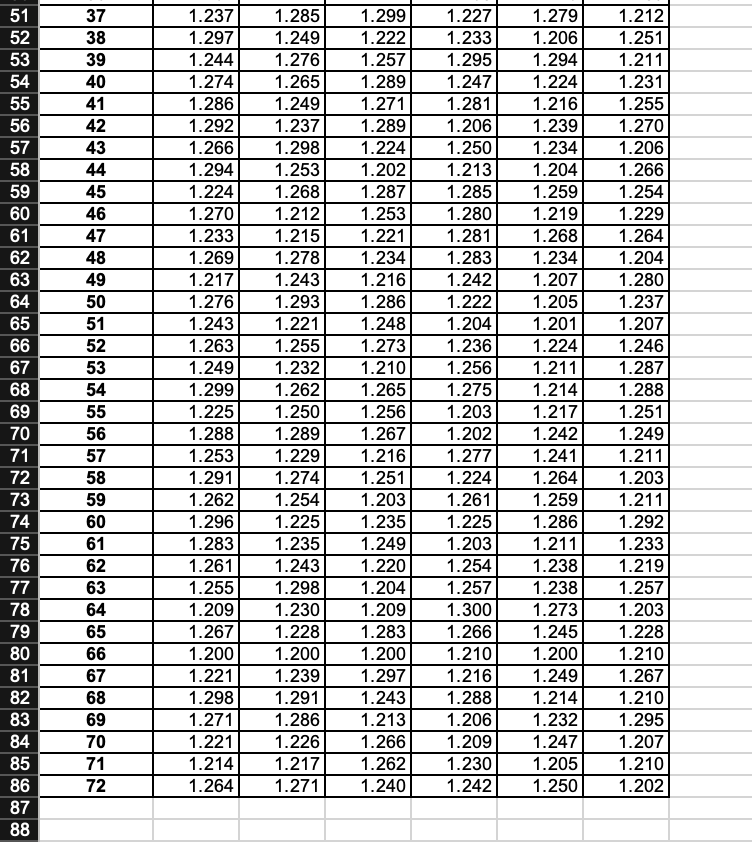
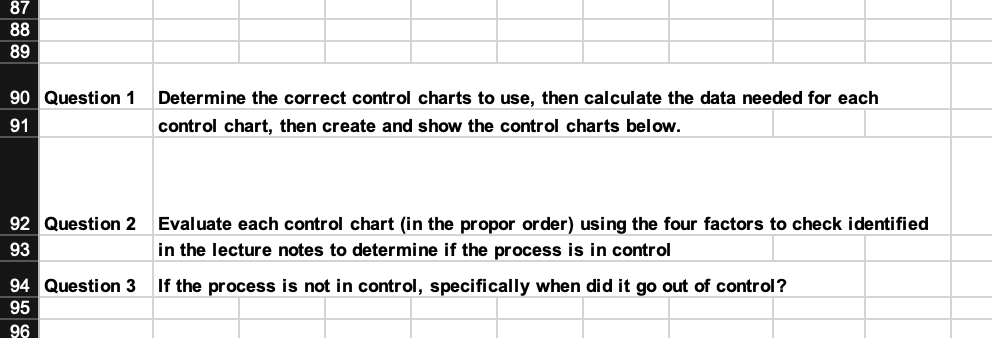
N B B C D D E F G H I J K M 1 Quality Control Assignment 2 3 You must do the necessary calculations in the answer cells. Simply providing a number in the answer cell will not receive any credit. 4 When look at the answer cell, I want to see a number, when I click on the cell I want to see the excel formula, for example, 5 if I asked you the sum of cells B5 through D5, this is what I want to see: 7035.0 or 7035.0 6 1234 2345 3456 7 Be sure to show all of your work. 8 9 Problem 1: Use the data that is given below to answer the question that follow. 10 An automated sampling and quality control system experienced a systems failure. You job is to evaluate the data collected over the past 6 hours to detemine if the process being measured was in control the entire time. Six measurements were taken in each sample, and seventy two samples total were gathered. The measurements are the diameter of a hold that drilled in a piece of aluminum 11 12 13 OBSERVATIONS WITHIN SAMPLES Xbar R 14 Sample 1 2 3 4 4 5 6 15 1 1.224 1.260 1.272 1.209 1.252 1.276 16 2 1.299 1.211 1.260 1.213 1.221 1.227 17 3 1.244 1.258 1.216 1.244 1.282 1.271 18 4 1.220 1.277 1.252 1.281 1.229 1.206 19 5 5 1.204 1.254 1.219 1.296 1.241 1.276 20 6 1.293 1.234 1.256 1.257 1.210 1.236 21 7 1.227 1.239 1.249 1.260 1.242 1.215 22 8 1.271 1.201 1.296 1.243 1.205 1.216 23 9 1.268 1.249 1.282 1.297 1.249 1.259 24 10 1.276 1.285 1.282 1.276 1.247 1.284 25 11 1.293 1.200 1.201 1.246 1.284 1.200 26 12 1.230 1.271 1.287 1.256 1.232 1.294 27 13 1.217 1.293 1.254 1.231 1.246 1.279 28 14 1.289 1.267 1.220 1.238 1.254 1.267 29 15 1.259 1.204 1.271 1.213 1.209 1.299 30 16 1.228 1.226 1.261 1.244 1.265 1.240 31 17 1.263 1.278 1.227 1.275 1.264 1.247 32 18 1.243 1.256 1.298 1.277 1.228 1.234 33 19 1.258 1.265 1.230 1.283 1.253 34 20 1.260 1.225 1.218 1.217 1.219 1.286 35 21 1.220 1.216 1.273 1.247 1.280 1.225 36 22 1.242 1.238 1.256 1.295 1.251 1.201 37 23 1.264 1.241 1.276 1.223 1.270 1.280 38 24 1.207 1.228 1.228 1.240 1.257 1.202 39 25 1.293 1.293 1.201 1.261 1.263 1.222 40 26 1.210 1.270 1.285 1.256 1.280 41 27 1.297 1.209 1.260 1.227 1.217 42 28 1.215 1.266 1.235 1.204 1.235 1.248 43 29 1.211 1.218 1.245 1.287 1.253 1.283 44 30 1.267 1.274 1.260 1.253 1.210 1.250 45 31 1.241 1.244 1.203 1.244 1.298 1.226 46 32 1.278 1.270 1.234 1.246 1.215 1.215 47 33 1.278 1.259 1.233 1.290 1.232 1.285 48 34 1.292 1.201 1.292 1.285 1.250 1.221 49 35 1.229 1.238 1.298 1.300 1.248 1.261 50 36 1.262 1.274 1.277 1.203 1.220 1.289 1.291 1.283 1.2151 51 52 53 54 55 56 57 58 59 60 61 62 63 64 65 66 67 68 69 70 71 72 73 74 75 76 77 78 79 80 81 82 83 84 85 86 87 88 37 38 39 40 41 42 43 44 45 46 47 48 49 50 51 52 53 54 55 56 57 58 59 60 61 62 63 64 65 66 67 68 69 70 71 72 1.237 1.297 1.244 1.274 1.286 1.292 1.266 1.294 1.224 1.270 1.233 1.269 1.217 1.276 1.243 1.263 1.249 1.299 1.225 1.288 1.253 1.291 1.262 1.296 1.283 1.261 1.255 1.209 1.267 1.200 1.221 1.298 1.271 1.221 1.214 1.264 1.285 1.249 1.276 1.265 1.249 1.237 1.298 1.253 1.268 1.212 1.215 1.278 1.243 1.293 1.221 1.255 1.232 1.262 1.250 1.289 1.229 1.274 1.254 1.225 1.235 1.243 1.298 1.230 1.228 1.200 1.239 1.291 1.286 1.226 1.217 1.271 1.299 1.222 1.257 1.289 1.271 1.289 1.224 1.202 1.287 1.253 1.221 1.234 1.216 1.286 1.248 1.273 1.210 1.265 1.256 1.267 1.216 1.251 1.203 1.235 1.249 1.220 1.204 1.209 1.283 1.200 1.297 1.243 1.213 1.266 1.262 1.240 1.227 1.233 1.295 1.247 1.281 1.206 1.250 1.213 1.285 1.280 1.281 1.283 1.242 1.222 1.204 1.236 1.256 1.275 1.203 1.202 1.277 1.224 1.261 1.225 1.203 1.254 1.257 1.300 1.266 1.210 1.216 1.288 1.206 1.209 1.230 1.242 1.279 1.206 1.294 1.224 1.216 1.239 1.234 1.204 1.259 1.219 1.268 1.234 1.207 1.205 1.201 1.224 1.211 1.214 1.217 1.242 1.241 1.264 1.259 1.286 1.211 1.238 1.238 1.273 1.245 1.200 1.249 1.214 1.232 1.247 1.205 1.250 1.212 1.251 1.211 1.231 1.255 1.270 1.206 1.266 1.254 1.229 1.264 1.204 1.280 1.237 1.207 1.246 1.287 1.288 1.251 1.249 1.211 1.203 1.211 1.292 1.233 1.219 1.257 1.203 1.228 1.210 1.267 1.210 1.295 1.207 1.210 1.202 87 88 89 90 Question 1 91 Determine the correct control charts to use, then calculate the data needed for each control chart, then create and show the control charts below. 92 Question 2 93 Evaluate each control chart (in the propor order) using the four factors to check identified in the lecture notes to determine if the process is in control If the process is not in control, specifically when did it go out of control? 94 Question 3 95 96