Answered step by step
Verified Expert Solution
Question
1 Approved Answer
I did 1 and 2 questions. So how to solve 3rd question? 3)Output a stripchart of data 2. Then have a look at the contents


I did 1 and 2 questions. So how to solve 3rd question?
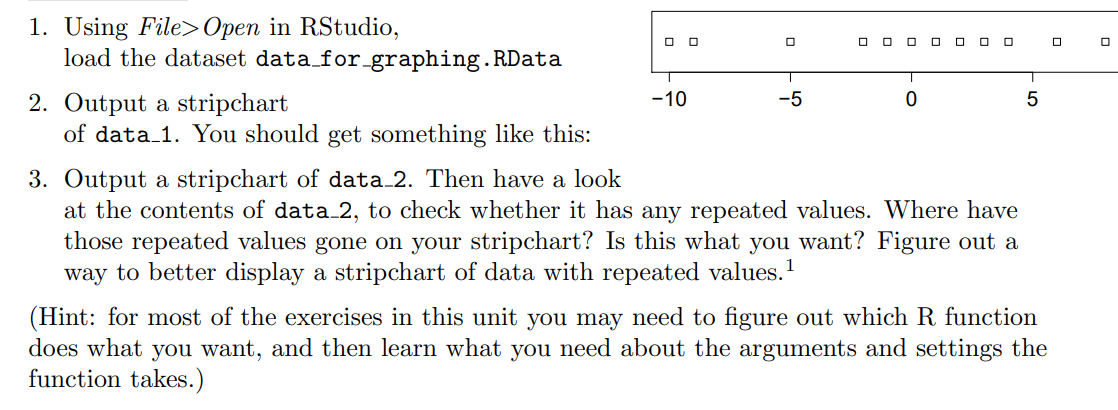
3)Output a stripchart of data 2. Then have a look at the contents of data 2, to check whether it has any repeated values. Where have those repeated values gone on your stripchart? Is this what you want? Figure out a way to better display a stripchart of data with repeated values.1
1. Using File>Open in RStudio, Oo OOOOOOOO 0 load the dataset data for graphing. RData 2. Output a stripchart -10 of data 1. You should get something like this: 3. Output a stripchart of data 2. Then have a look at the contents of data 2, to check whether it has any repeated values. Where have those repeated values gone on your stripchart? Is this what you want? Figure out a way to better display a stripchart of data with repeated values. 1 (Hint: for most of the exercises in this unit you may need to figure out which R function does what you want, and then learn what you need about the arguments and settings the function takes.) values data_1 data_2 data_3 data_4 data_5 num (1:12] -10 2 0 1 -1 3-2 -9 6 4 ... num (1:25] -10 2 0 1 -1 3 -2 -20 -2 -9... num (1:1000] -12.65 -2.47 -6.44 14.06 6.12 ... int (1:1000] 0 0 3 2 3 1 0 1 4 3 ... num (1:20] 25 46 73 61 10 18 1 20 85 8Step by Step Solution
There are 3 Steps involved in it
Step: 1

Get Instant Access to Expert-Tailored Solutions
See step-by-step solutions with expert insights and AI powered tools for academic success
Step: 2

Step: 3

Ace Your Homework with AI
Get the answers you need in no time with our AI-driven, step-by-step assistance
Get Started


