Answered step by step
Verified Expert Solution
Link Copied!

Question

1 Approved Answer

I did a similar problem and thought problem A was 20.82 (since i messed with the Sales ($/unit) value and got it to say $0

I did a similar problem and thought problem A was 20.82 (since i messed with the Sales ($/unit) value and got it to say $0 for NPV but it said it was 19.34%. So I have to do the below problem now since I got it wrong the first time. I dont have "solver" i created the table from my notes w/ formulas. Please help. TY.

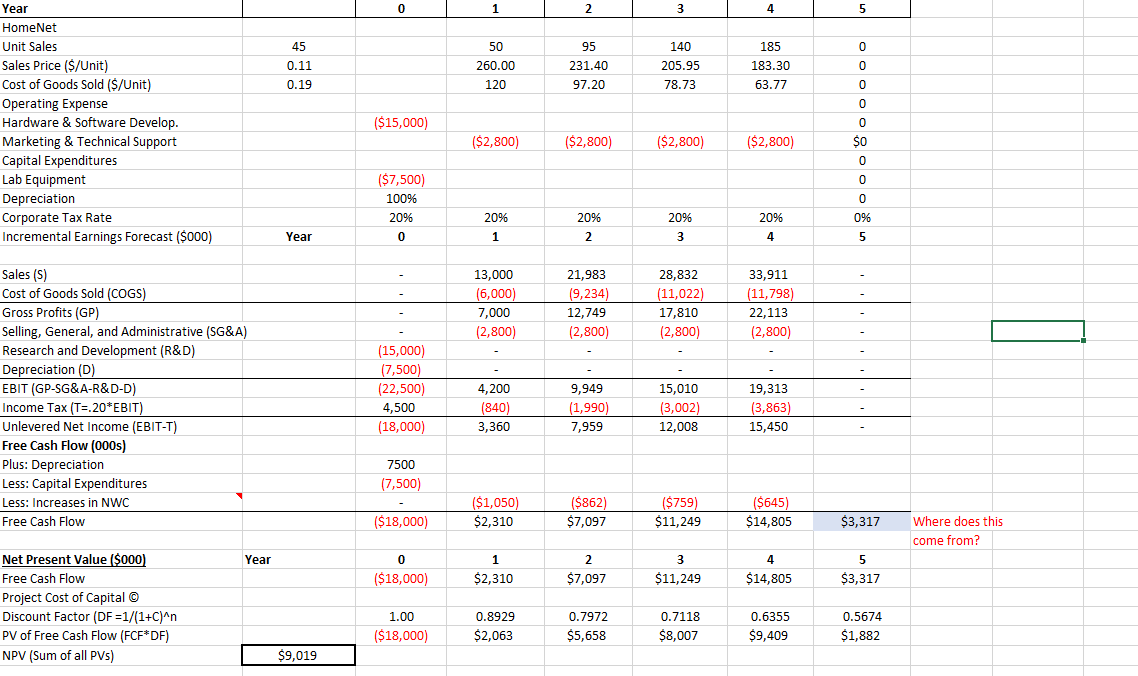
You are evaluating the HomeNet project under the following assumptions: new tax laws allow 100% bonus depreciation (all the depreciation expense, $7.5 million, occurs when the asset is put into use, in this case immediately). Research and development expenditures total $15 million in year 0 and selling, general, and administrative expenses are $2.8 million per year (assuming there is no cannibalization). Also assume HomeNet will have no incremental cash or inventory requirements (products will be shipped directly from the contract manufacturer to customers). However, receivables related to HomeNet are expected to account for 15% of annual sales, and payables are expected to be 15% of the annual cost of goods sold. Under these assumptions and assuming a cost of capital of 12%, calculate:

a. The break-even annual sales price decline if: sales of 50,000

units in year 1 increase by 50,000 units per year over the life of the project, the year 1 sales price is $260/unit, and the year 1 cost of $120/unit decreases by 22% annually.

b. The break-even annual unit sales increase if: sales are 50,000 units in year 1, the year 1 sales price of $260/unit, decreases by 11% annually and the year 1 cost of $120/unit decreases by 22% annually.

image text in transcribed

0 1 2 3 4 5 45 50 260.00 120 0.11 95 231.40 97.20 140 205.95 78.73 185 183.30 63.77 0 0 0.19 0 0 Year HomeNet Unit Sales Sales Price ($/Unit) Cost of Goods Sold ($/Unit) Operating Expense Hardware & Software Develop. Marketing & Technical Support Capital Expenditures Lab Equipment Depreciation Corporate Tax Rate Incremental Earnings Forecast ($000) ($15,000) ($2,800) ($2,800) ($2,800) ($2,800) ($7,500) 100% 20% 0 0 SO 0 0 0 0% 5 20% 1 20% 2 20% 3 20% 4 Year 13,000 (6,000) 7,000 (2,800) 21,983 (9,234) 12,749 (2,800) 28,832 (11,022) 17,810 (2,800) 33,911 (11,798) 22,113 (2,800) Sales (5) Cost of Goods Sold (COGS) Gross Profits (GP) Selling, General, and Administrative (SG&A) Research and Development (R&D) Depreciation (D) EBIT (GP-SG&A-R&D-D) Income Tax (T=.20*EBIT) Unlevered Net Income (EBIT-T) Free Cash Flow (000s) Plus: Depreciation Less: Capital Expenditures Less: Increases in NWC Free Cash Flow (15,000) (7,500) (22,500) 4,500 (18,000) 4,200 (840) 3,360 9,949 (1,990) 7,959 15,010 (3,002) 12,008 19,313 (3,863) 15,450 7500 (7,500) ($1,050) $2,310 ($862) $7,097 ($759) $11,249 ($645) $14,805 ($18,000) $3,317 Where does this come from? Year 5 0 ($18,000) 1 $2,310 2. $7,097 3 $11,249 4 $14,805 $3,317 Net Present Value ($000) Free Cash Flow Project Cost of Capital Discount Factor (DF =1/(1+C)^n PV of Free Cash Flow (FCF*DF) NPV (Sum of all PVs) 1.00 ($18,000) 0.8929 $2,063 0.7972 $5,658 0.7118 $8,007 0.6355 $9,409 0.5674 $1,882 $9,019 0 1 2 3 4 5 45 50 260.00 120 0.11 95 231.40 97.20 140 205.95 78.73 185 183.30 63.77 0 0 0.19 0 0 Year HomeNet Unit Sales Sales Price ($/Unit) Cost of Goods Sold ($/Unit) Operating Expense Hardware & Software Develop. Marketing & Technical Support Capital Expenditures Lab Equipment Depreciation Corporate Tax Rate Incremental Earnings Forecast ($000) ($15,000) ($2,800) ($2,800) ($2,800) ($2,800) ($7,500) 100% 20% 0 0 SO 0 0 0 0% 5 20% 1 20% 2 20% 3 20% 4 Year 13,000 (6,000) 7,000 (2,800) 21,983 (9,234) 12,749 (2,800) 28,832 (11,022) 17,810 (2,800) 33,911 (11,798) 22,113 (2,800) Sales (5) Cost of Goods Sold (COGS) Gross Profits (GP) Selling, General, and Administrative (SG&A) Research and Development (R&D) Depreciation (D) EBIT (GP-SG&A-R&D-D) Income Tax (T=.20*EBIT) Unlevered Net Income (EBIT-T) Free Cash Flow (000s) Plus: Depreciation Less: Capital Expenditures Less: Increases in NWC Free Cash Flow (15,000) (7,500) (22,500) 4,500 (18,000) 4,200 (840) 3,360 9,949 (1,990) 7,959 15,010 (3,002) 12,008 19,313 (3,863) 15,450 7500 (7,500) ($1,050) $2,310 ($862) $7,097 ($759) $11,249 ($645) $14,805 ($18,000) $3,317 Where does this come from? Year 5 0 ($18,000) 1 $2,310 2. $7,097 3 $11,249 4 $14,805 $3,317 Net Present Value ($000) Free Cash Flow Project Cost of Capital Discount Factor (DF =1/(1+C)^n PV of Free Cash Flow (FCF*DF) NPV (Sum of all PVs) 1.00 ($18,000) 0.8929 $2,063 0.7972 $5,658 0.7118 $8,007 0.6355 $9,409 0.5674 $1,882 $9,019

Step by Step Solution

There are 3 Steps involved in it

Step: 1

blur-text-image

Get Instant Access to Expert-Tailored Solutions

See step-by-step solutions with expert insights and AI powered tools for academic success

Step: 2

blur-text-image

Step: 3

blur-text-image

Ace Your Homework with AI

Get the answers you need in no time with our AI-driven, step-by-step assistance

Get Started

Recommended Textbook for

Audit And Management Of The Company

Authors: Trésor Ilunga KAMPELA, Bernard KAYIMBW MANETA

1st Edition

ISBN: 6205405253, 978-6205405253

More Books

Students also viewed these Accounting questions