i did my homework and need help if i did it correctly or not
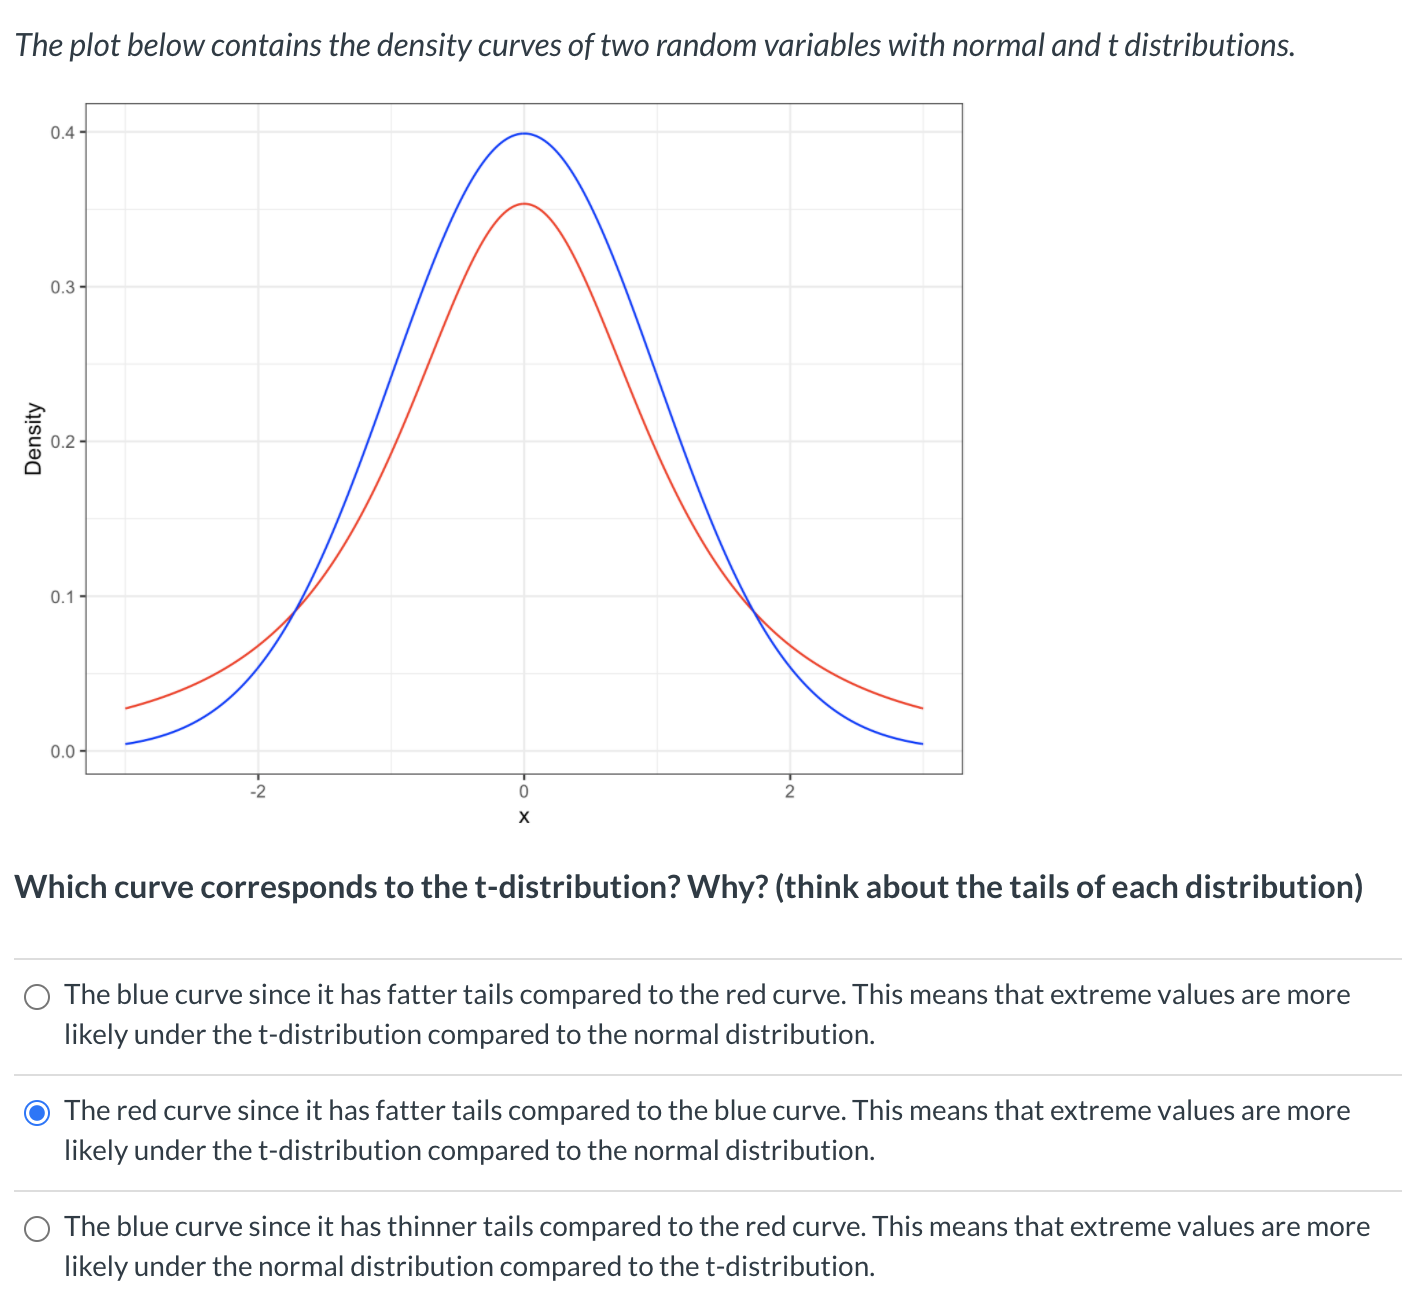
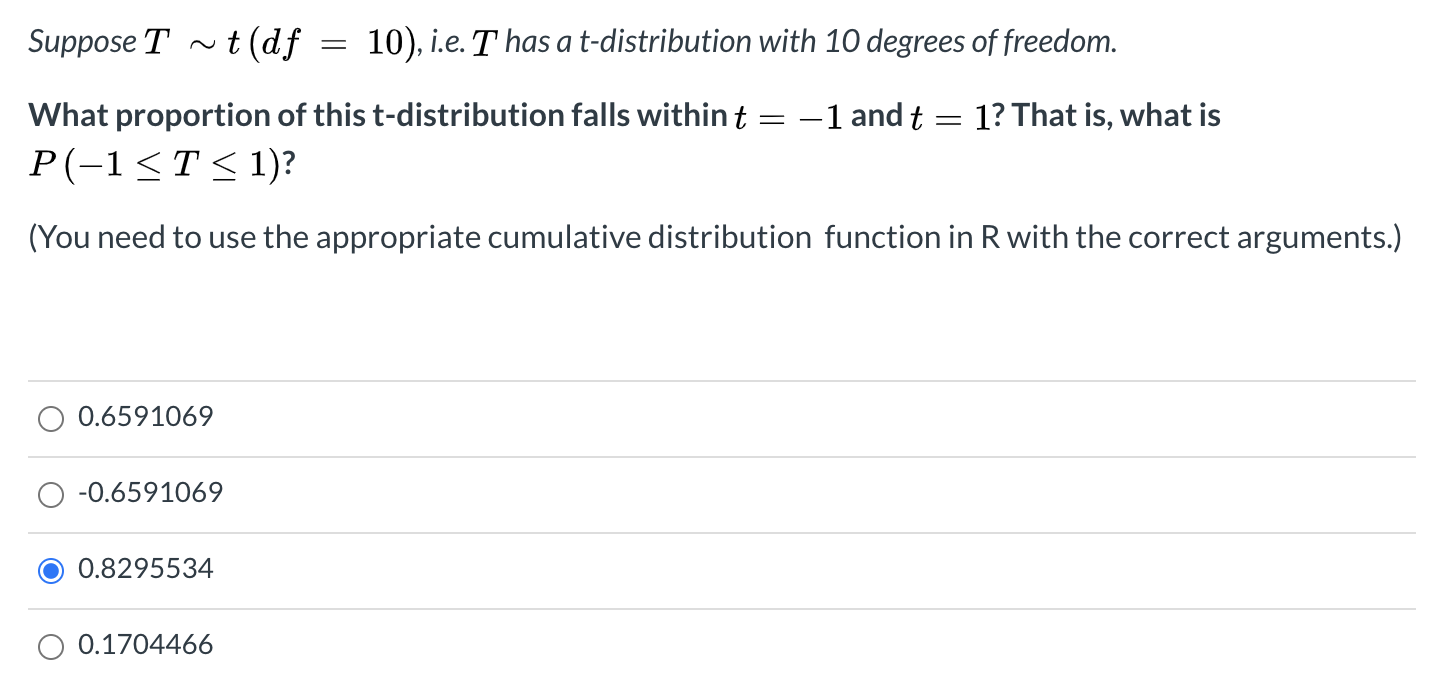
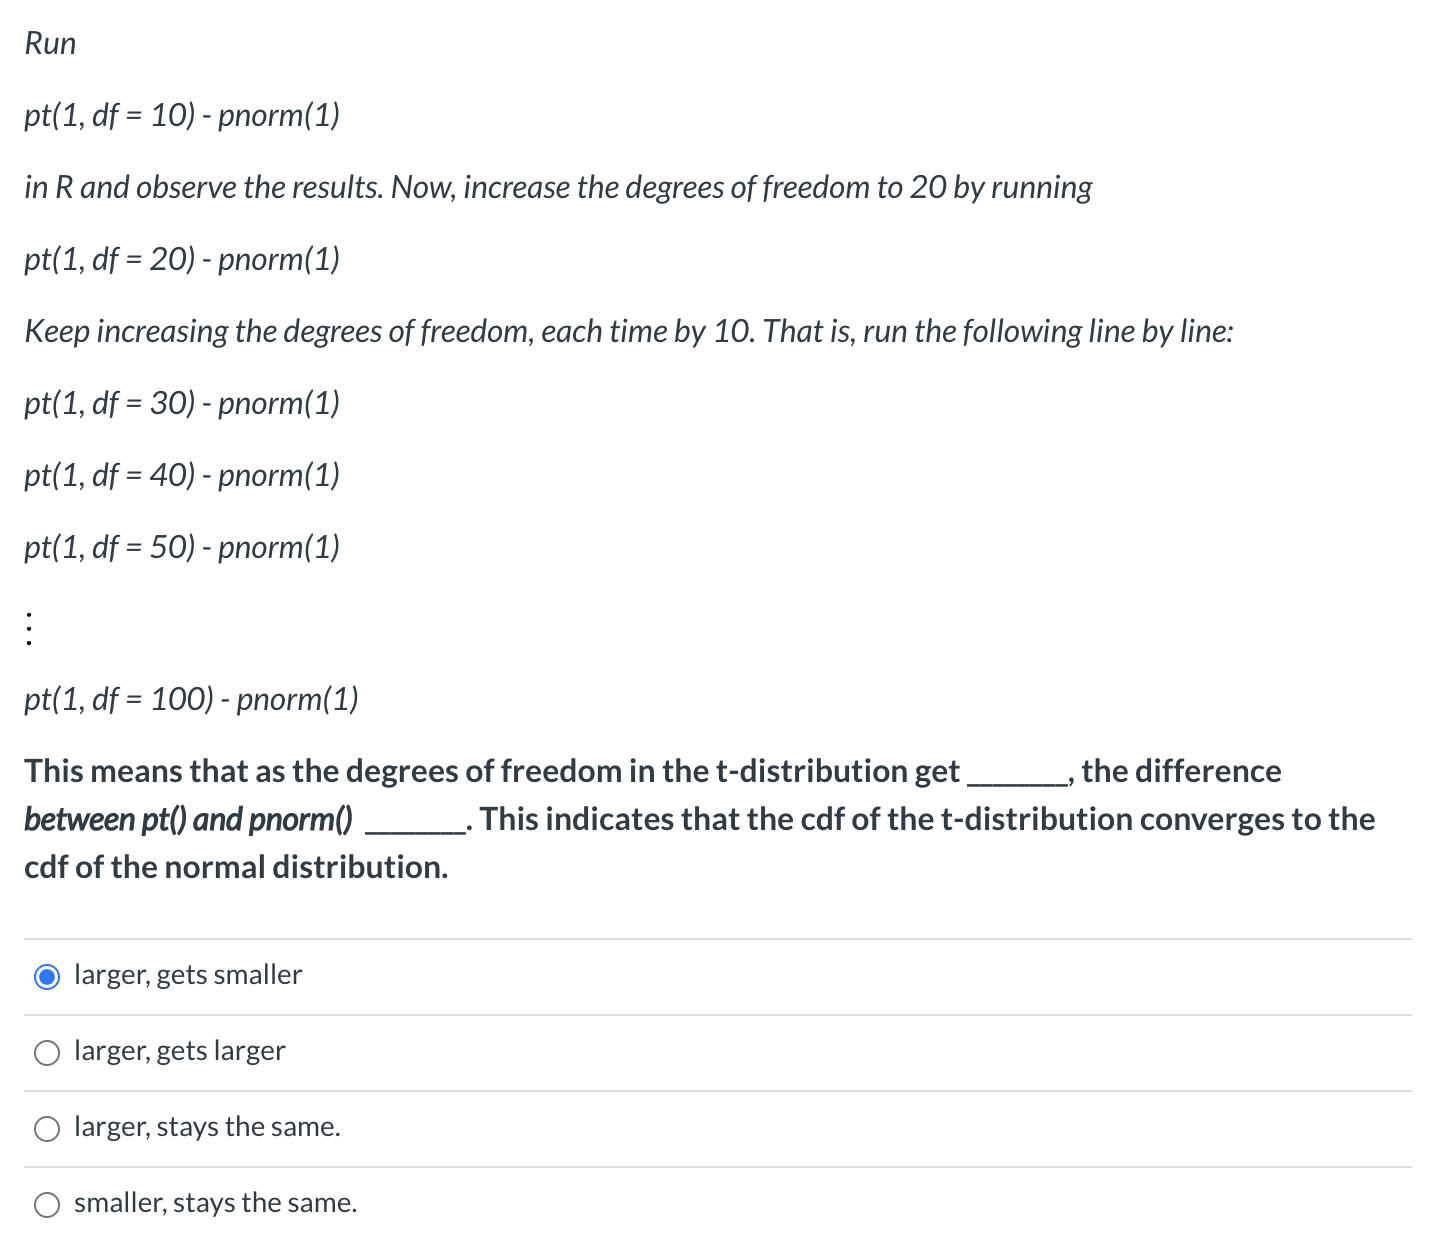
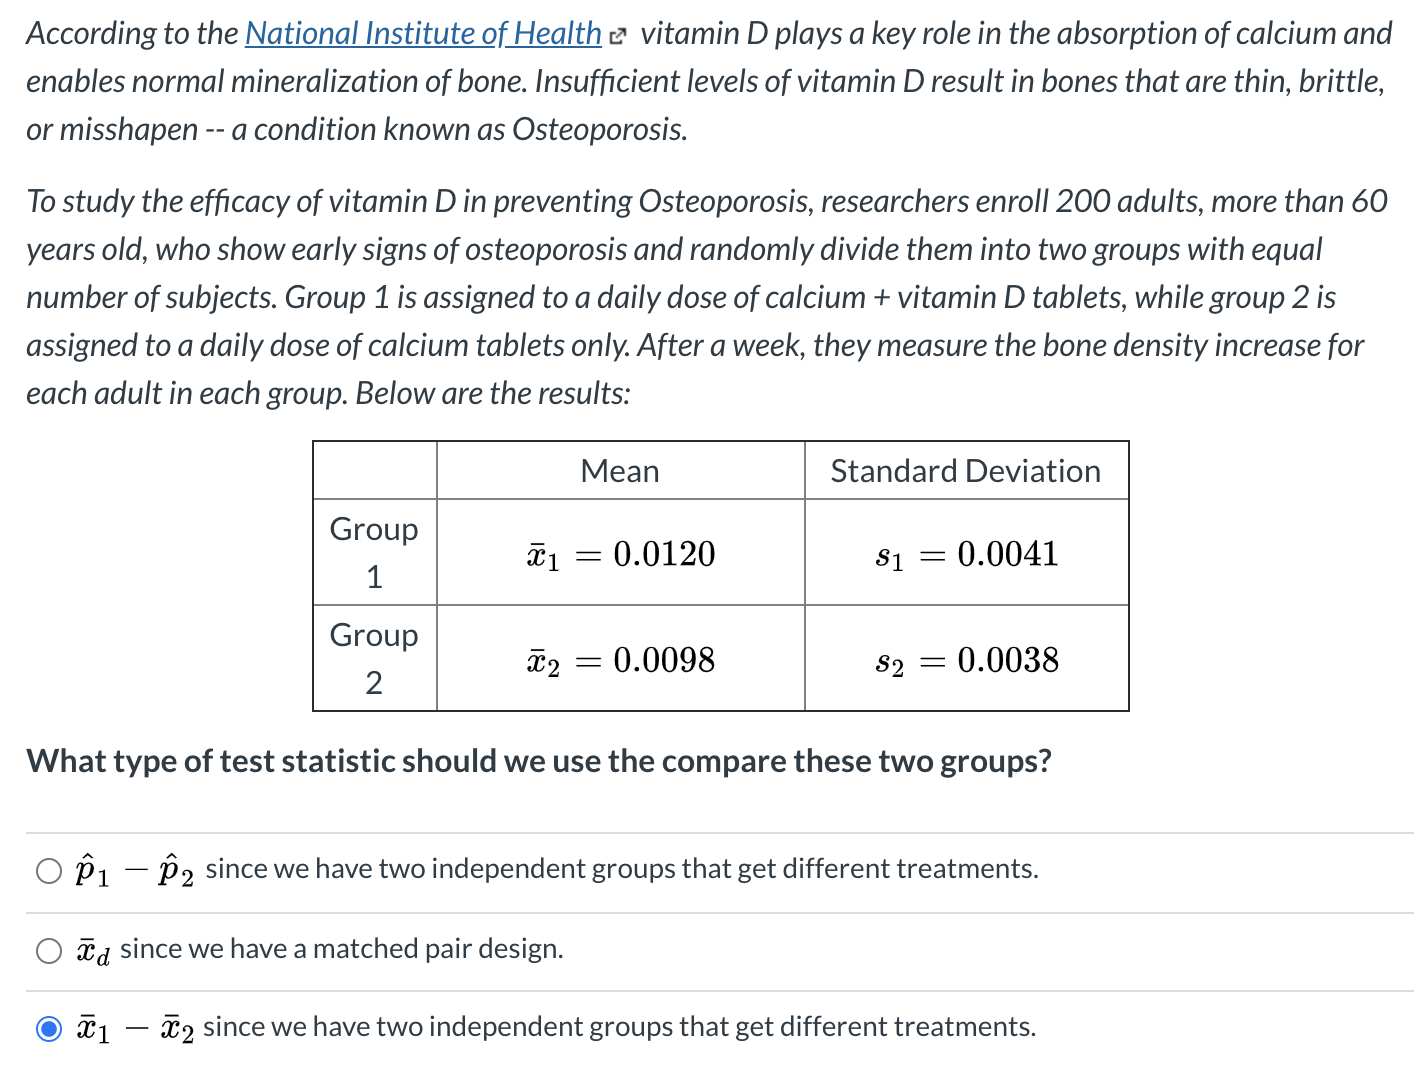
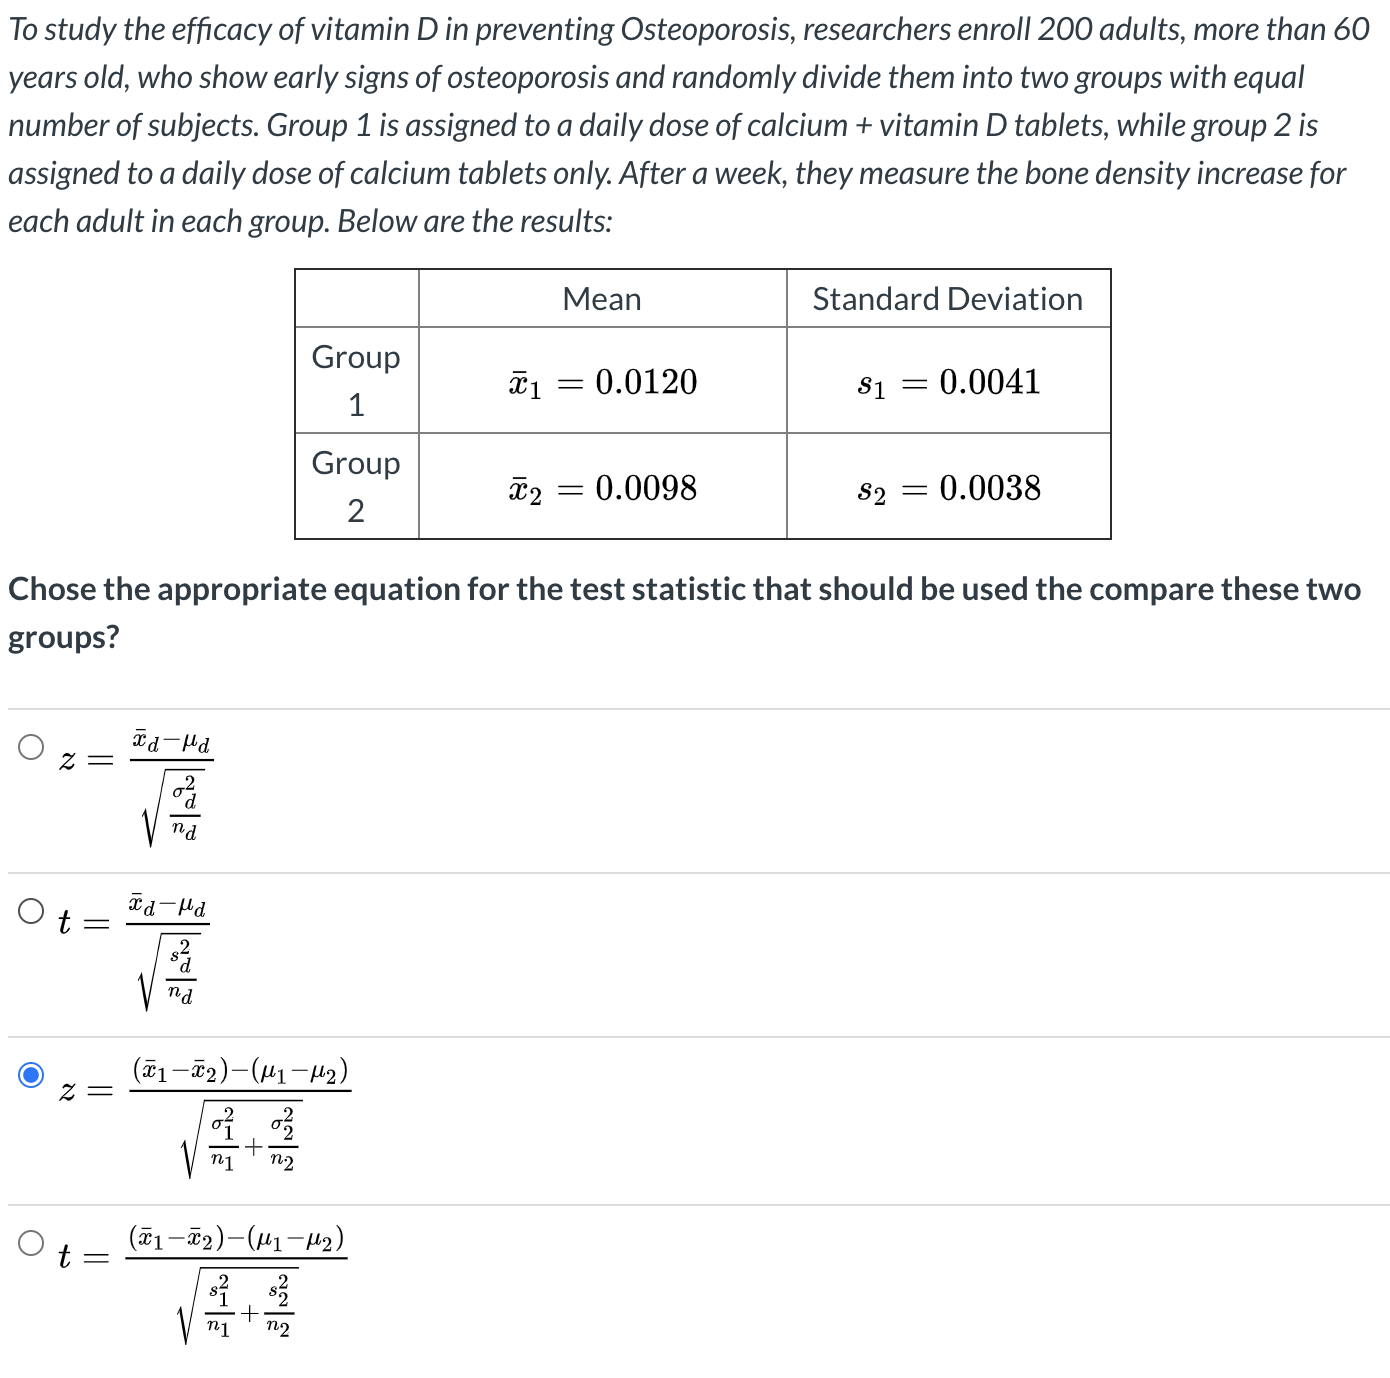
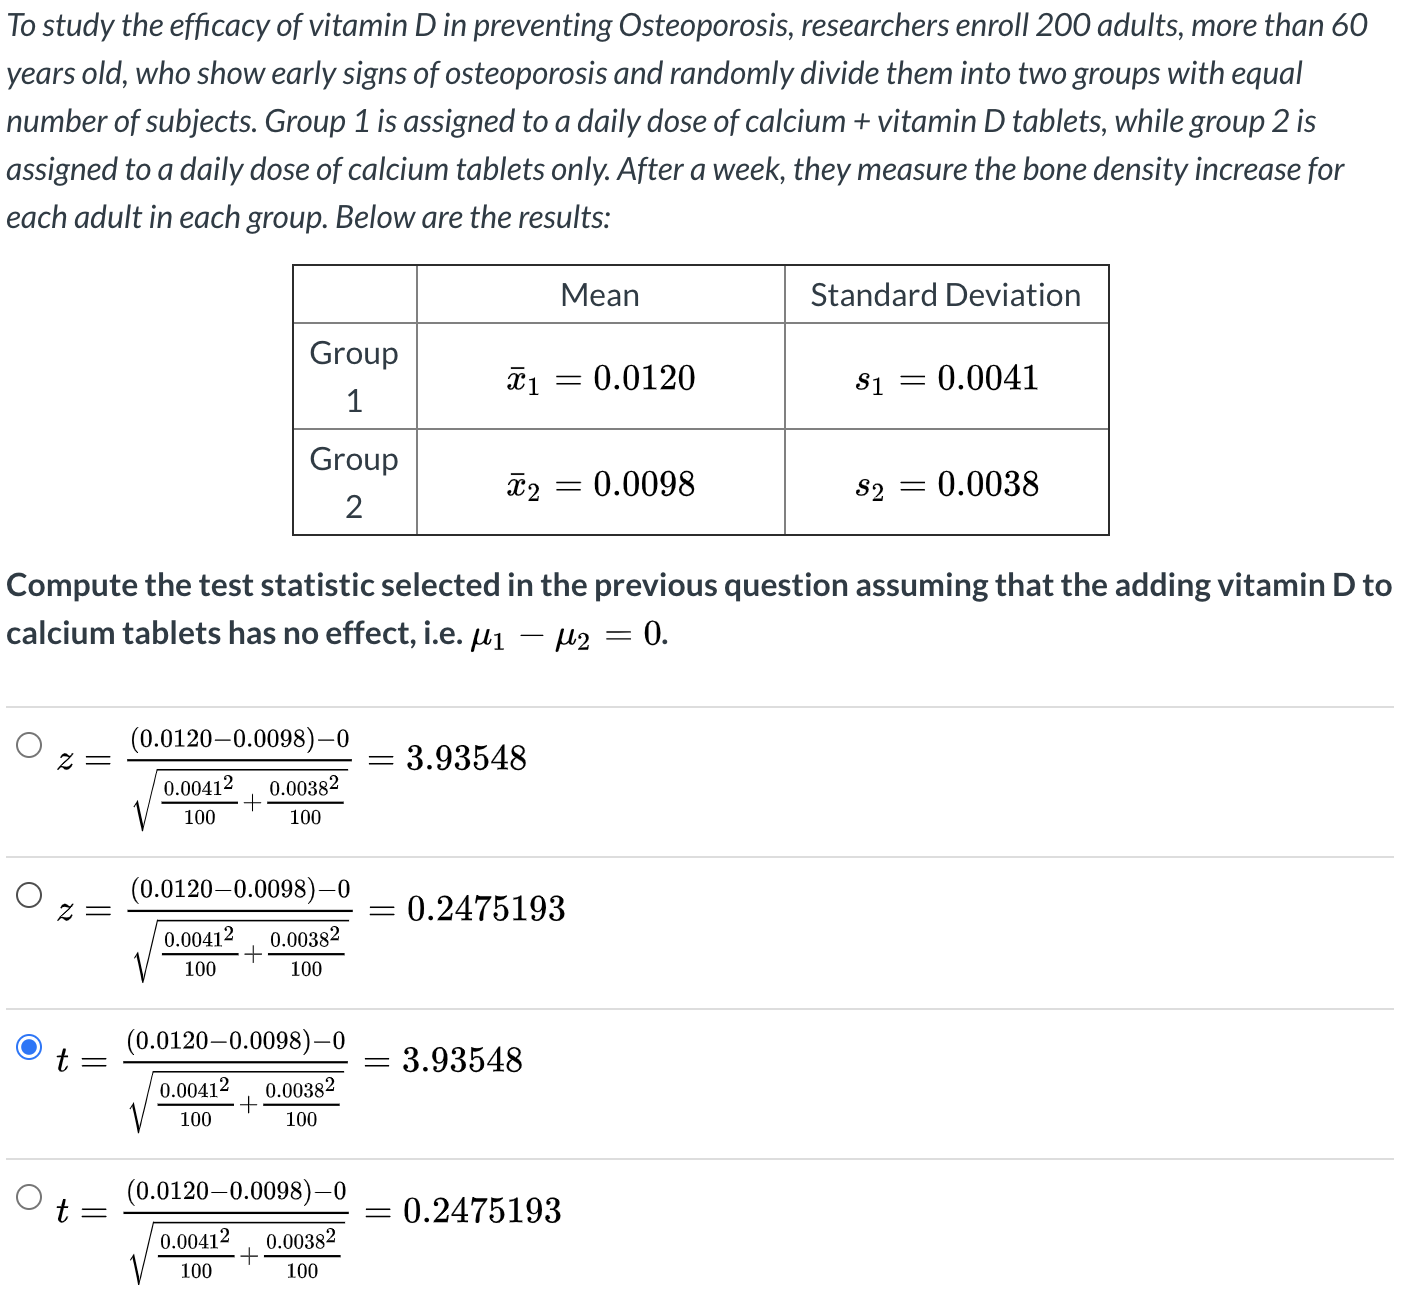
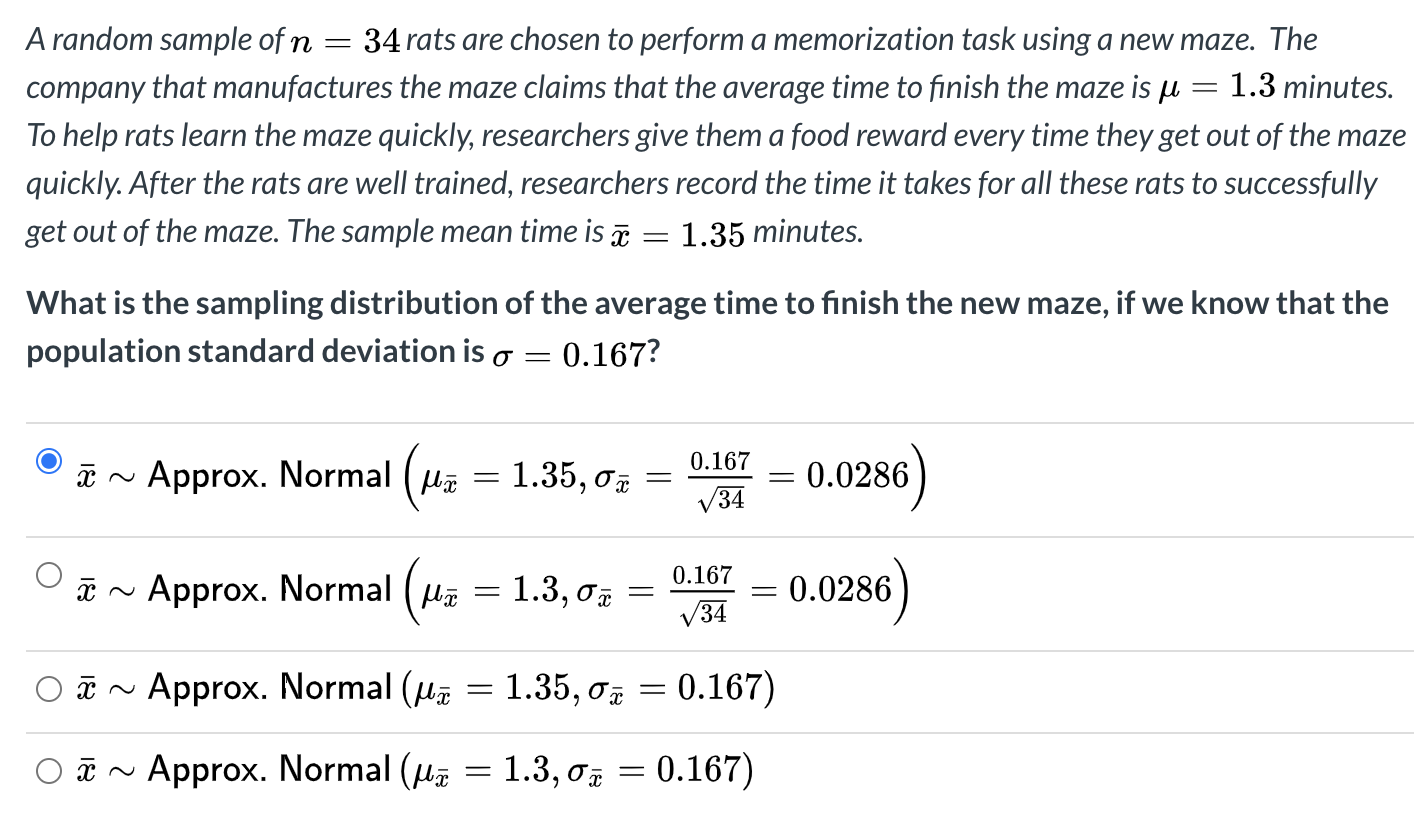
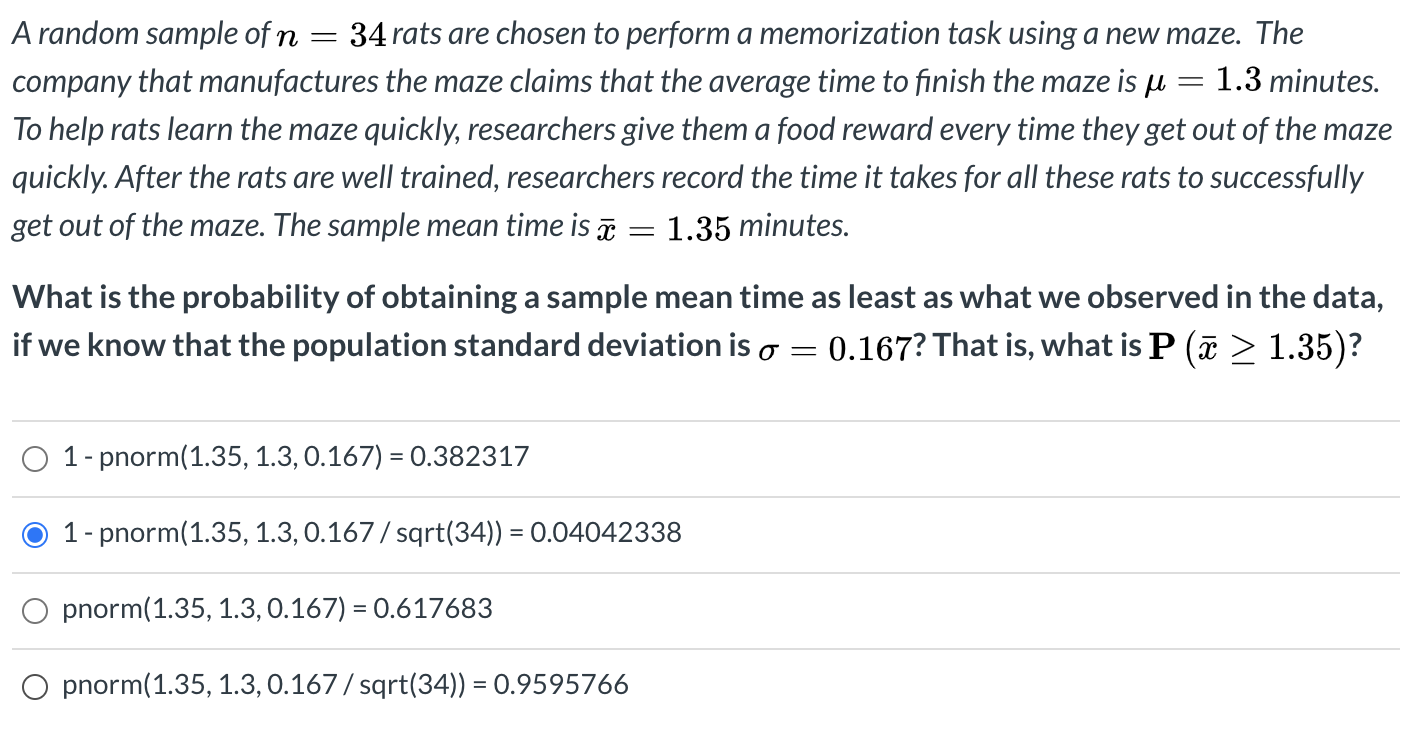
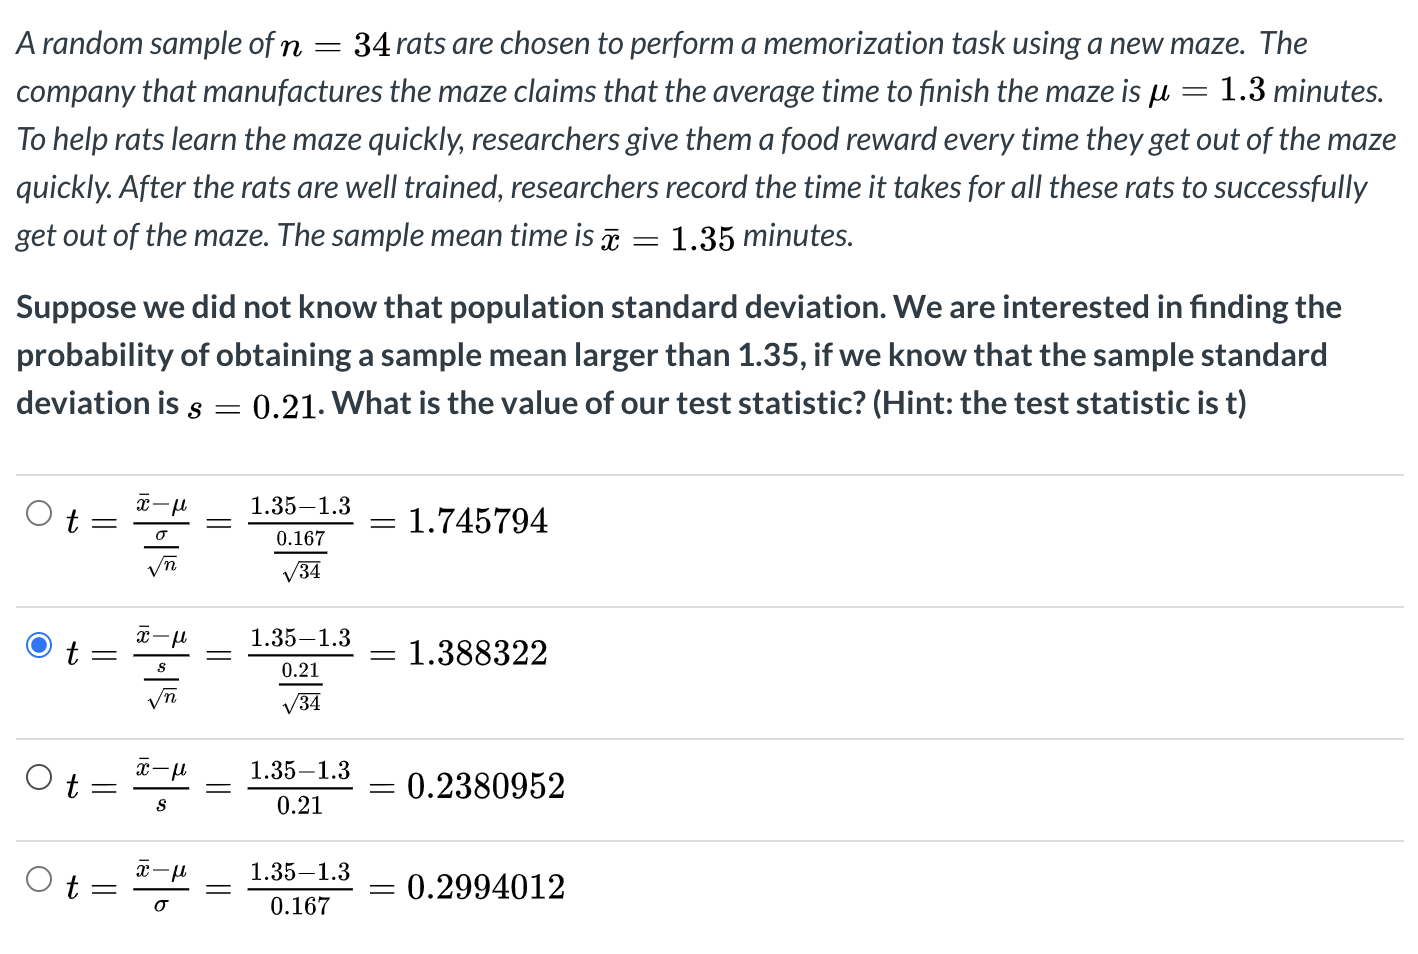
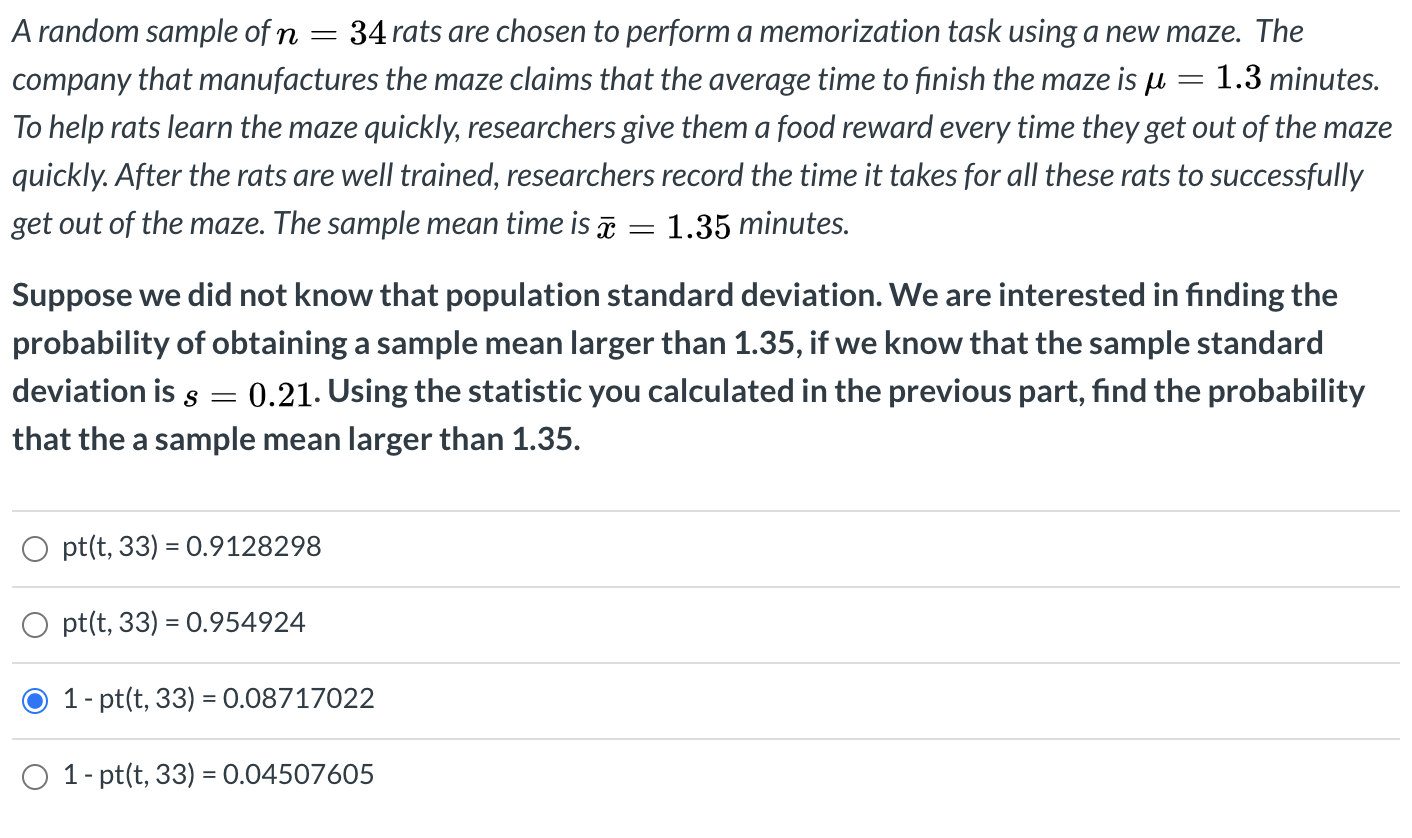
The plot below contains the density curves of two random variables with normal and t distributions. 0.4 0.3 Density O M 0.1 0.0 Which curve corresponds to the t-distribution? Why? (think about the tails of each distribution) 0 The blue curve since it has fatter tails compared to the red curve. This means that extreme values are more likely under the t-distribution compared to the normal distribution. The red curve since it has fatter tails compared to the blue curve. This means that extreme values are more likely under the t-distribution compared to the normal distribution. 0 The blue curve since it has thinner tails compared to the red curve. This means that extreme values are more likely under the normal distribution compared to the t-distribution. Suppose T N t (d f = 10), i.e. T has a t-distribution with 10 degrees of freedom. What proportion of this t-distribution falls within it = 1 and t = 1? That is, what is P (1 S T g 1)? (You need to use the appropriate cumulative distribution function in R with the correct arguments.) 0 06591069 0 -0.6591069 0.8295534 0 0.1704466 Run pt(1, df = 10) - pnorm(1) in R and observe the results. Now, increase the degrees of freedom to 20 by running pt(1, df = 20) - pnorm(1) Keep increasing the degrees of freedom, each time by 10. That is, run the following line by line: pt(1, df = 30) - pnorm(1) pt(1, df = 40) - pnorm(1) pt(1, df = 50) - pnorm(1) . . . pt(1, df = 100) - pnorm(1) This means that as the degrees of freedom in the t-distribution get_ the difference between pt() and pnorm() . This indicates that the cdf of the t-distribution converges to the cdf of the normal distribution. O larger, gets smaller O larger, gets larger O larger, stays the same. O smaller, stays the same.According to the National Institute of Health a vitamin D plays a key role in the absorption of calcium and enables normal mineralization of bone. lnsufcient levels of vitamin D result in bones that are thin, brittle, or misshapen -- a condition known as Osteoporosis. To study the efcacy of vitamin D in preventing Osteoporosis, researchers enroll 200 adults, more than 60 years old, who show early signs of osteoporosis and randomly divide them into two groups with equal number of subjects. Group 1 is assigned to a daily dose of calcium + vitamin D tablets, while group 2 is assigned to a daily dose of calcium tablets only. After a week, they measure the bone density increase for each adult in each group. Below are the results: G G 52 = 0.0098 32 = 00038 What type of test statistic should we use the compare these two groups? C) 351 132 since we have two independent groups that get different treatments. 0 5d since we have a matched pair design. 531 5:2 since we have two independent groups that get different treatments. To study the efcacy of vitamin D in preventing Osteoporosis, researchers enroll 200 adults, more than 60 years old, who show early signs of osteoporosis and randomly divide them into two groups with equal number of subjects. Group 1 is assigned to a daily dose of calcium + vitamin D tablets, while group 2 is assigned to a daily dose of calcium tablets only. After a week, they measure the bone density increase for each adult in each group. Below are the results: G G Chose the appropriate equation for the test statistic that should be used the compare these two groups? O t _ was-m 2. 3d a 2 (15151'2)_(P'1_M2) 0% 6% EJ'E O t = (51532)(M1M2) 821' 3% Il To study the efcacy of vitamin D in preventing Osteoporosis, researchers enroll 200 adults, more than 60 years old, who show early signs of osteoporosis and randomly divide them into two groups with equal number of subjects. Group 1 is assigned to a daily dose of calcium + vitamin D tablets, while group 2 is assigned to a daily dose of calcium tablets only. After a week, they measure the bone density increase for each adult in each group. Below are the results: G G 2 = 0.0098 32 = 0.0038 Compute the test statistic selected in the previous question assuming that the adding vitamin D to calcium tablets has no effect, i.e. pl pg 2 0. O z = W = 393543 0.00412 0.00382 100 + 100 O z = W = 0.2475193 0.00412 0.00382 100 + 100 t : W = 3.93548 0.00412 0.00382 100 + 100 O t : W = 0.2475193 0.00412 0.00382 100 + 100 A random sample of n = 34 rats are chosen to perform a memorization task using a new maze. The company that manufactures the maze claims that the average time to nish the maze is p. = 1.3 minutes. To help rats learn the maze quickly, researchers give them a food reward every time they get out of the maze quickly. After the rats are well trained, researchers record the time it takes for all these rats to successfully get out of the maze. The sample mean time is j = 1.35 minutes. What is the sampling distribution of the average time to nish the new maze, if we know that the population standard deviation is o' = 0167? 51? ~ Approx. Normal p5; = 1.35.05 = M = 0.0286) 0 :2 ~ Approx. Normal (p.55 2 1.3.05 2 M = 0.0286) 0 it ~ Approx. Normal (Mg = 135,031-7 : 0.167) ( O f N Approx. Normal [1.5 = 1.3, 0'5 = 0.167) A random sample of n : 34 rats are chosen to perform a memorization task using a new maze. The company that manufactures the maze claims that the average time to nish the maze is p, = 1.3 minutes. To help rats learn the maze quickly; researchers give them a food reward every time they get out of the maze quickly. After the rats are well trained, researchers record the time it takes for all these rats to successfully get out of the maze. The sample mean time is f = 1 _35 minutes. What is the probability of obtaining a sample mean time as least as what we observed in the data, if we know that the population standard deviation is a' : 0,167? That is, what is P (5: 2 1.35)? O 1 - pnorml1.35, 1.3, 0.167) = 0.382317 1 - pnorm(1.35, 1.3, 0.167/sqrt(34)) = 0.04042338 0 pnorm(1.35, 1.3, 0.167) = 0.617683 0 pnorm(1.35, 1.3, 0.167/ sqrt(34)} = 0.9595766 A random sample of n : 34 rats are chosen to perform a memorization task using a new maze. The company that manufactures the maze claims that the average time to nish the maze is p, = 1.3 minutes. To help rats learn the maze quickly, researchers give them a food reward every time they get out of the maze quickly. After the rats are well trained, researchers record the time it takes for all these rats to successfully get out of the maze. The sample mean time is :E = 1.35 minutes. Suppose we did not know that population standard deviation. We are interested in nding the probability of obtaining a sample mean larger than 1.35, if we know that the sample standard deviation is 3 = 0.21. What is the value of our test statistic? (Hint: the test statistic is t) O t = 5"\" 1-3513 = 1.745794 L m a 31 t = E: = 133211-3 = 1.388322 W E :E# 1.351.3 0t: s 021 =0.2380952 _ 59 13513 _ O t _ a 0.167 _ 0.2994012 A random sample of n = 34 rats are chosen to perform a memorization task using a new maze. The company that manufactures the maze claims that the average time to finish the maze is u = 1.3 minutes. To help rats learn the maze quickly, researchers give them a food reward every time they get out of the maze quickly. After the rats are well trained, researchers record the time it takes for all these rats to successfully get out of the maze. The sample mean time is x = 1.35 minutes. Suppose we did not know that population standard deviation. We are interested in finding the probability of obtaining a sample mean larger than 1.35, if we know that the sample standard deviation is s = 0.21. Using the statistic you calculated in the previous part, find the probability that the a sample mean larger than 1.35. O pt(t, 33) = 0.9128298 O pt(t, 33) = 0.954924 1 - pt(t, 33) = 0.08717022 O 1 - pt(t, 33) = 0.04507605
