

Question
I did number 1 and 2 but I got confused how to do 3,4 and 5 Please don't use panda and I am in the
I did number 1 and 2 but I got confused how to do 3,4 and 5
Please don't use panda and I am in the basic course so I can't do fancy coding
Code that I wrote for problem 1 & 2:
COMPANY = "p6_stock_company.txt" HIGH = "p6_stock_high.txt" LOW = "p6_stock_low.txt" SECTORS = "p6_stock_sector.txt" VALUES = "p6_stock_values.txt"
# Create read_data function def read_data(file_name, int_conversion): data_list_raw = [] data_list = [] with open(file_name, "r")as infile: while True: data = infile.readline() if data == "": break if int_conversion == True: data_list_raw = data_list.append(data) data_list = [float(num) for num in data_list] else: data_list_raw = data_list.append(data.strip()) data_list_raw = data_list return data_list
# Create classify_stock function def classify_stock(stock_val_recent, stock_val_high, stock_val_low): if len(stock_val_recent) != len(stock_val_high) \ or len(stock_val_recent) != len(stock_val_low): return []
result = [] for i in range(len(stock_val_recent)): diff_low = stock_val_recent[i] - stock_val_low[i] diff_high = stock_val_high[i] - stock_val_recent[i]
if diff_high diff_low: result.append("Low") else: result.append("Steady")
return result def main(): # Call the read data function stock_company_list = read_data(COMPANY, False) high_list = read_data(HIGH, True) low_list = read_data(LOW, True) sector_list = read_data(SECTORS, False) value_list = read_data(VALUES, True) # Call the classify_stock function stock_direction = classify_stock(value_list, high_list, low_list) for i in range(len(stock_company_list)): print(stock_company_list[i], sector_list[i], stock_direction[i]) main()
Thank you
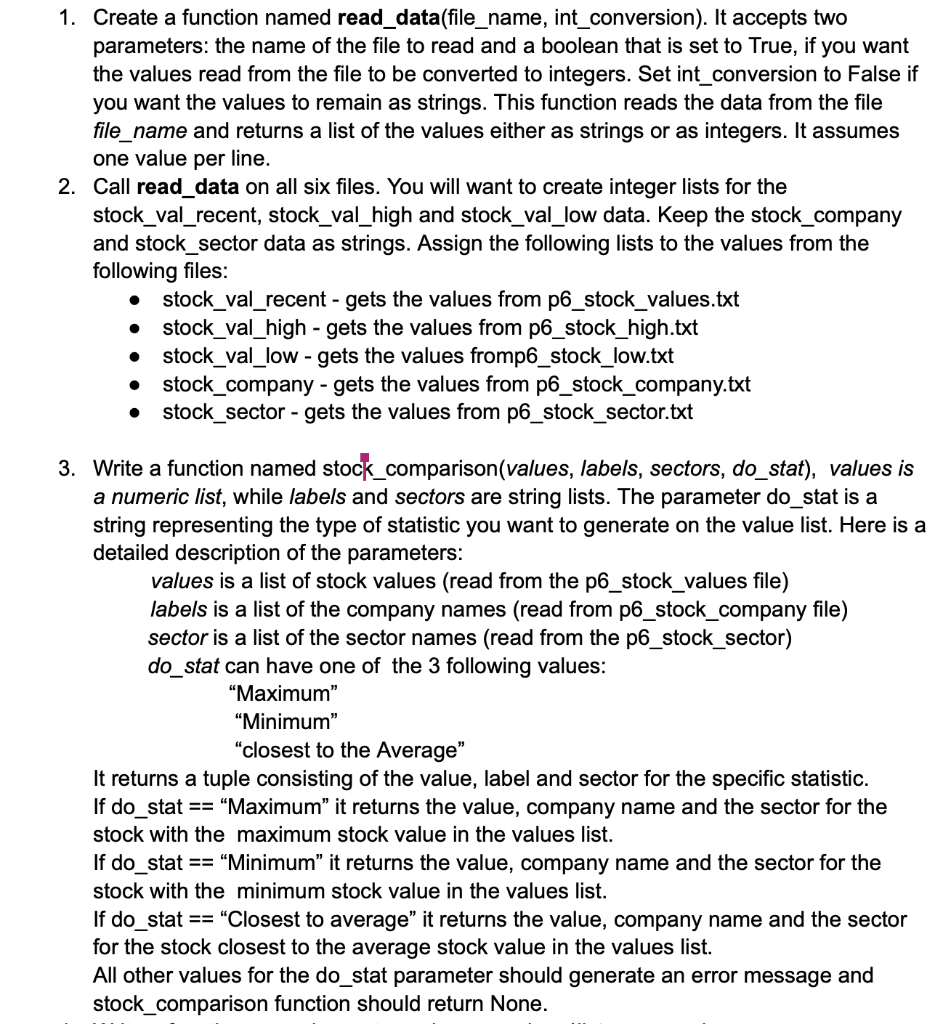
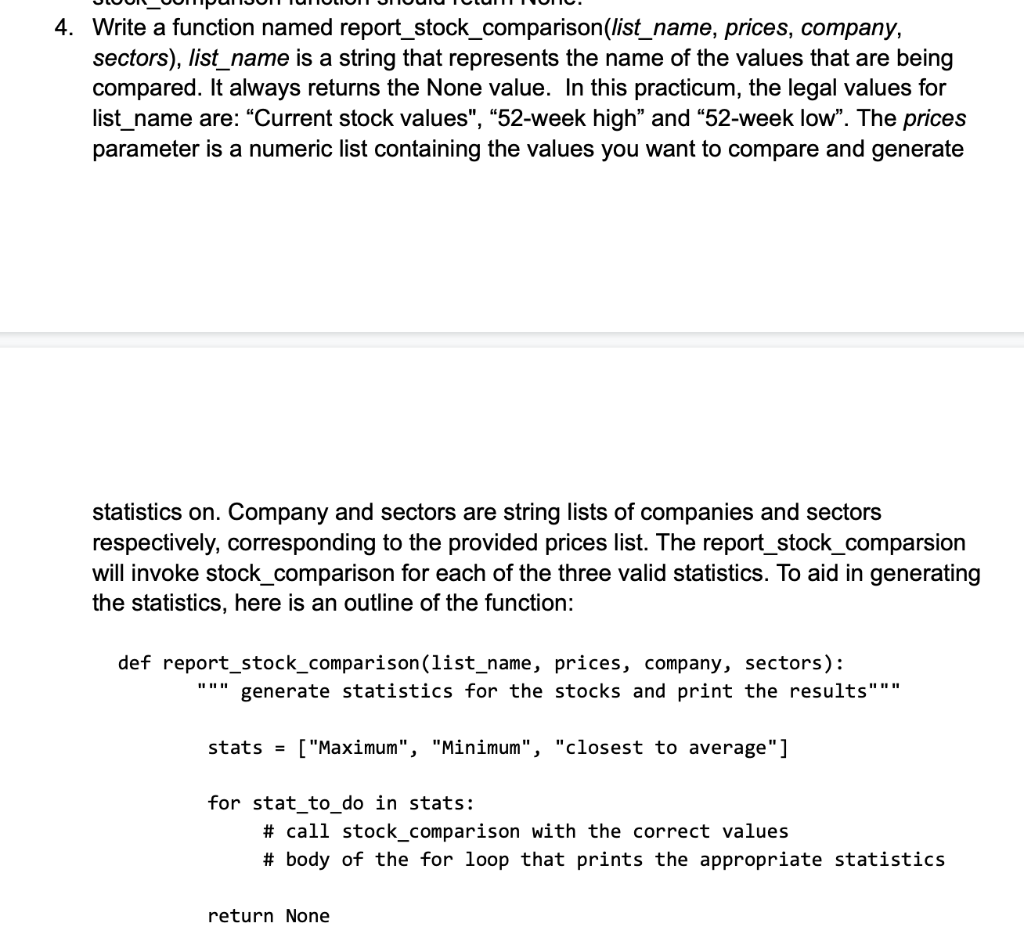
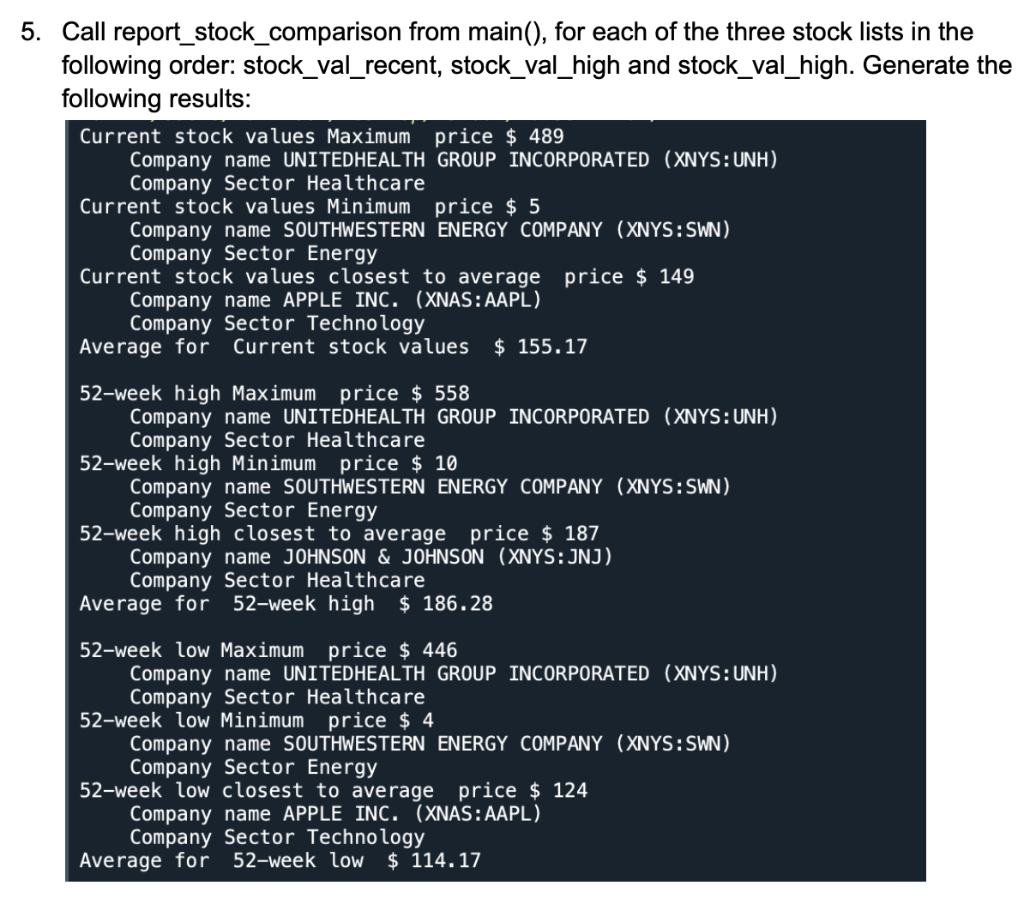
1. Create a function named read_data(file_name, int_conversion). It accepts two parameters: the name of the file to read and a boolean that is set to True, if you want the values read from the file to be converted to integers. Set int_conversion to False if you want the values to remain as strings. This function reads the data from the file file_name and returns a list of the values either as strings or as integers. It assumes one value per line. 2. Call read_data on all six files. You will want to create integer lists for the stock_val_recent, stock_val_high and stock_val_low data. Keep the stock_company and stock_sector data as strings. Assign the following lists to the values from the following files: - stock_val_recent - gets the values from p6_stock_values.txt - stock_val_high - gets the values from p6_stock_high.txt - stock_val_low - gets the values fromp6_stock_low.txt - stock_company - gets the values from p6_stock_company.txt - stock_sector - gets the values from p6_stock_sector.txt 3. Write a function named stock_comparison(values, labels, sectors, do_stat), values is a numeric list, while labels and sectors are string lists. The parameter do_stat is a string representing the type of statistic you want to generate on the value list. Here is a detailed description of the parameters: values is a list of stock values (read from the p6_stock_values file) labels is a list of the company names (read from p6_stock_company file) sector is a list of the sector names (read from the p6_stock_sector) do_stat can have one of the 3 following values: "Maximum" "Minimum" "closest to the Average" It returns a tuple consisting of the value, label and sector for the specific statistic. If do_stat == "Maximum" it returns the value, company name and the sector for the stock with the maximum stock value in the values list. If do_stat == "Minimum" it returns the value, company name and the sector for the stock with the minimum stock value in the values list. If do_stat == "Closest to average" it returns the value, company name and the sector for the stock closest to the average stock value in the values list. All other values for the do_stat parameter should generate an error message and stock_comparison function should return None. 4. Write a function named report_stock_comparison_list_name, prices, company, sectors), list_name is a string that represents the name of the values that are being compared. It always returns the None value. In this practicum, the legal values for list_name are: "Current stock values", "52-week high" and "52-week low". The prices parameter is a numeric list containing the values you want to compare and generate statistics on. Company and sectors are string lists of companies and sectors respectively, corresponding to the provided prices list. The report_stock_comparsion will invoke stock_comparison for each of the three valid statistics. To aid in generating the statistics, here is an outline of the function: def report_stock_comparison(list_name, prices, company, sectors): """ generate statistics for the stocks and print the results""" stats = ["Maximum", "Minimum", "closest to average"] for stat_to_do in stats: \# call stock_comparison with the correct values \# body of the for loop that prints the appropriate statistics return None Call report_stock_comparison from main(), for each of the three stock lists in the following order: stock_val_recent, stock_val_high and stock_val_high. Generate the following results: Current stock values Maximum price $489 Company name UNITEDHEALTH GROUP INCORPORATED (XNYS:UNH) Company Sector Healthcare Current stock values Minimum price \$ 5 Company name SOUTHWESTERN ENERGY COMPANY (XNYS:SWN) Company Sector Energy Current stock values closest to average price $149 Company name APPLE INC. (XNAS:AAPL) Company Sector Technology Average for Current stock values $155.17 52-week high Maximum price \$ 558 Company name UNITEDHEALTH GROUP INCORPORATED (XNYS:UNH) Company Sector Healthcare 52-week high Minimum price \$ 10 Company name SOUTHWESTERN ENERGY COMPANY (XNYS:SWN) Company Sector Energy 52-week high closest to average price \$ 187 Company name JOHNSON \& JOHNSON (XNYS: JNJ) Company Sector Healthcare Average for 52-week high $186.28 52-week low Maximum price \$ 446 Company name UNITEDHEALTH GROUP INCORPORATED (XNYS:UNH) Company Sector Healthcare 52-week low Minimum price \$ 4 Company name SOUTHWESTERN ENERGY COMPANY (XNYS:SWN) Company Sector Energy 52-week low closest to average price \$ 124 Company name APPLE INC. (XNAS:AAPL) Company Sector Technology Average for 52-week low \$ 114.17Step by Step Solution
There are 3 Steps involved in it
Step: 1

Get Instant Access to Expert-Tailored Solutions
See step-by-step solutions with expert insights and AI powered tools for academic success
Step: 2

Step: 3
Ace Your Homework with AI
Get the answers you need in no time with our AI-driven, step-by-step assistance
Get Started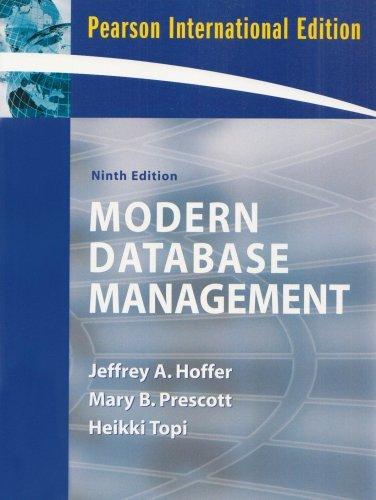
Modern Database Management
Authors: Jeffrey A. Hoffer Fred R. McFadden
9th Edition
B01JXPZ7AK, 9780805360479