I do not need the explanation, just double checking my answers. Thanks!
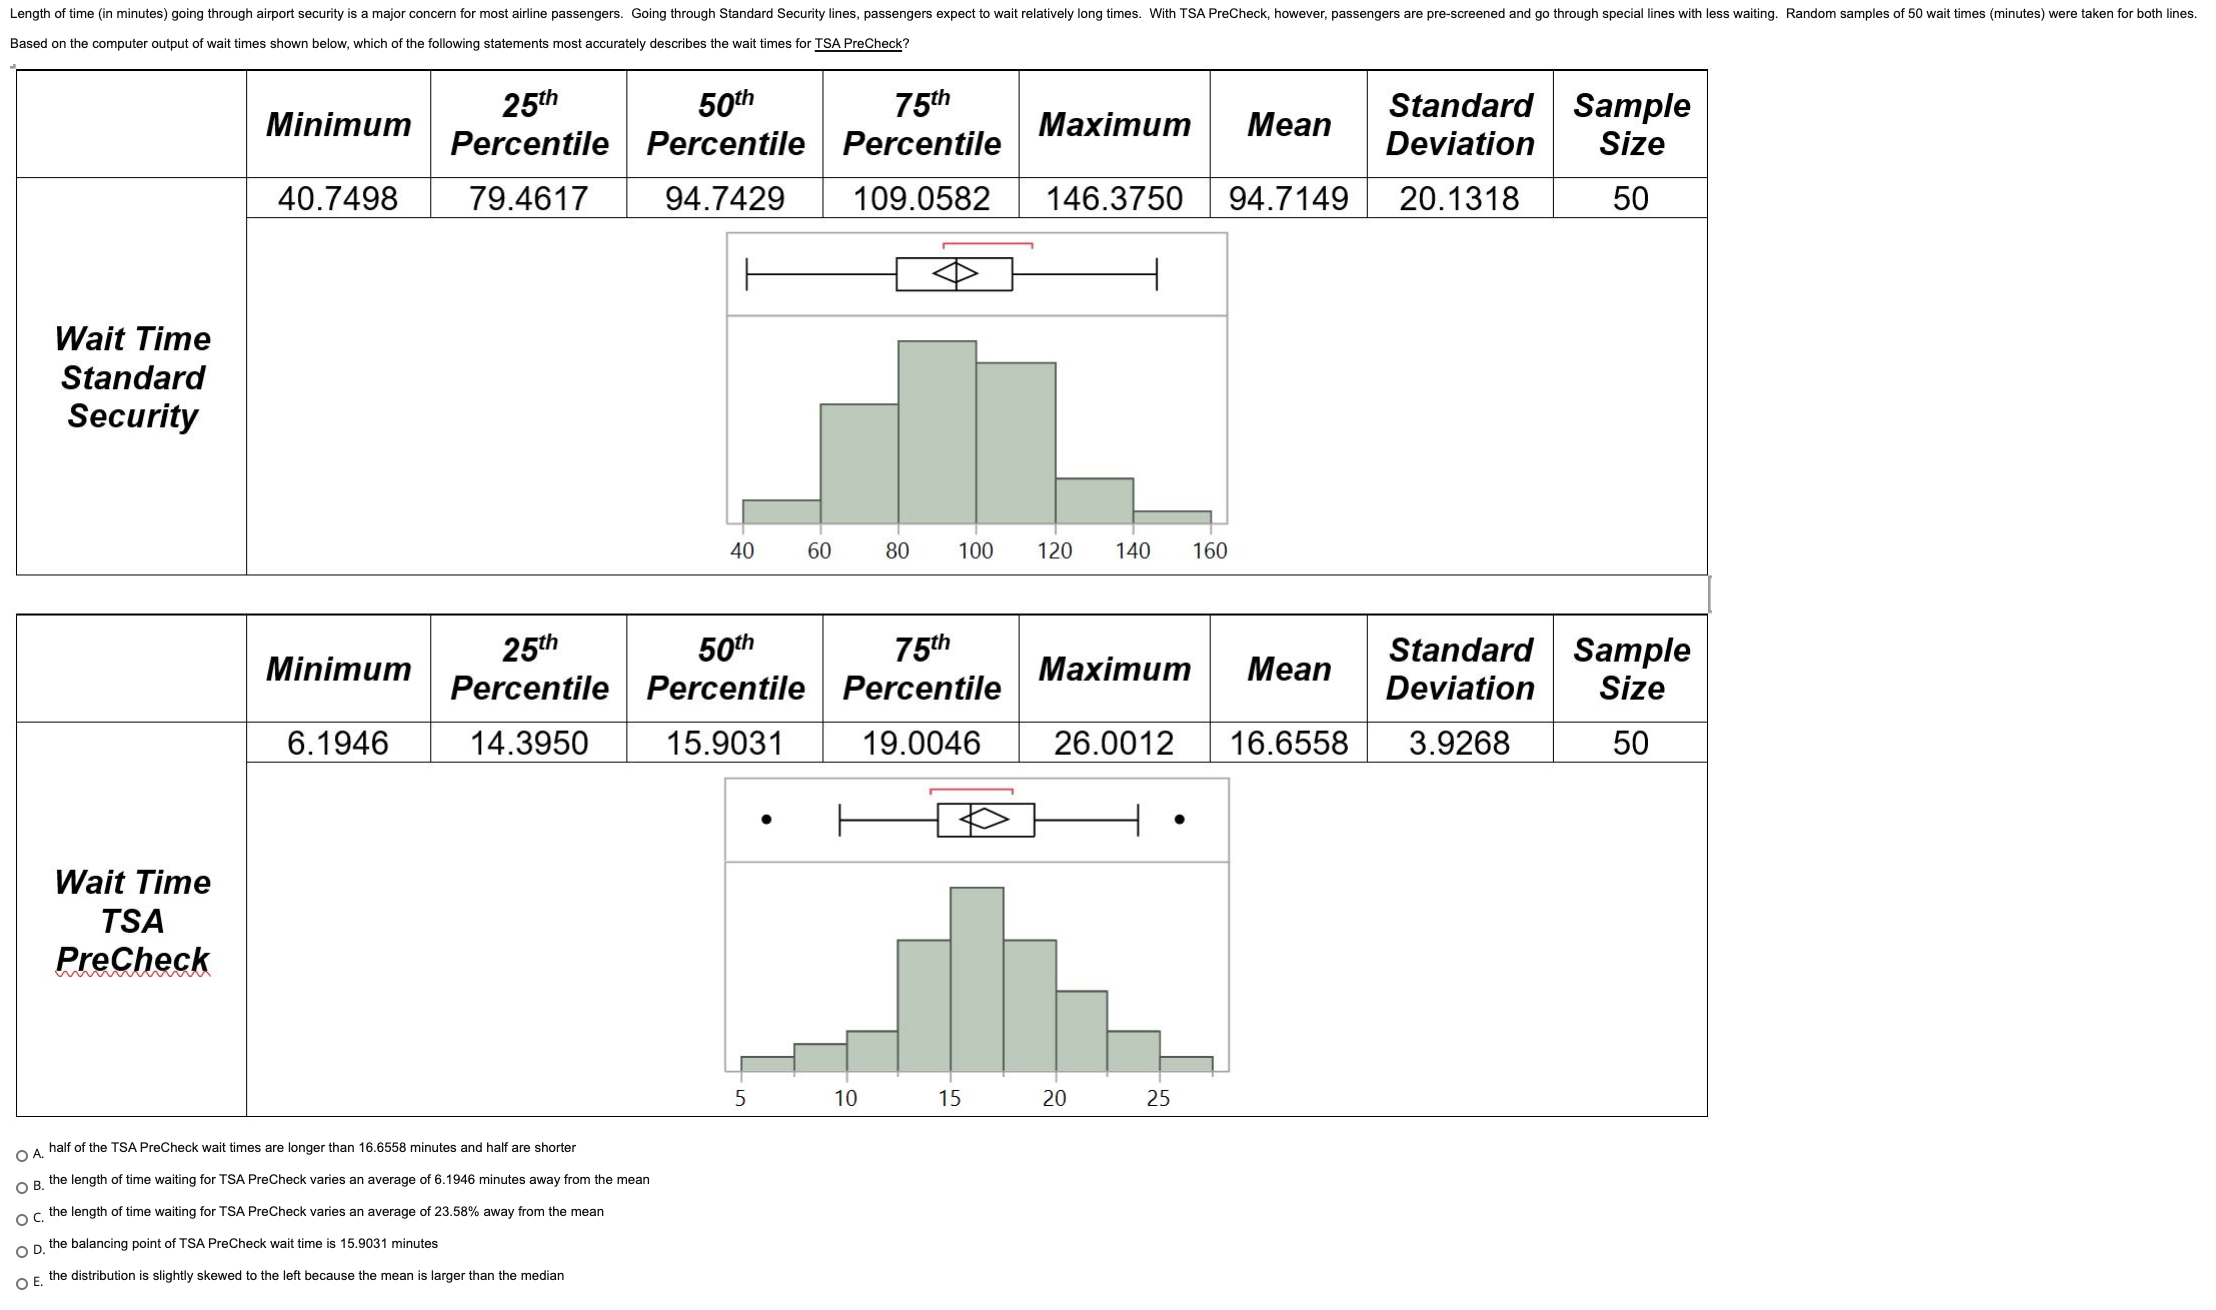
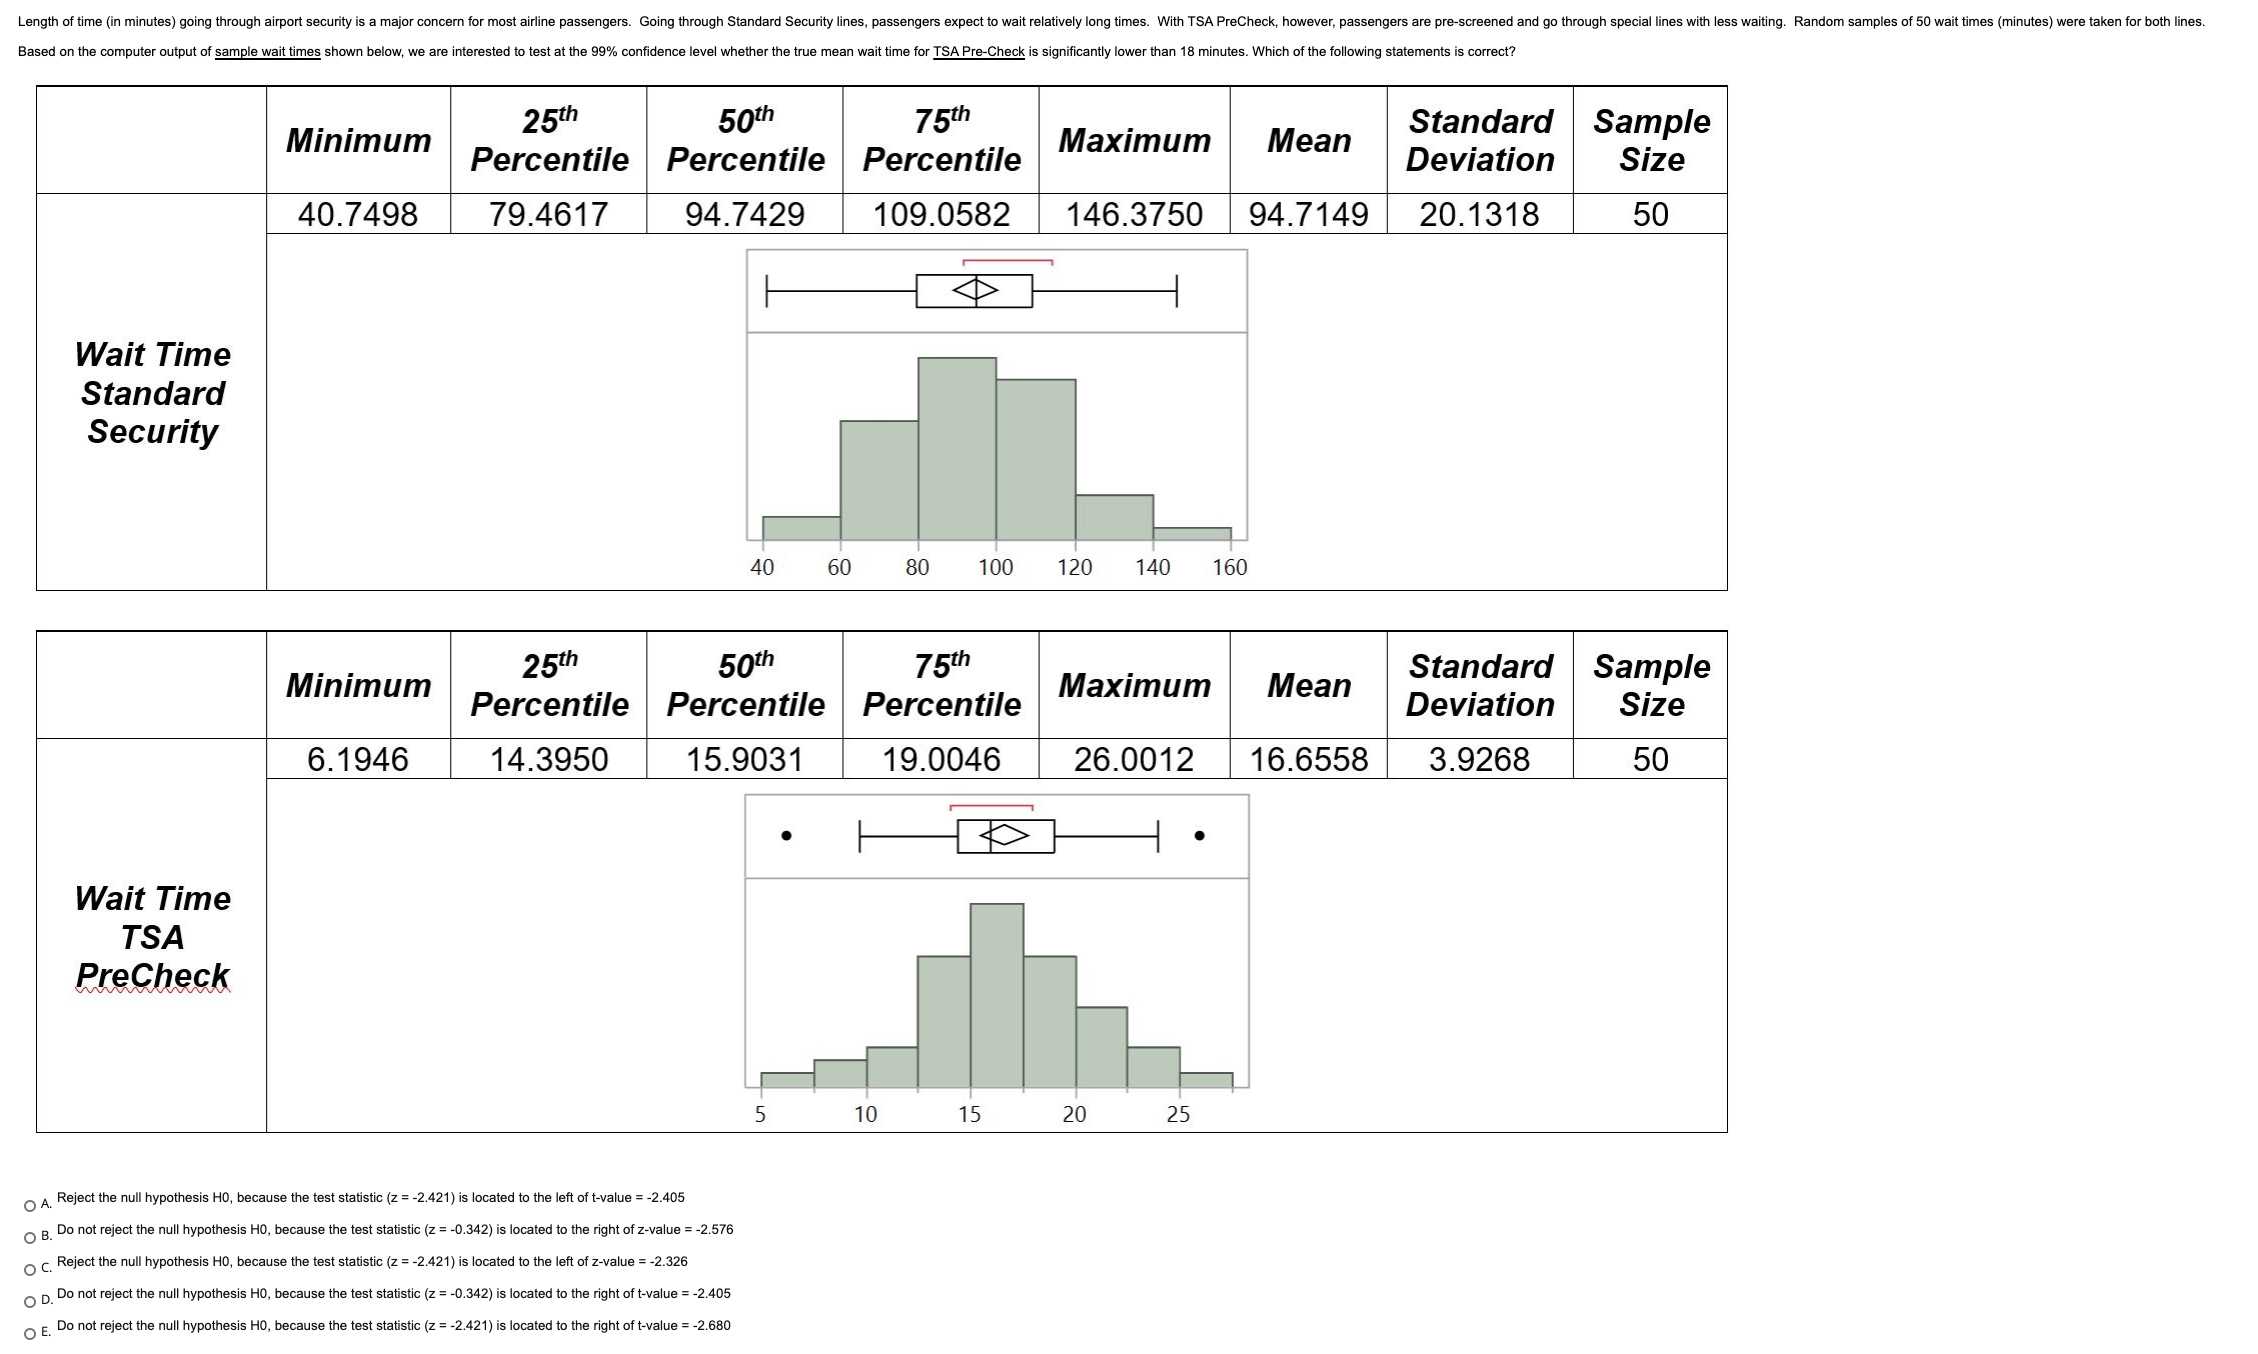
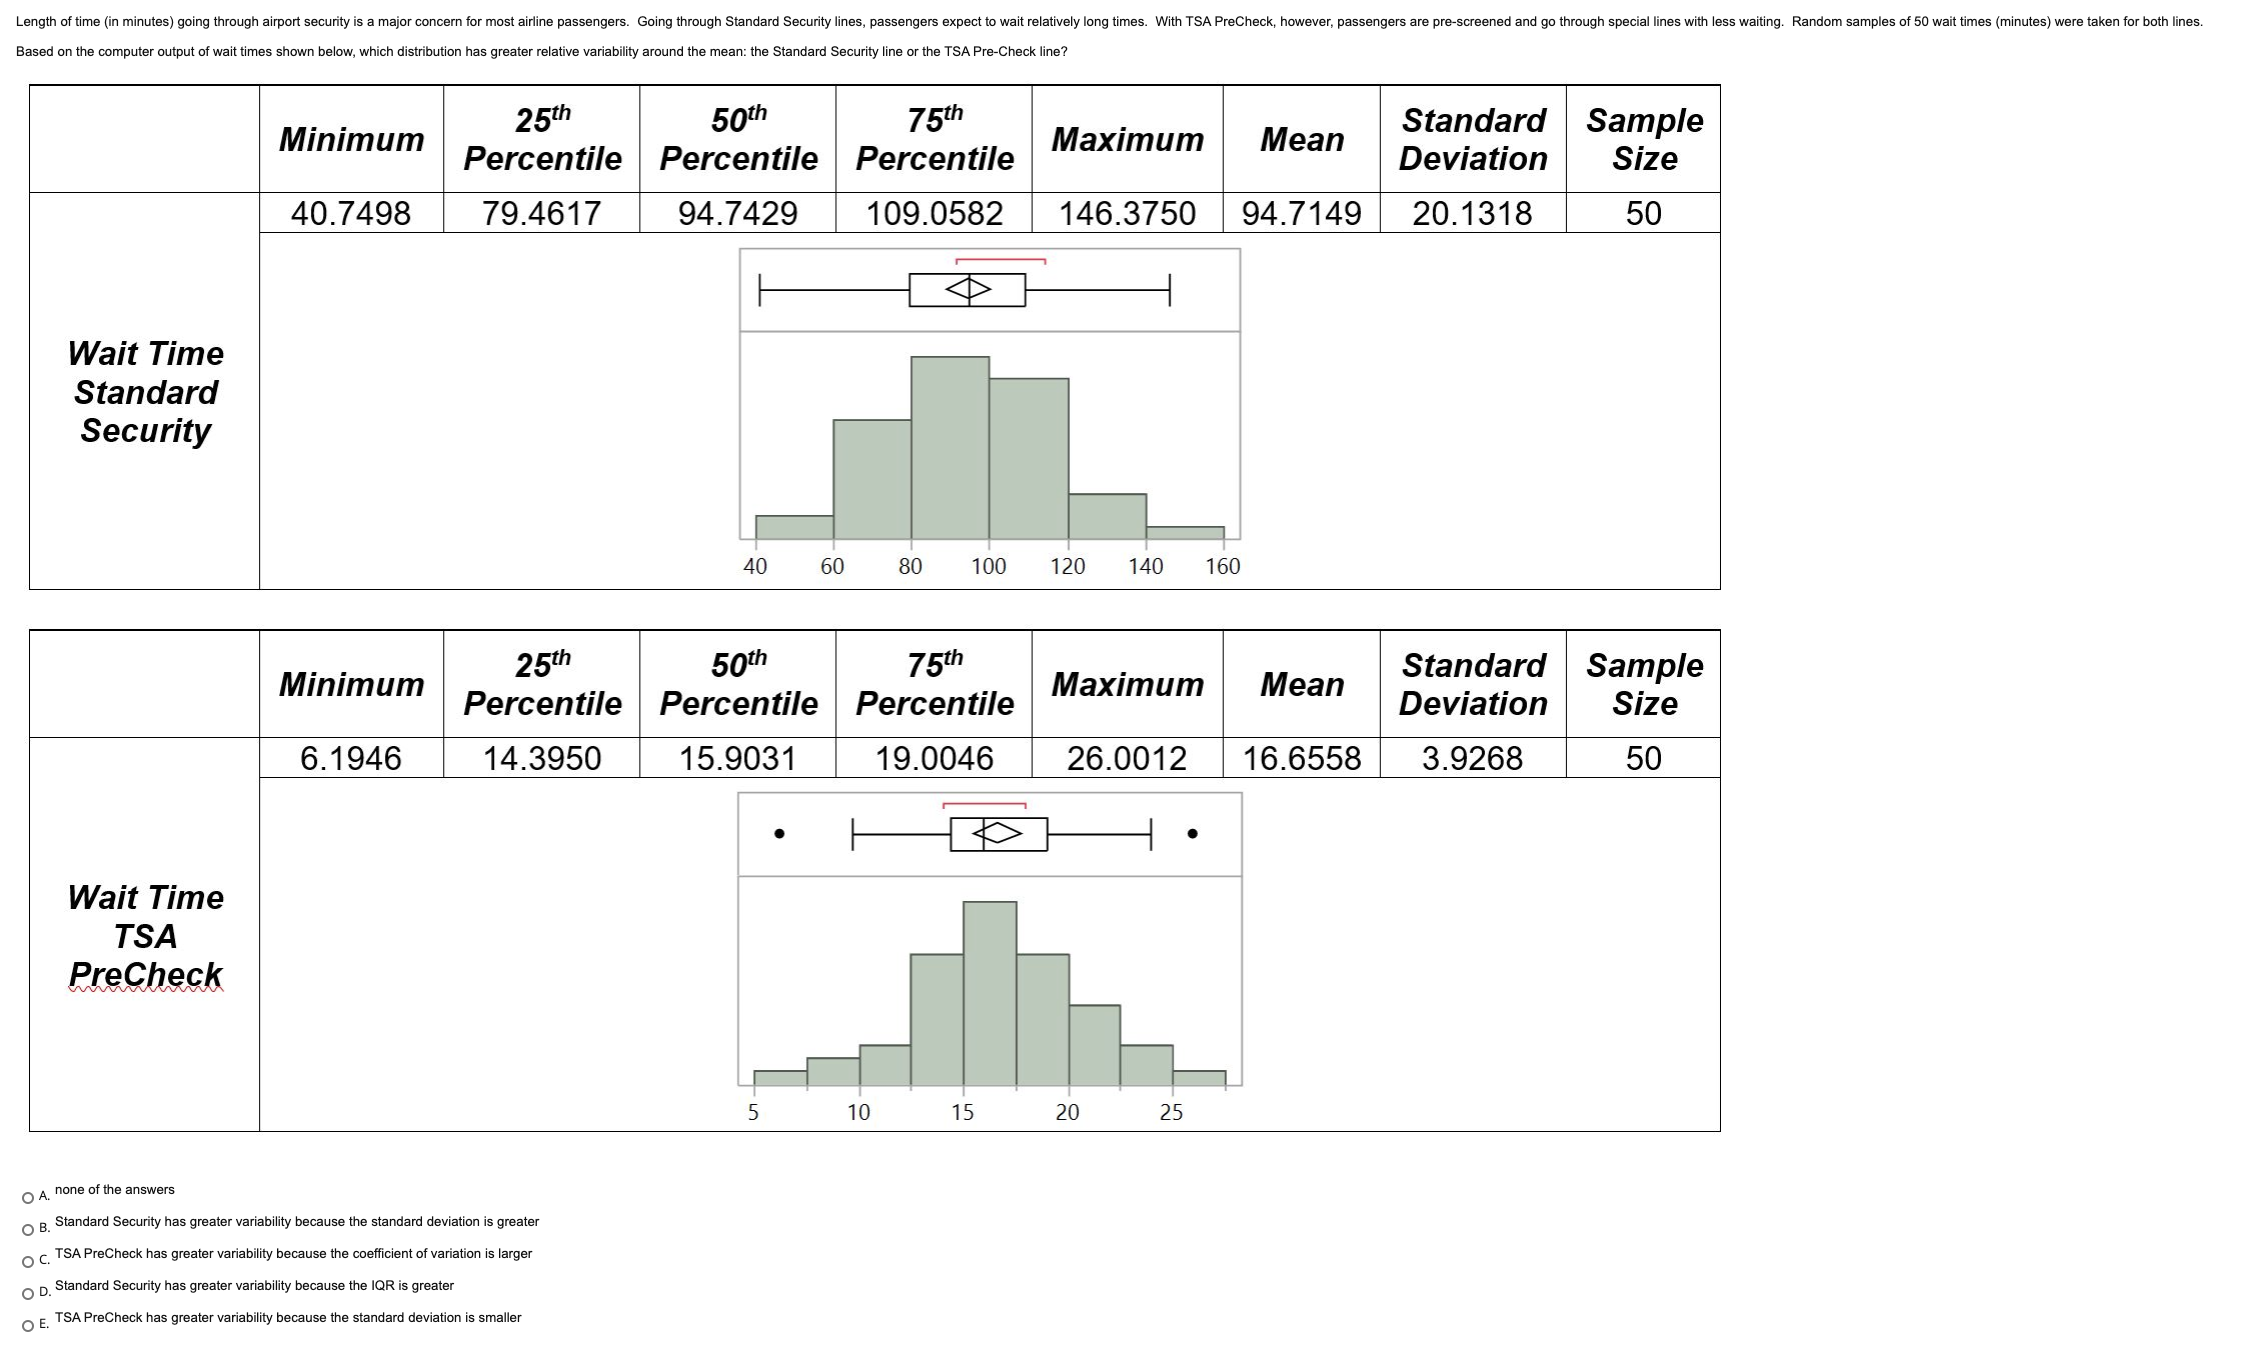
O A. 0.1171 High school students using their cell phones to text in class is a major problem in disrupting the learning experience. Suppose whether or not a student texts in a high school class is a binomial random variable with a O B. 0.7468 success probability p = 0.60. Out of a class of 20 students, find the probability that 10 or more students, but 14 or less text in class (i.e., either 10, 11, 12, 13, or 14 students) O c. none of the answers O D. 0.1244 O E. 0.7043Length of time (in minutes) going through airport security is a major concern for most airline passengers. Going through Standard Security lines, passengers expect to wait relatively long times. With TSA PreCheck, however, passengers are pre-screened and go through special lines with less waiting. Random samples of 50 wait times (minutes) were taken for both lines. Based on the computer output of wait times shown below, which of the following statements most accurately describes the wait times for TSA PreCheck 25th 50th 75th Mean Standard Sample Minimum Percentile Percentile Percentile Maximum Deviation Size 40.7498 79.4617 94.7429 109.0582 146.3750 94.7149 20.1318 50 Wait Time Standard Security 40 60 80 100 120 140 160 25th 50th 75th Standard Sample Minimum Percentile Percentile Maximum Mean Percentile Deviation Size 6. 1946 14.3950 15.9031 19.0046 26.0012 16.6558 3.9268 50 Wait Time TSA PreCheck 5 10 15 20 25 A. half of the TSA PreCheck wait times are longer than 16.6558 minutes and half are shorter O B. the length of time waiting for TSA PreCheck varies an average of 6.1946 minutes away from the mean c, the length of time waiting for TSA PreCheck varies an average of 23.58% away from the mean O D. the balancing point of TSA PreCheck wait time is 15.9031 minutes O E. the distribution is slightly skewed to the left because the mean is larger than the medianLength of time (in minutes) going through airport security is a major concern for most airline passengers. Going through Standard Security lines, passengers expect to wait relatively long times. With TSA PreCheck, however, passengers are pre-screened and go through special lines with less waiting. Random samples of 50 wait times (minutes) were taken for both lines. Based on the computer output of sample wait times shown below, we are interested to test at the 99% confidence level whether the true mean wait time for TSA Pre-Check is significantly lower than 18 minutes. Which of the following statements is correct? 25th 50th 75th Standard Sample Minimum Percentile Percentile Mean Percentile Maximum Deviation Size 40.7498 79.4617 94.7429 109.0582 146.3750 94.7149 20.1318 50 Wait Time Standard Security 40 60 80 100 120 140 160 25th 50th 75th Standard Sample Minimum Percentile Percentile Percentile Maximum Mean Deviation Size 6. 1946 14.3950 15.9031 19.0046 26.0012 16.6558 3.9268 50 Wait Time TSA PreCheck 5 10 15 20 25 O A. Reject the null hypothesis HO, because the test statistic (z = -2.421) is located to the left of t-value = -2.405 O B. Do not reject the null hypothesis HO, because the test statistic (2 = -0.342) is located to the right of z-value = -2.576 O c. Reject the null hypothesis HO, because the test statistic (z = -2.421) is located to the left of z-value = -2.326 O D. Do not reject the null hypothesis HO, because the test statistic (z = -0.342) is located to the right of t-value = -2.405 O E. Do not reject the null hypothesis HO, because the test statistic (z = -2.421) is located to the right of t-value = -2.680Length of time (in minutes) going through airport security is a major concern for most airline passengers. Going through Standard Security lines, passengers expect to wait relatively long times. With TSA PreCheck, however, passengers are pre-screened and go through special lines with less waiting. Random samples of 50 wait times (minutes) were taken for both lines. Based on the computer output of wait times shown below, which distribution has greater relative variability around the mean: the Standard Security line or the TSA Pre-Check line? 25th 50th 75th Mean Standard Sample Minimum Percentile Percentile Percentile Maximum Deviation Size 40.7498 79.4617 94.7429 109.0582 146.3750 94.7149 20.1318 50 Wait Time Standard Security 40 60 80 100 120 140 160 25th 50th 75th Standard Minimum Sample Percentile Percentile Percentile Maximum Mean Deviation Size 6. 1946 14.3950 15.9031 19.0046 26.0012 16.6558 3.9268 50 Wait Time TSA PreCheck 5 10 15 20 25 O A. none of the answers O B. Standard Security has greater variability because the standard deviation is greater O c. TSA PreCheck has greater variability because the coefficient of variation is larger . D. Standard Security has greater variability because the IQR is greater O E. TSA PreCheck has greater variability because the standard deviation is smallerO A. 0.2514 O B. 0.0000 takes random samples of n = 30 jars to monitor the process. Which of the following is the best response for the probability that the mean of a random sample of n = 30 jars is less than 40.00 ounces? The largest domestic producer of spaghetti sauce produces millions of jars of spaghetti sauce a year. The mean of the filling process is set at a population mean m = 40.20 ounces with a population standard deviation o = 0.30 ounces. Inspection at the plant O c. 1.0000 O D. 0.7486 O E. none of the answers| Companies are trying to reduce sample sizes in order to speed decisions and reduce costs, Suppose samples of size 30 are taken instead of samples of size 150. Based on the characteristics of sampling distribution of means, which of the following statement is correct as the sample size decreases? O A The mean of the sample ()1) decreases O B The mean of the sampling distribution of means (pi) decreases O C' The mean of the population (u) decreases O D The mean of the sampling distribution of means (l'i) does not change 0 E The mean of the sampling distribution of means (pg) increases


