

Answered step by step
Verified Expert Solution
Question
1 Approved Answer
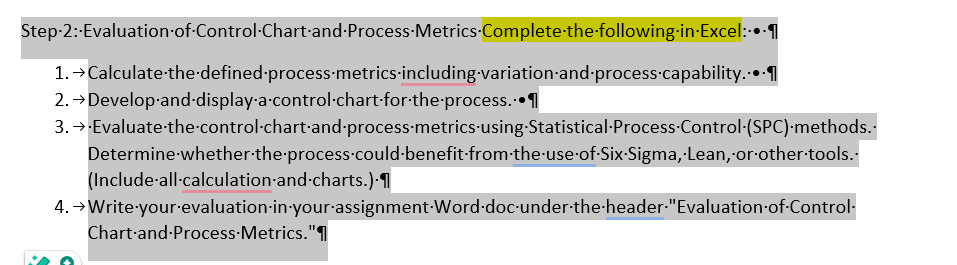
I do not understand? Where do I start? Step-2: Evaluation.of Control.Chart.and.Process.Metrics.Complete.the.following.in .Excel:.. .1 1. - Calculate.the.defined.process.metrics.including.variation.and.process.capability. .. .1 2. - Develop.and-display.a-control.chart.for.the.process. .. 1 3.-.Evaluate.the control.chart.and.process.metrics.using.Statistical-Process.Control.(SPC).methods.
I do not understand? Where do I start?
Step by Step Solution
There are 3 Steps involved in it
Step: 1

Get Instant Access to Expert-Tailored Solutions
See step-by-step solutions with expert insights and AI powered tools for academic success
Step: 2

Step: 3
Ace Your Homework with AI
Get the answers you need in no time with our AI-driven, step-by-step assistance
Get Started
Strategic Management
Authors: Richard Lynch
5th Edition
0273716387, 978-0273716389