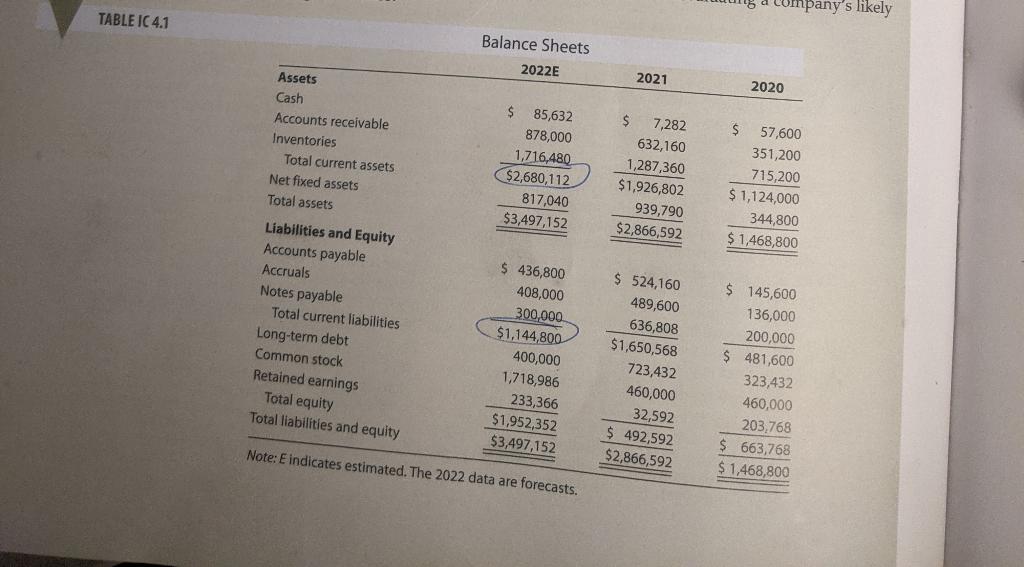
i. Does it appear that inventories could be adjusted? If so, how should that adjustment affect DLeons profitability and stock price?


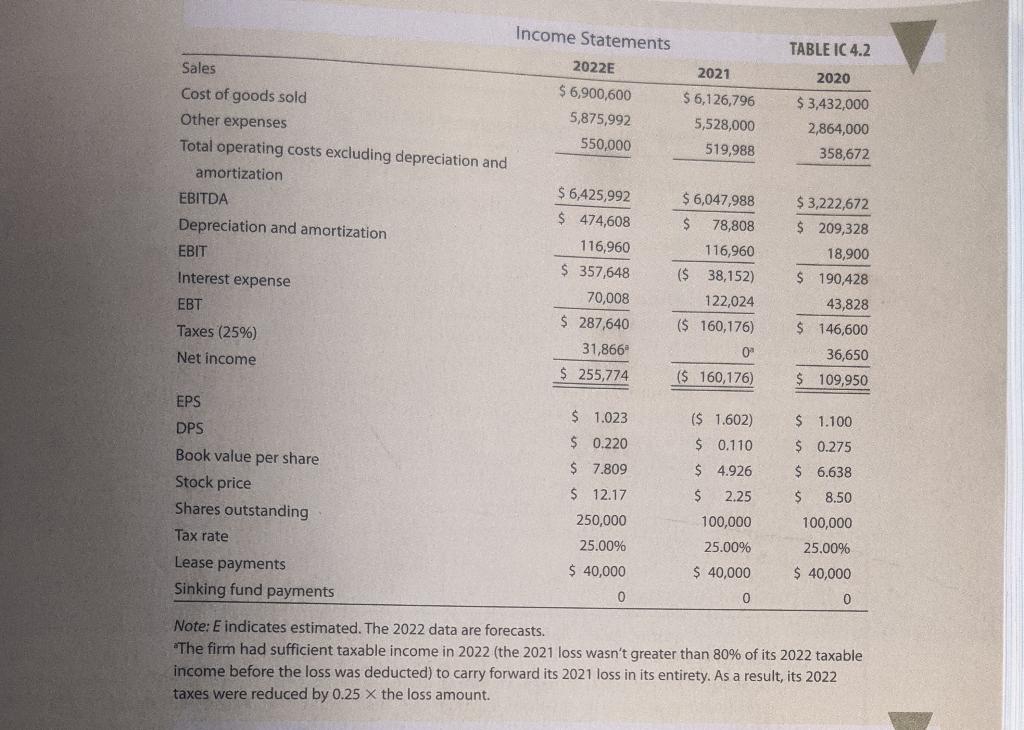
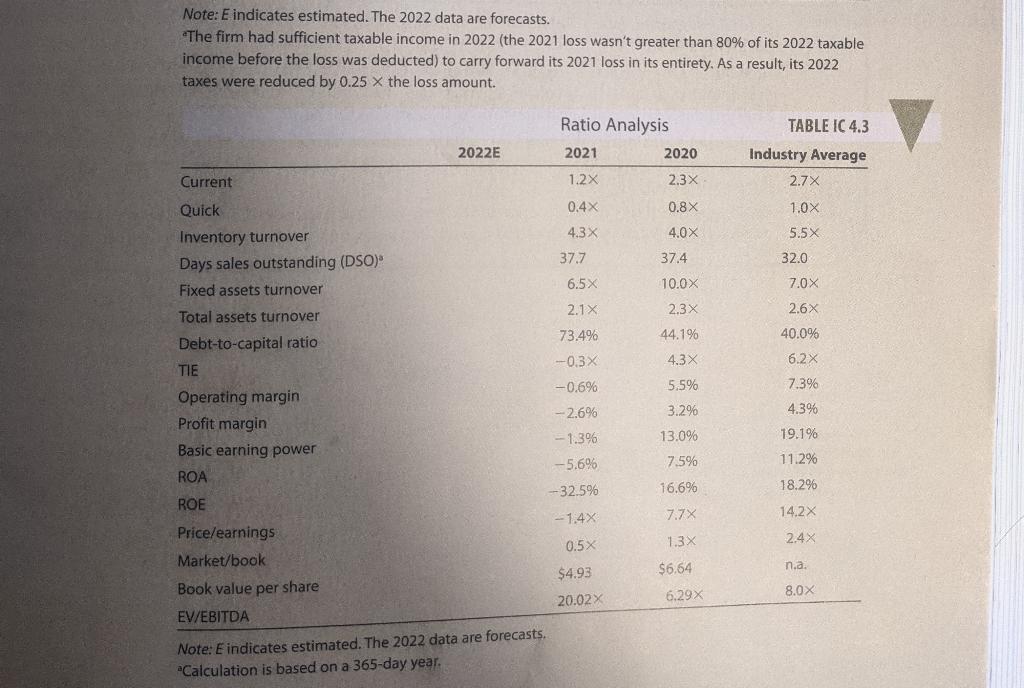
company's likely TABLE IC 4.1 Balance Sheets 2022E 2021 2020 Assets Cash Accounts receivable Inventories Total current assets Net fixed assets Total assets $ 85,632 878,000 1,716,480 $2,680,112 817,040 $3,497,152 $ 7,282 632,160 1,287,360 $1,926,802 939,790 $2,866,592 $ 57,600 351,200 715,200 $ 1,124,000 344,800 $ 1,468,800 Liabilities and Equity Accounts payable Accruals Notes payable Total current liabilities Long-term debt Common stock Retained earnings Total equity Total liabilities and equity $ 436,800 408,000 300,000 $1,144,800 400,000 1,718,986 233,366 $1,952,352 $3,497,152 $ 524,160 489,600 636,808 $1,650,568 723,432 460,000 32,592 $ 492,592 $2,866,592 $ 145,600 136,000 200,000 $ 481,600 323,432 460,000 203,768 $ 663,768 $ 1,468,800 Note: E indicates estimated. The 2022 data are forecasts. Income Statements TABLE IC 4.2 2022E 2021 2020 $ 6,900,600 5,875,992 550,000 $ 6,126,796 5,528,000 519,988 $ 3,432,000 2,864,000 358,672 Sales Cost of goods sold Other expenses Total operating costs excluding depreciation and amortization EBITDA Depreciation and amortization EBIT Interest expense EBT Taxes (25%) Net income $ 6,047,988 $ 78,808 116,960 $ 6,425,992 $ 474,608 116,960 $ 357,648 70,008 $ 287,640 31,866 ($ 38,152) $ 3,222,672 $ 209,328 18,900 $ 190,428 43,828 $ 146,600 36,650 $ 109,950 122,024 ($ 160,176) 09 $ 255,774 ($ 160,176) EPS ($ 1.602) $ 1.100 $ 1.023 $ 0.220 $ 7.809 $ 0.110 $ 0.275 $ 6.638 $ 8.50 DPS Book value per share Stock price Shares outstanding Tax rate Lease payments Sinking fund payments $ 12.17 250,000 25.00% $ 40,000 0 $ 4.926 $ 2.25 100,000 25.00% $ 40,000 100,000 25.00% $ 40,000 0 0 Note: E indicates estimated. The 2022 data are forecasts. "The firm had sufficient taxable income in 2022 (the 2021 loss wasn't greater than 80% of its 2022 taxable income before the loss was deducted) to carry forward its 2021 loss in its entirety. As a result, its 2022 taxes were reduced by 0.25 X the loss amount. Note: E indicates estimated. The 2022 data are forecasts. The firm had sufficient taxable income in 2022 (the 2021 loss wasn't greater than 80% of its 2022 taxable income before the loss was deducted) to carry forward its 2021 loss in its entirety. As a result, its 2022 taxes were reduced by 0.25 X the loss amount. Ratio Analysis 2021 2020 2022E TABLE IC 4.3 Industry Average 2.7X Current 1.2X 2.3x Quick 0.4% 0.8X 1.0X 5.5X 4.3 x Inventory turnover Days sales outstanding (DSO) 4.0X 37.4 37.7 32.0 6.5% 10.0 7.0X Fixed assets turnover 2.1X 2.3X 2.6 Total assets turnover 73.4% 44.1% 40.0% -0.3X 4.3% 6.2 X -0.6% 5.5% 7.3% Debt-to-capital ratio TIE Operating margin Profit margin Basic earning power ROA -2.6% 3.2% 4.3% --1.39% 13.0% 19.1% -5.6% 7.5% 11.2% -32.5% 16.6% 18.2% ROE -1.4% 7.78 14.2 Price/earnings Market/book 2.4x 0.5x 1.3 X $4.93 $6.64 na. 6.29% 8.0X Book value per share EV/EBITDA 20.02% Note: E indicates estimated. The 2022 data are forecasts. *Calculation is based on a 365-day year. company's likely TABLE IC 4.1 Balance Sheets 2022E 2021 2020 Assets Cash Accounts receivable Inventories Total current assets Net fixed assets Total assets $ 85,632 878,000 1,716,480 $2,680,112 817,040 $3,497,152 $ 7,282 632,160 1,287,360 $1,926,802 939,790 $2,866,592 $ 57,600 351,200 715,200 $ 1,124,000 344,800 $ 1,468,800 Liabilities and Equity Accounts payable Accruals Notes payable Total current liabilities Long-term debt Common stock Retained earnings Total equity Total liabilities and equity $ 436,800 408,000 300,000 $1,144,800 400,000 1,718,986 233,366 $1,952,352 $3,497,152 $ 524,160 489,600 636,808 $1,650,568 723,432 460,000 32,592 $ 492,592 $2,866,592 $ 145,600 136,000 200,000 $ 481,600 323,432 460,000 203,768 $ 663,768 $ 1,468,800 Note: E indicates estimated. The 2022 data are forecasts. Income Statements TABLE IC 4.2 2022E 2021 2020 $ 6,900,600 5,875,992 550,000 $ 6,126,796 5,528,000 519,988 $ 3,432,000 2,864,000 358,672 Sales Cost of goods sold Other expenses Total operating costs excluding depreciation and amortization EBITDA Depreciation and amortization EBIT Interest expense EBT Taxes (25%) Net income $ 6,047,988 $ 78,808 116,960 $ 6,425,992 $ 474,608 116,960 $ 357,648 70,008 $ 287,640 31,866 ($ 38,152) $ 3,222,672 $ 209,328 18,900 $ 190,428 43,828 $ 146,600 36,650 $ 109,950 122,024 ($ 160,176) 09 $ 255,774 ($ 160,176) EPS ($ 1.602) $ 1.100 $ 1.023 $ 0.220 $ 7.809 $ 0.110 $ 0.275 $ 6.638 $ 8.50 DPS Book value per share Stock price Shares outstanding Tax rate Lease payments Sinking fund payments $ 12.17 250,000 25.00% $ 40,000 0 $ 4.926 $ 2.25 100,000 25.00% $ 40,000 100,000 25.00% $ 40,000 0 0 Note: E indicates estimated. The 2022 data are forecasts. "The firm had sufficient taxable income in 2022 (the 2021 loss wasn't greater than 80% of its 2022 taxable income before the loss was deducted) to carry forward its 2021 loss in its entirety. As a result, its 2022 taxes were reduced by 0.25 X the loss amount. Note: E indicates estimated. The 2022 data are forecasts. The firm had sufficient taxable income in 2022 (the 2021 loss wasn't greater than 80% of its 2022 taxable income before the loss was deducted) to carry forward its 2021 loss in its entirety. As a result, its 2022 taxes were reduced by 0.25 X the loss amount. Ratio Analysis 2021 2020 2022E TABLE IC 4.3 Industry Average 2.7X Current 1.2X 2.3x Quick 0.4% 0.8X 1.0X 5.5X 4.3 x Inventory turnover Days sales outstanding (DSO) 4.0X 37.4 37.7 32.0 6.5% 10.0 7.0X Fixed assets turnover 2.1X 2.3X 2.6 Total assets turnover 73.4% 44.1% 40.0% -0.3X 4.3% 6.2 X -0.6% 5.5% 7.3% Debt-to-capital ratio TIE Operating margin Profit margin Basic earning power ROA -2.6% 3.2% 4.3% --1.39% 13.0% 19.1% -5.6% 7.5% 11.2% -32.5% 16.6% 18.2% ROE -1.4% 7.78 14.2 Price/earnings Market/book 2.4x 0.5x 1.3 X $4.93 $6.64 na. 6.29% 8.0X Book value per share EV/EBITDA 20.02% Note: E indicates estimated. The 2022 data are forecasts. *Calculation is based on a 365-day year


