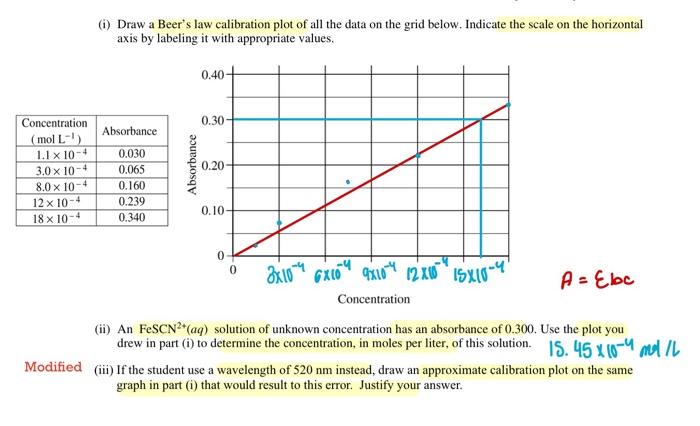
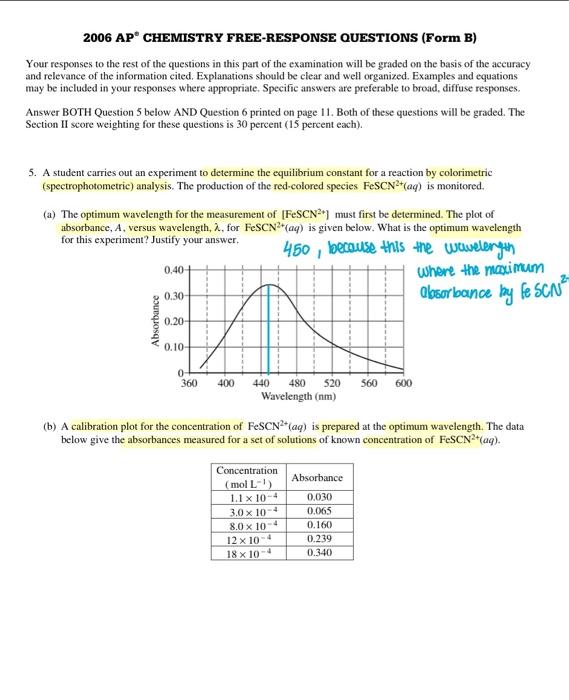
(i) Draw a Beer's law calibration plot of all the data on the grid below. Indicate the scale on the horizontal axis by labeling it with appropriate values. A=bc (ii) An FeSCN2+(aq) solution of unknown concentration has an absorbance of 0.300. Use the plot you drew in part (i) to determine the concentration, in moles per liter, of this solution. 15.45104,15/L (iii) If the student use a wavelength of 520nm instead, draw an approximate calibration plot on the same graph in part (i) that would result to this error. Justify your answer. 2006 AP CHEMISTRY FREE-RESPONSE QUESTIONS (Form B) Your responses to the rest of the questions in this part of the examination will be graded on the basis of the accuracy and relevance of the information cited. Explanations should be clear and well organized. Examples and equations may be included in your responses where appropriate, Specific answers are preferable to broad, diffuse responses. Answer BOTH Question 5 below AND Question 6 printed on page 11. Both of these questions will be graded. The Section II score weighting for these questions is 30 percent (15 percent each). 5. A student carries out an experiment to determine the equilibrium constant for a reaction by colorimetric (spectrophotometric) analysis. The production of the red-colored species FeSCN2+(aq) is monitored. (a) The optimum wavelength for the measurement of [FeSCN 2] must first be determined. The plot of absorbance, A, versus wavelength, , for FeSCN2+(aq) is given below. What is the optimum wavelength for this experiment? Justify your answer. 460, because this the utuderinth shoie the moximum lloorbance by fosce (b) A calibration plot for the concentration of FeSCN2+(aq) is prepared at the optimum wavelength. The data below give the absorbances measured for a set of solutions of known concentration of FeSCN 2+(aq)