Answered step by step
Verified Expert Solution
Link Copied!

Question

1 Approved Answer

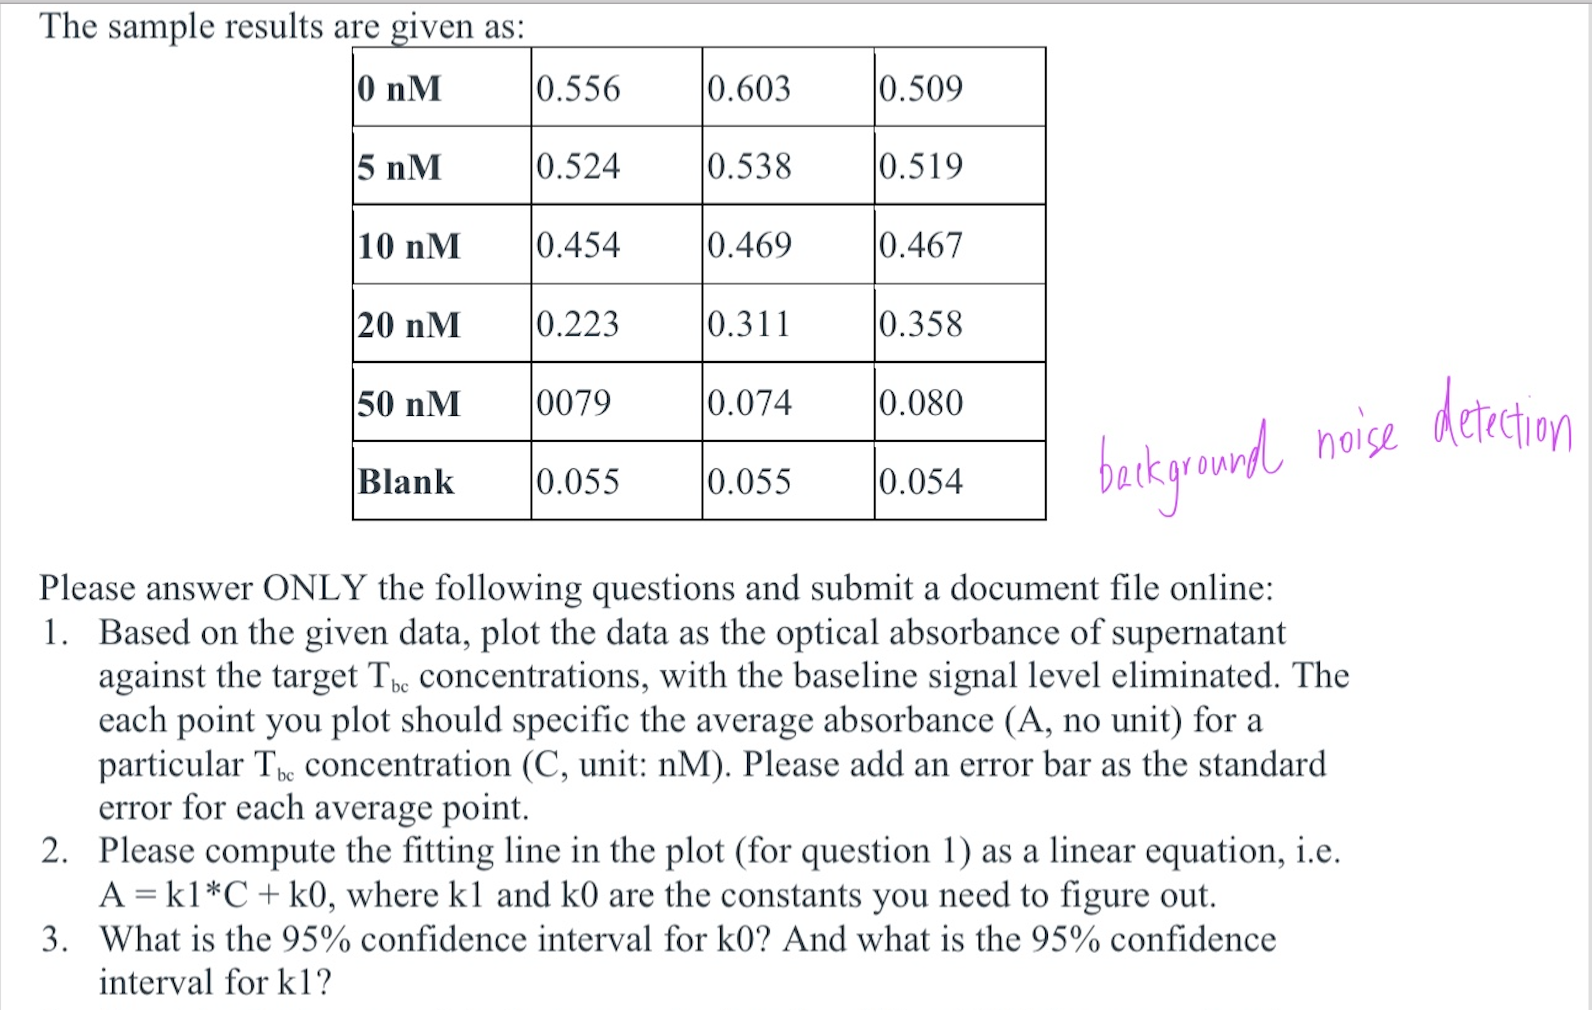
I feel confused with these algebra questions and it is my first time to study linear progression The sample results are given as: 0 nM

I feel confused with these algebra questions and it is my first time to study linear progression

image text in transcribed
The sample results are given as: 0 nM 0.556 0.603 0.509 5 nM 0.524 0.538 0.519 10 nM 0.454 0.469 0.467 20 nM 0.223 0.311 0.358 50 nM 0079 0.074 0.080 Blank 0.055 0.055 0.054 background noise detection Please answer ONLY the following questions and submit a document file online: 1. Based on the given data, plot the data as the optical absorbance of supernatant against the target The concentrations, with the baseline signal level eliminated. The each point you plot should specific the average absorbance (A, no unit) for a particular The concentration (C, unit: nM). Please add an error bar as the standard error for each average point. 2. Please compute the fitting line in the plot (for question 1) as a linear equation, i.e. A = kl*C + k0, where kl and k0 are the constants you need to figure out. 3. What is the 95% confidence interval for k0? And what is the 95% confidence interval for k1

Step by Step Solution

There are 3 Steps involved in it

Step: 1

blur-text-image

Get Instant Access to Expert-Tailored Solutions

See step-by-step solutions with expert insights and AI powered tools for academic success

Step: 2

blur-text-image

Step: 3

blur-text-image

Ace Your Homework with AI

Get the answers you need in no time with our AI-driven, step-by-step assistance

Get Started

Recommended Textbook for

Financial Algebra advanced algebra with financial applications

Authors: Robert K. Gerver

1st edition

978-1285444857, 128544485X, 978-0357229101, 035722910X, 978-0538449670

More Books

Students also viewed these Mathematics questions

Question

Explain how a two-card kanban system works.

Answered: 1 week ago