

Question
i. find the correlogram of the least squares residuals for the model. Is there any evidence of autocorrelations? (5M) ii. test for autocorrelation in the
i. find the correlogram of the least squares residuals for the model. Is there any evidence of autocorrelations? (5M)
ii. test for autocorrelation in the residual using the 2=TR2 version of the LM test, with missing initial values for t set to zero, and lags up to 4. Is there any evidence of autocorrelation? (10M)
iii. compare the estimation values for the coefficients obtained using conventional OLS standard errors with those obtained using HAC standards errors. Are they significantly different from zero at a 5% significance level? Interpret the coefficient values. (10M)
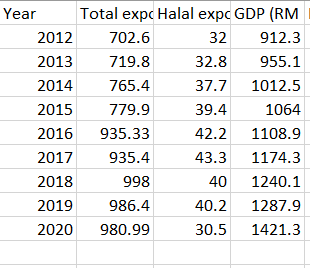
32 Year Total expc Halal expc GDP (RM 2012 702.6 912.3 2013 719.8 32.8 955.1 2014 765.4 37.7 1012.5 2015 779.9 39.4 1064 2016 935.33 42.2 1108.9 2017 935.4 43.3 1174.3 2018 998 40 1240.1 2019 986.4 40.2 1287.9 2020 980.99 30.5 1421.3 32 Year Total expc Halal expc GDP (RM 2012 702.6 912.3 2013 719.8 32.8 955.1 2014 765.4 37.7 1012.5 2015 779.9 39.4 1064 2016 935.33 42.2 1108.9 2017 935.4 43.3 1174.3 2018 998 40 1240.1 2019 986.4 40.2 1287.9 2020 980.99 30.5 1421.3Step by Step Solution
There are 3 Steps involved in it
Step: 1

Get Instant Access to Expert-Tailored Solutions
See step-by-step solutions with expert insights and AI powered tools for academic success
Step: 2

Step: 3
Ace Your Homework with AI
Get the answers you need in no time with our AI-driven, step-by-step assistance
Get Started
Life Audit Workbook Meant For More
Authors: Agnese Iskrova
1st Edition
1716274958, 978-1716274954