I fixed it
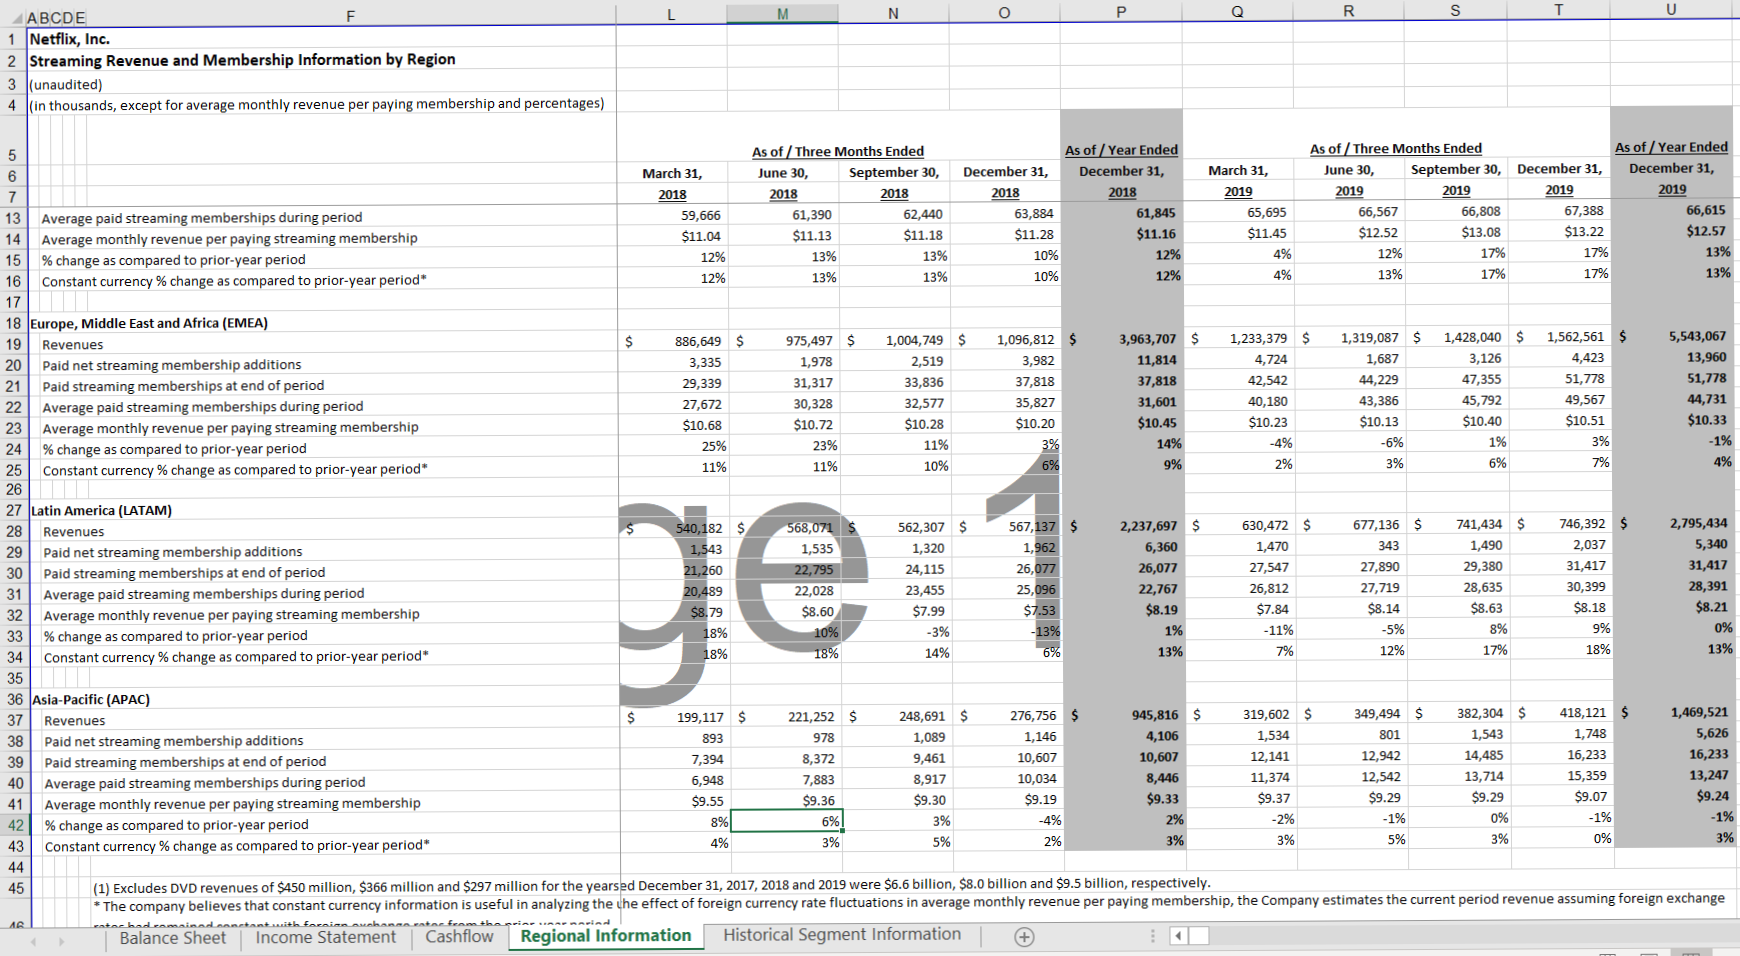
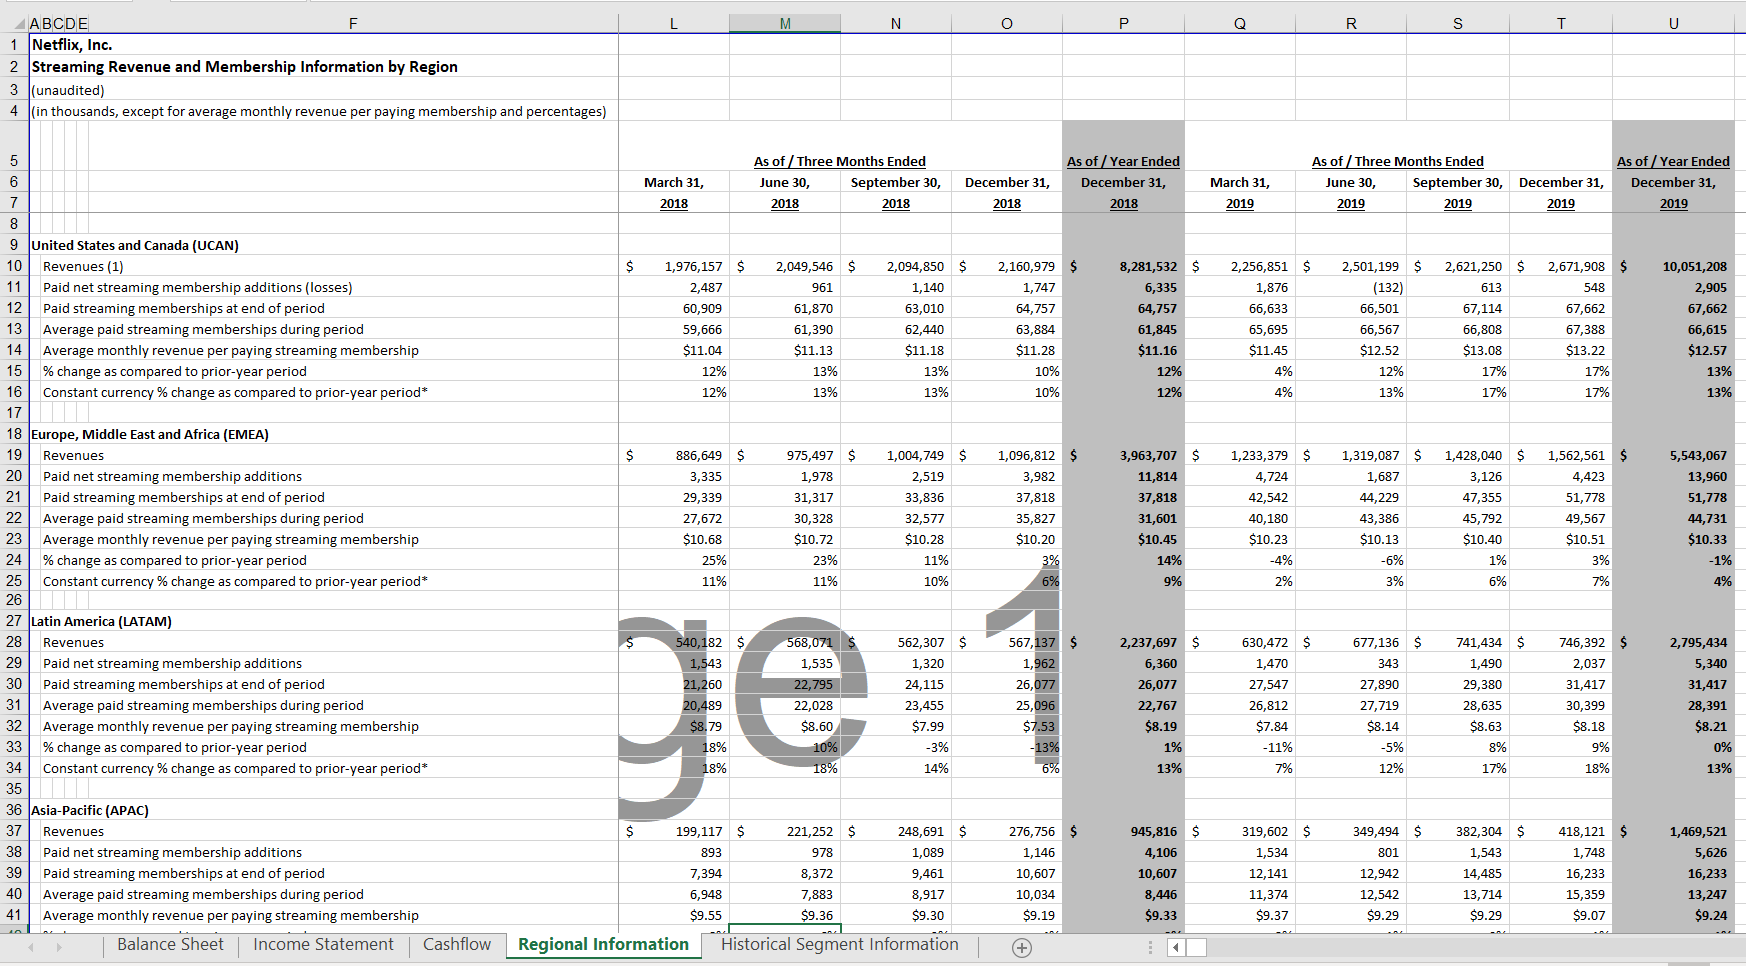
do a forecast for total revenue of the fourth quarter in 2019 for ...... by doing.
1) Generate data into your spreadsheet arranged by total revenue per quarter from March 31st of 2017 through September 30th of 2019.
2) Plot the data and comment on your observation of the data pattern.
3) Try 3 period moving average.
4) Try the exponential smoothing with alpha =0.3 and the initial forecast is the same as the first period.
5) Try FIT with alpha=0.3, beta=0.5 and initial trend=0.
6) Use the multiple regression model to forecast for the fourth quarter of 2019.
ABCDE 1 Netflix, Inc. 2 Streaming Revenue and Membership Information by Region 3 (unaudited) (in thousands, except for average monthly revenue per paying membership and percentages) 4 As of / Year Ended As of / Year Ended As of / Three Months Ended As of / Three Months Ended September 30, December 31, December 31, December 31, March 31, December 31, June 30, March 31, June 30, September 30, 2019 2019 2019 2019 2019 2018 2018 2018 2018 2018 66,615 67,388 66,567 66,808 61,845 65,695 63,884 61,390 62,440 Average paid streaming memberships during period Average monthly revenue per paying streaming membership % change as compared to prior-year period Constant currency % change as compared to prior-year period* 59,666 13 $13.22 $12.57 $13.08 $11.16 $11.45 $12.52 $11.18 $11.28 $11.04 $11.13 14 13% 17% 17% 12% 12% 4% 13% 13% 10% 12% 15 13% 17% 17% 13% 10% 12% 4% 13% 13% 12% 16 17 18 Europe, Middle East and Africa (EMEA) 1,562,561 $ 1,428,040 $ 5,543,067 2$ 1,319,087 $ 1,096,812 $ 3,963,707 $ 1,004,749 $ 1,233,379 975,497 $ 886,649 $ 19 Revenues 13,960 3,126 4,423 11,814 4,724 1,687 2,519 3,982 3,335 1,978 Paid net streaming membership additions Paid streaming memberships at end of period Average paid streaming memberships during period Average monthly revenue per paying streaming membership 51,778 51,778 44,229 47,355 37,818 42,542 31,317 33,836 37,818 29,339 21 44,731 $10.33 49,567 43,386 45,792 31,601 40,180 35,827 32,577 27,672 30,328 22 $10.13 $10.40 $10.51 $10.20 $10.45 $10.23 $10.28 $10.68 $10.72 23 -1% 1% 3% -6% 14% -4% 11% 3% 23% 25% % change as compared to prior-year period Constant currency % change as compared to prior-year period* 26 24 4% 6% 7% 3% 9% 2% 10% 6% 11% 11% 25 ge 27 Latin America (LATAM) 741.434 $ 567,137 677,136 $ 746,392 $ 2,795,434 2,237,697 $ 540,182 $ 630,472 $ 568,071 $ 562,307 $ 28 Revenues 5,340 2,037 1,962 6,360 343 1,490 1,543 1,470 1,535 1,320 Paid net streaming membership additions Paid streaming memberships at end of period Average paid streaming memberships during period Average monthly revenue per paying streaming membership % change as compared to prior-year period Constant currency % change as compared to prior-year period" 35 || 36 Asia-Pacific (APAC) 29 31,417 26,077 25,096 $7.53 -13% 27,890 29,380 31,417 26,077 27,547 21,260 22,795 24,115 30 28,391 22,767 $8.19 28,635 30,399 26,812 27,719 20,489 23,455 22,028 31 $8.18 $8.14 $8.63 $8.21 $7.84 $8.79 $8.60 $7.99 32 0% 8% 9% -5% 10% 18% -11% 18% -3% 33 13% 17% 18% 7% 12% 18% 13% 14% 6% 34 418,121 $ 1,469,521 276,756 $ 319,602 $ 349,494 $ 382,304 221,252 $ 945,816 $ 248,691 $ 199,117 $ 37 Revenues 5,626 1,748 1,543 801 1,146 4,106 1,534 1,089 978 Paid net streaming membership additions Paid streaming memberships at end of period Average paid streaming memberships during period Average monthly revenue per paying streaming membership 893 38 16,233 12,942 14,485 16,233 10,607 12,141 9,461 10,607 8,372 7,394 39 13,247 12,542 13,714 15,359 10,034 8,446 11,374 7,883 6,948 8,917 40 $9.07 $9.24 $9.29 $9.33 $9.29 $9.19 $9.37 $9.55 $9.30 $9.36 41 -1% 0% -1% -1% -2% 3% -4% 6% 8% 42 % change as compared to prior-year period 3% 3% 0% 3% 5% 2% 3% 43 Constant currency % change as compared to prior-year period* 44 (1) Excludes DVD revenues of $450 million, $366 million and $297 million for the yearsed December 31, 2017, 2018 and 2019 were $6.6 billion, $8.0 billion and $9.5 billion, respectively. * The company believes that constant currency information is useful in analyzing the the effect of foreign currency rate fluctuations in average monthly revenue per paying membership, the Company estimates the current period revenue assuming foreign exchange 45 n ovchane rateefrom thaerior AArnaind AR cator badromainadeonetantwith forsia Historical Segment Information Cashflow Regional Information Balance Sheet Income Statement ABCDE R T. 1 Netflix, Inc. 2 Streaming Revenue and Membership Information by Region 3 (unaudited) |(in thousands, except for average monthly revenue per paying membership and percentages) As of / Three Months Ended As of / Three Months Ended As of / Year Ended As of / Year Ended 6 March 31, December 31, December 31, March 31, December 31, June 30, September 30, June 30, September 30, December 31, 2018 2018 2018 2018 2018 2019 2019 2019 2019 2019 9 United States and Canada (UCAN) 10 Revenues (1) 1,976,157 $ 2,049,546 $ 2,256,851 $ 2,501,199 $ 2,094,850 $ 8,281,532 $ 2,621,250 $ 2,671,908 $ 10,051,208 2,160,979 11 1,140 Paid net streaming membership additions (losses) 1,876 (132) 2,487 961 1,747 6,335 613 548 2,905 12 Paid streaming memberships at end of period 63,010 64,757 64,757 66,501 67,662 60,909 61,870 66,633 67,114 67,662 66,808 $13.08 13 Average paid streaming memberships during period 59,666 61,390 63,884 61,845 67,388 66,615 62,440 65,695 66,567 $11.04 $11.28 $11.16 $12.52 $12.57 14 $11.13 $11.18 $11.45 $13.22 Average monthly revenue per paying streaming membership 15 % change as compared to prior-year period 12% 13% 13% 10% 12% 4% 12% 17% 17% 13% 16 13% Constant currency % change as compared to prior-year period* 12% 13% 13% 10% 12% 4% 13% 17% 17% 17 18 Europe, Middle East and Africa (EMEA) 19 Revenues 2$ 1,004,749 $ 1,096,812 $ 1,233,379 $ 2$ 1,562,561 $ 886,649 $ 975,497 $ 3,963,707 $ 1,319,087 1,428,040 $ 5,543,067 20 4,724 4,423 Paid net streaming membership additions 3,335 2,519 11,814 1,687 3.126 13,960 1,978 3,982 21 Paid streaming memberships at end of period 33,836 37,818 44,229 47,355 51,778 29,339 31,317 37,818 42,542 51,778 22 Average paid streaming memberships during period 27,672 30,328 32,577 35,827 31,601 40,180 43,386 45,792 49,567 44,731 $10.68 $10.72 23 $10.28 $10.20 $10.45 $10.23 $10.13 $10.40 $10.51 $10.33 Average monthly revenue per paying streaming membership 24 % change as compared to prior-year period Constant currency % change as compared to prior-year period* 25% 23% 11% 3% 14% -4% -6% 1% 3% -1% 25 11% 11% 10% 9% 2% 3% 6% 7% 4% 26 27 Latin America (LATAM) ge 540,182 $ 568,071 $ 567,137 $ 28 562,307 $ 2,237,697 $ 630,472 $ 677,136 $ 741,434 $ 746,392 $ Revenues 2,795,434 1,543 21,260 1,962 29 Paid net streaming membership additions 1,535 1,320 6,360 1,470 343 1,490 2,037 5,340 22,795 26,077 30 Paid streaming memberships at end of period 26,077 27,547 27,890 29,380 31,417 31,417 24,115 31 20,489 25,096 Average paid streaming memberships during period 23,455 27,719 22,028 22,767 26,812 28,635 30,399 28,391 $8,79 $8.19 $7.84 $8.14 $8.21 32 $8.60 10% 18% $7.99 $7.53 13% $8.63 $8.18 Average monthly revenue per paying streaming membership 18% 33 % change as compared to prior-year period -3% 1% -11% -5% 8% 9% 0% 18% 34 6% Constant currency % change as compared to prior-year period* 14% 13% 7% 12% 17% 18% 13% 35 36 Asia-Pacific (APAC) 37 276,756 $ 199,117 $ 221,252 $ 248,691 $ 945,816 $ 319,602 $ 349,494 $ 382,304 $ 418,121 1,469,521 Revenues 38 Paid net streaming membership additions 1,089 1,534 1,748 893 978 1,146 4,106 801 1,543 5,626 39 Paid streamingr perships at end of period 12,942 7,394 8,372 9,461 10,607 10,607 12,141 14,485 16,233 16,233 40 Average paid streaming memberships during period 10,034 12,542 15,359 6,948 7,883 8,917 8,446 11,374 13,714 13,247 41 $9.55 $9.36 $9.30 $9.19 $9.33 $9.37 $9.29 $9.29 $9.07 $9.24 Average monthly revenue per paying streaming membership Cashflow Historical Segment Information Regional Information Balance Sheet Income Statement +, ABCDE 1 Netflix, Inc. 2 Streaming Revenue and Membership Information by Region 3 (unaudited) (in thousands, except for average monthly revenue per paying membership and percentages) 4 As of / Year Ended As of / Year Ended As of / Three Months Ended As of / Three Months Ended September 30, December 31, December 31, December 31, March 31, December 31, June 30, March 31, June 30, September 30, 2019 2019 2019 2019 2019 2018 2018 2018 2018 2018 66,615 67,388 66,567 66,808 61,845 65,695 63,884 61,390 62,440 Average paid streaming memberships during period Average monthly revenue per paying streaming membership % change as compared to prior-year period Constant currency % change as compared to prior-year period* 59,666 13 $13.22 $12.57 $13.08 $11.16 $11.45 $12.52 $11.18 $11.28 $11.04 $11.13 14 13% 17% 17% 12% 12% 4% 13% 13% 10% 12% 15 13% 17% 17% 13% 10% 12% 4% 13% 13% 12% 16 17 18 Europe, Middle East and Africa (EMEA) 1,562,561 $ 1,428,040 $ 5,543,067 2$ 1,319,087 $ 1,096,812 $ 3,963,707 $ 1,004,749 $ 1,233,379 975,497 $ 886,649 $ 19 Revenues 13,960 3,126 4,423 11,814 4,724 1,687 2,519 3,982 3,335 1,978 Paid net streaming membership additions Paid streaming memberships at end of period Average paid streaming memberships during period Average monthly revenue per paying streaming membership 51,778 51,778 44,229 47,355 37,818 42,542 31,317 33,836 37,818 29,339 21 44,731 $10.33 49,567 43,386 45,792 31,601 40,180 35,827 32,577 27,672 30,328 22 $10.13 $10.40 $10.51 $10.20 $10.45 $10.23 $10.28 $10.68 $10.72 23 -1% 1% 3% -6% 14% -4% 11% 3% 23% 25% % change as compared to prior-year period Constant currency % change as compared to prior-year period* 26 24 4% 6% 7% 3% 9% 2% 10% 6% 11% 11% 25 ge 27 Latin America (LATAM) 741.434 $ 567,137 677,136 $ 746,392 $ 2,795,434 2,237,697 $ 540,182 $ 630,472 $ 568,071 $ 562,307 $ 28 Revenues 5,340 2,037 1,962 6,360 343 1,490 1,543 1,470 1,535 1,320 Paid net streaming membership additions Paid streaming memberships at end of period Average paid streaming memberships during period Average monthly revenue per paying streaming membership % change as compared to prior-year period Constant currency % change as compared to prior-year period" 35 || 36 Asia-Pacific (APAC) 29 31,417 26,077 25,096 $7.53 -13% 27,890 29,380 31,417 26,077 27,547 21,260 22,795 24,115 30 28,391 22,767 $8.19 28,635 30,399 26,812 27,719 20,489 23,455 22,028 31 $8.18 $8.14 $8.63 $8.21 $7.84 $8.79 $8.60 $7.99 32 0% 8% 9% -5% 10% 18% -11% 18% -3% 33 13% 17% 18% 7% 12% 18% 13% 14% 6% 34 418,121 $ 1,469,521 276,756 $ 319,602 $ 349,494 $ 382,304 221,252 $ 945,816 $ 248,691 $ 199,117 $ 37 Revenues 5,626 1,748 1,543 801 1,146 4,106 1,534 1,089 978 Paid net streaming membership additions Paid streaming memberships at end of period Average paid streaming memberships during period Average monthly revenue per paying streaming membership 893 38 16,233 12,942 14,485 16,233 10,607 12,141 9,461 10,607 8,372 7,394 39 13,247 12,542 13,714 15,359 10,034 8,446 11,374 7,883 6,948 8,917 40 $9.07 $9.24 $9.29 $9.33 $9.29 $9.19 $9.37 $9.55 $9.30 $9.36 41 -1% 0% -1% -1% -2% 3% -4% 6% 8% 42 % change as compared to prior-year period 3% 3% 0% 3% 5% 2% 3% 43 Constant currency % change as compared to prior-year period* 44 (1) Excludes DVD revenues of $450 million, $366 million and $297 million for the yearsed December 31, 2017, 2018 and 2019 were $6.6 billion, $8.0 billion and $9.5 billion, respectively. * The company believes that constant currency information is useful in analyzing the the effect of foreign currency rate fluctuations in average monthly revenue per paying membership, the Company estimates the current period revenue assuming foreign exchange 45 n ovchane rateefrom thaerior AArnaind AR cator badromainadeonetantwith forsia Historical Segment Information Cashflow Regional Information Balance Sheet Income Statement ABCDE R T. 1 Netflix, Inc. 2 Streaming Revenue and Membership Information by Region 3 (unaudited) |(in thousands, except for average monthly revenue per paying membership and percentages) As of / Three Months Ended As of / Three Months Ended As of / Year Ended As of / Year Ended 6 March 31, December 31, December 31, March 31, December 31, June 30, September 30, June 30, September 30, December 31, 2018 2018 2018 2018 2018 2019 2019 2019 2019 2019 9 United States and Canada (UCAN) 10 Revenues (1) 1,976,157 $ 2,049,546 $ 2,256,851 $ 2,501,199 $ 2,094,850 $ 8,281,532 $ 2,621,250 $ 2,671,908 $ 10,051,208 2,160,979 11 1,140 Paid net streaming membership additions (losses) 1,876 (132) 2,487 961 1,747 6,335 613 548 2,905 12 Paid streaming memberships at end of period 63,010 64,757 64,757 66,501 67,662 60,909 61,870 66,633 67,114 67,662 66,808 $13.08 13 Average paid streaming memberships during period 59,666 61,390 63,884 61,845 67,388 66,615 62,440 65,695 66,567 $11.04 $11.28 $11.16 $12.52 $12.57 14 $11.13 $11.18 $11.45 $13.22 Average monthly revenue per paying streaming membership 15 % change as compared to prior-year period 12% 13% 13% 10% 12% 4% 12% 17% 17% 13% 16 13% Constant currency % change as compared to prior-year period* 12% 13% 13% 10% 12% 4% 13% 17% 17% 17 18 Europe, Middle East and Africa (EMEA) 19 Revenues 2$ 1,004,749 $ 1,096,812 $ 1,233,379 $ 2$ 1,562,561 $ 886,649 $ 975,497 $ 3,963,707 $ 1,319,087 1,428,040 $ 5,543,067 20 4,724 4,423 Paid net streaming membership additions 3,335 2,519 11,814 1,687 3.126 13,960 1,978 3,982 21 Paid streaming memberships at end of period 33,836 37,818 44,229 47,355 51,778 29,339 31,317 37,818 42,542 51,778 22 Average paid streaming memberships during period 27,672 30,328 32,577 35,827 31,601 40,180 43,386 45,792 49,567 44,731 $10.68 $10.72 23 $10.28 $10.20 $10.45 $10.23 $10.13 $10.40 $10.51 $10.33 Average monthly revenue per paying streaming membership 24 % change as compared to prior-year period Constant currency % change as compared to prior-year period* 25% 23% 11% 3% 14% -4% -6% 1% 3% -1% 25 11% 11% 10% 9% 2% 3% 6% 7% 4% 26 27 Latin America (LATAM) ge 540,182 $ 568,071 $ 567,137 $ 28 562,307 $ 2,237,697 $ 630,472 $ 677,136 $ 741,434 $ 746,392 $ Revenues 2,795,434 1,543 21,260 1,962 29 Paid net streaming membership additions 1,535 1,320 6,360 1,470 343 1,490 2,037 5,340 22,795 26,077 30 Paid streaming memberships at end of period 26,077 27,547 27,890 29,380 31,417 31,417 24,115 31 20,489 25,096 Average paid streaming memberships during period 23,455 27,719 22,028 22,767 26,812 28,635 30,399 28,391 $8,79 $8.19 $7.84 $8.14 $8.21 32 $8.60 10% 18% $7.99 $7.53 13% $8.63 $8.18 Average monthly revenue per paying streaming membership 18% 33 % change as compared to prior-year period -3% 1% -11% -5% 8% 9% 0% 18% 34 6% Constant currency % change as compared to prior-year period* 14% 13% 7% 12% 17% 18% 13% 35 36 Asia-Pacific (APAC) 37 276,756 $ 199,117 $ 221,252 $ 248,691 $ 945,816 $ 319,602 $ 349,494 $ 382,304 $ 418,121 1,469,521 Revenues 38 Paid net streaming membership additions 1,089 1,534 1,748 893 978 1,146 4,106 801 1,543 5,626 39 Paid streamingr perships at end of period 12,942 7,394 8,372 9,461 10,607 10,607 12,141 14,485 16,233 16,233 40 Average paid streaming memberships during period 10,034 12,542 15,359 6,948 7,883 8,917 8,446 11,374 13,714 13,247 41 $9.55 $9.36 $9.30 $9.19 $9.33 $9.37 $9.29 $9.29 $9.07 $9.24 Average monthly revenue per paying streaming membership Cashflow Historical Segment Information Regional Information Balance Sheet Income Statement +