Answered step by step
Verified Expert Solution
Link Copied!

Question

1 Approved Answer

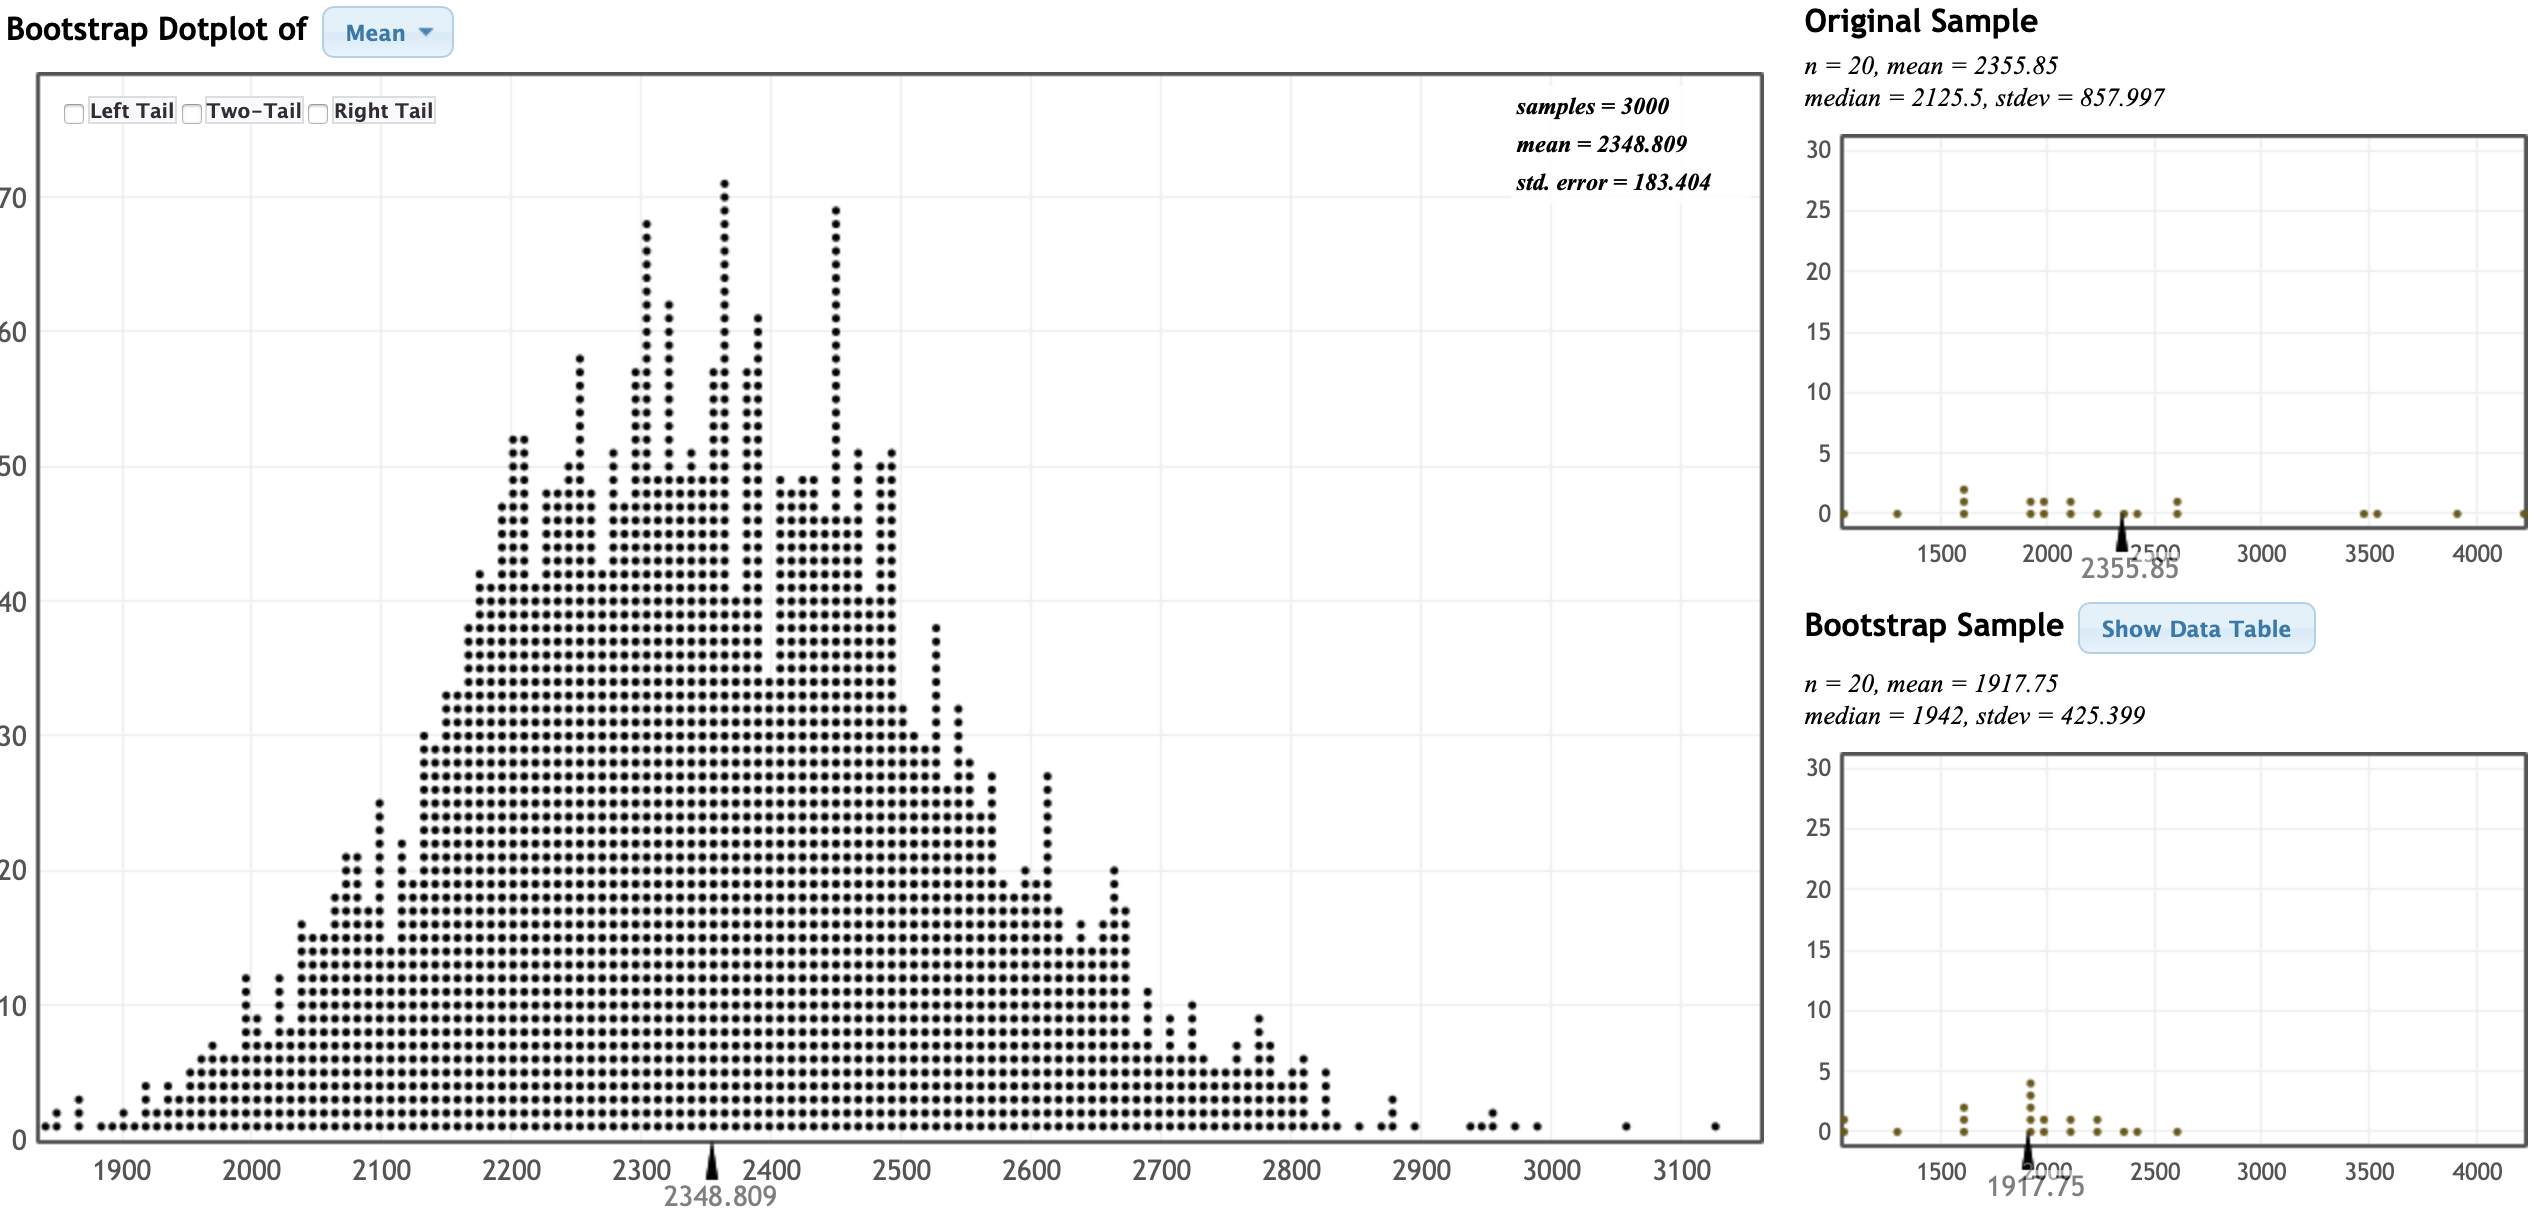
I forgot how to do this one and I hope the graphs help Correlation between Price and Depreciation in Automobiles The data in CarDepreciation contains

I forgot how to do this one and I hope the graphs help
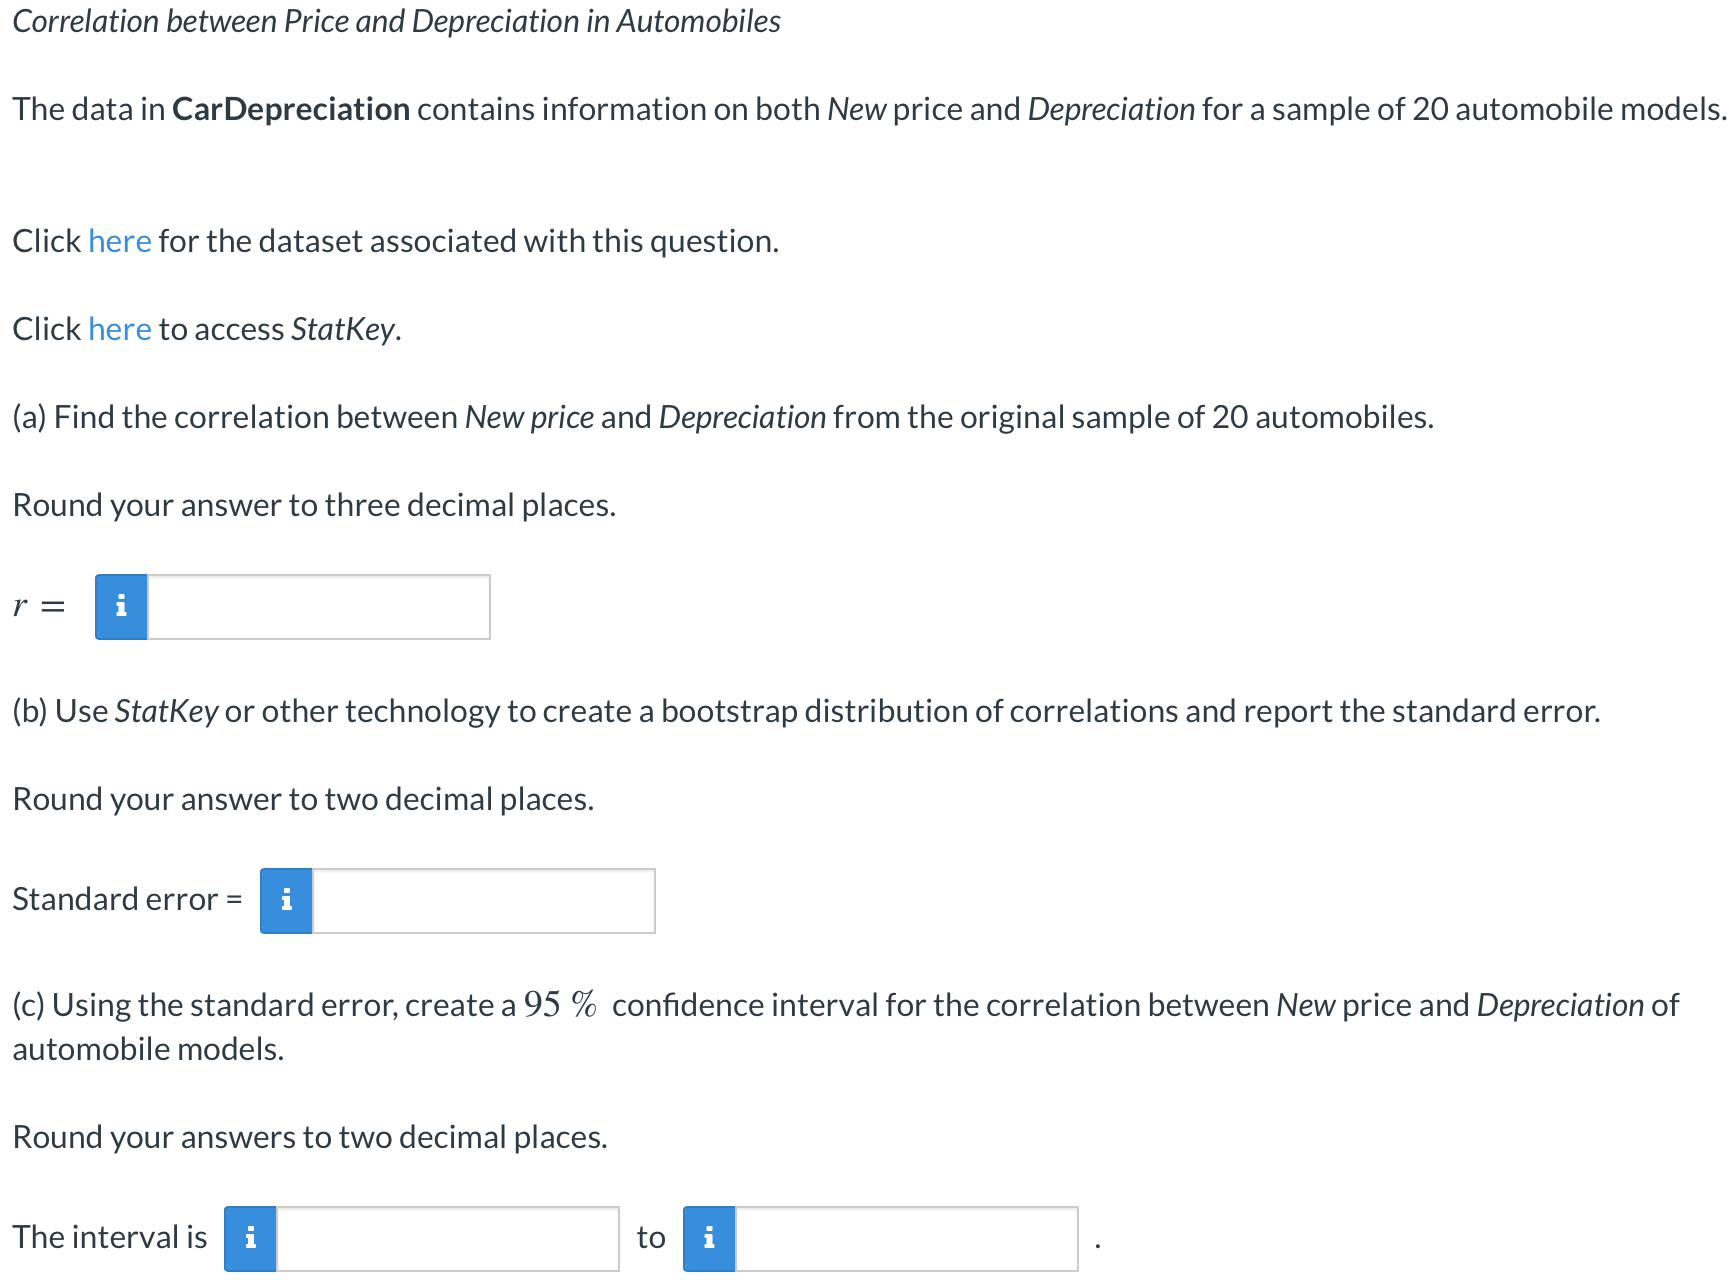
image text in transcribedimage text in transcribedimage text in transcribed
Correlation between Price and Depreciation in Automobiles The data in CarDepreciation contains information on both New price and Depreciation for a sample of 20 automobile models. Click here for the dataset associated with this question. Click here to access StatKey. (a) Find the correlation between New price and Depreciation from the original sample of 20 automobiles. Round your answer to three decimal places. \"I (b) Use StatKey or other technology to create a bootstrap distribution of correlations and report the standard error. Round your answer to two decimal places. Standard error = n (c) Using the standard error, create a 95 % condence interval for the correlation between New price and Depreciation of automobile models. Round your answers to two decimal places. The interval is n to n Bootstrap Dotplot of Mean Original Sample n = 20, mean = 2355.85 Left Tail Two-Tail Right Tail samples = 3000 median = 2125.5, stdev = 857.997 mean = 2348.809 30 70 std. error = 183.404 25 20 . . . . . ............... 60 15 ...................... . . . . . . . . .. .. .......... 10 . . . ..... 50 5 .. . 8: 1500 2000 , 3000 3500 4000 40 2355.85 Bootstrap Sample Show Data Table ......... n = 20, mean = 1917.75 30 median = 1942, stdev = 425.399 ... ... 30 ...... .. . . ..... 25 ........ 20 20 15 10 10 5 ... . . .... 0 . . . 0 1900 2000 2100 2200 2300 2400 2500 2600 2700 2800 2900 3000 3100 2348.809 1500 000 1917.75 2500 3000 3500 4000Bootstrap Dotplot of Mean Original Sample n = 20, mean = 2355.85 Left Tail Two-Tail Right Tail samples = 0 median = 2125.5, stdev = 857.997 mean = NaN 30 70 std. error = NaN 25 20 60 15 10 50 5 .. . 8: 1500 2000, 2355.85 3000 3500 4000 40 Bootstrap Sample Show Data Table 1.00 30 0.75 20 0.50 0.25 10 0.00 1500 2000 2500 3000 3500 4000 0 1900 2000 2100 2200 2300 2400 2500 2600 2700 2800 2900

Step by Step Solution

There are 3 Steps involved in it

Step: 1

blur-text-image

Get Instant Access to Expert-Tailored Solutions

See step-by-step solutions with expert insights and AI powered tools for academic success

Step: 2

blur-text-image

Step: 3

blur-text-image

Ace Your Homework with AI

Get the answers you need in no time with our AI-driven, step-by-step assistance

Get Started

Recommended Textbook for

Advanced Engineering Mathematics

Authors: ERWIN KREYSZIG

9th Edition

0471488852, 978-0471488859

More Books

Students also viewed these Mathematics questions