

Answered step by step
Verified Expert Solution
Question
1 Approved Answer
I got most of the question already I still need to figure out the Fcaculated, Ftable, Tcaculated, and Ttable DNA concentration. The nucleotide bases of
I got most of the question already I still need to figure out the Fcaculated, Ftable, Tcaculated, and Ttable
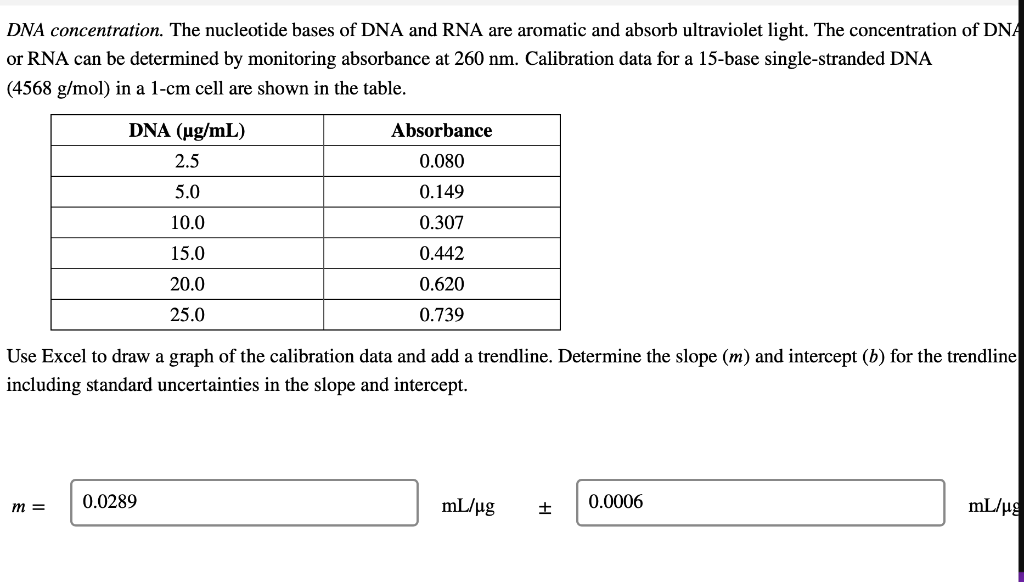
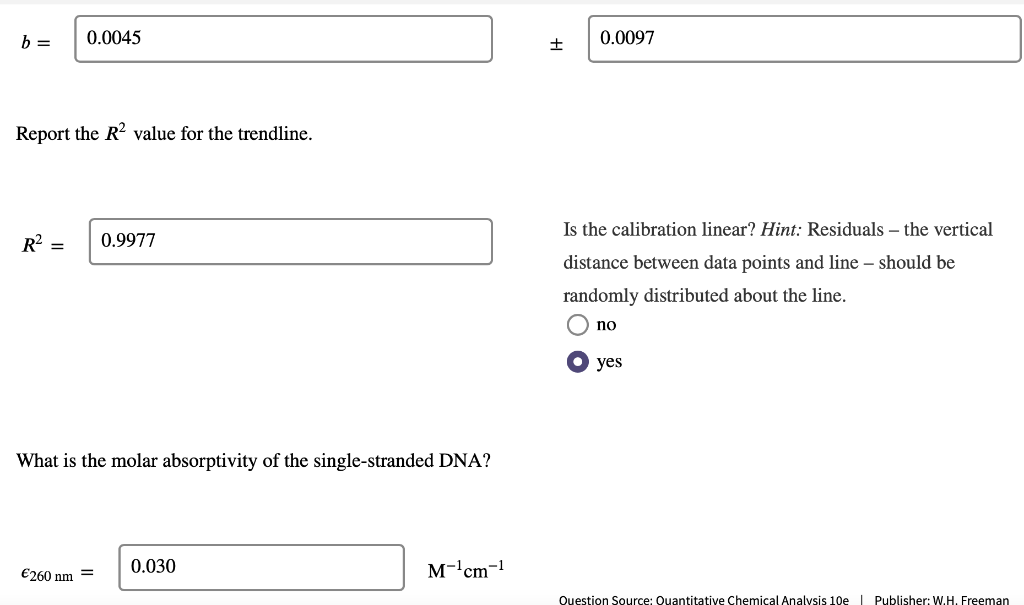
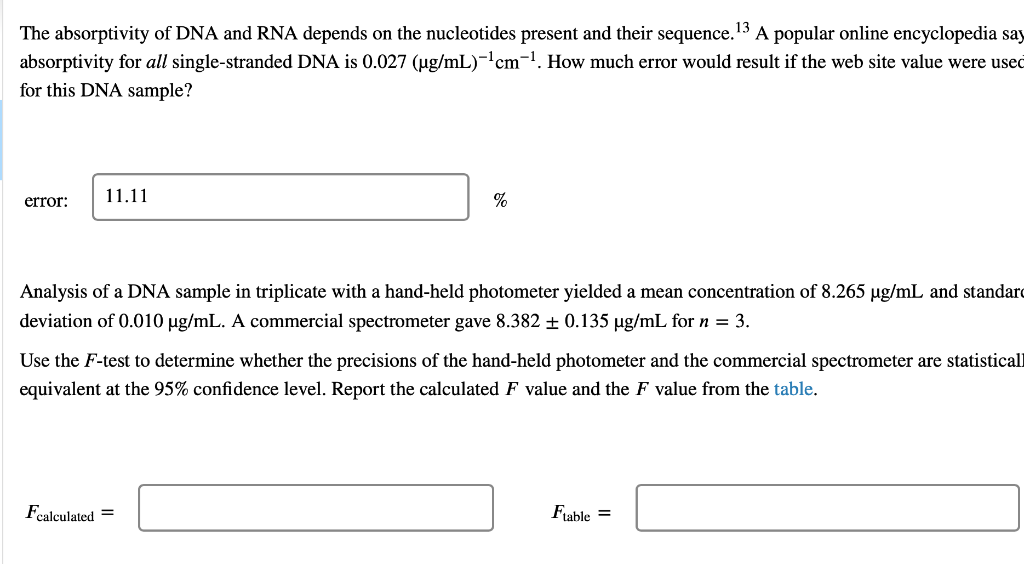
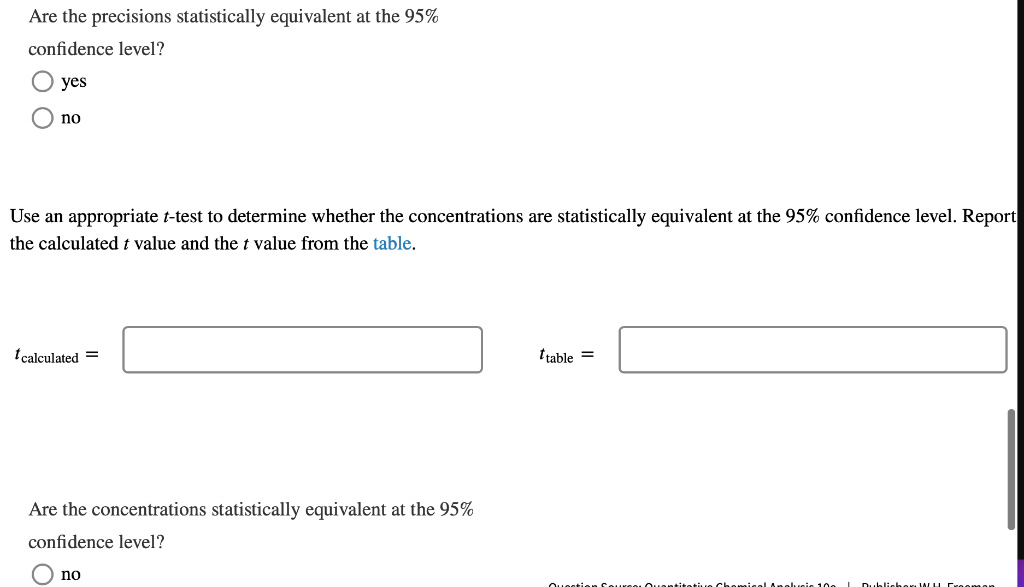
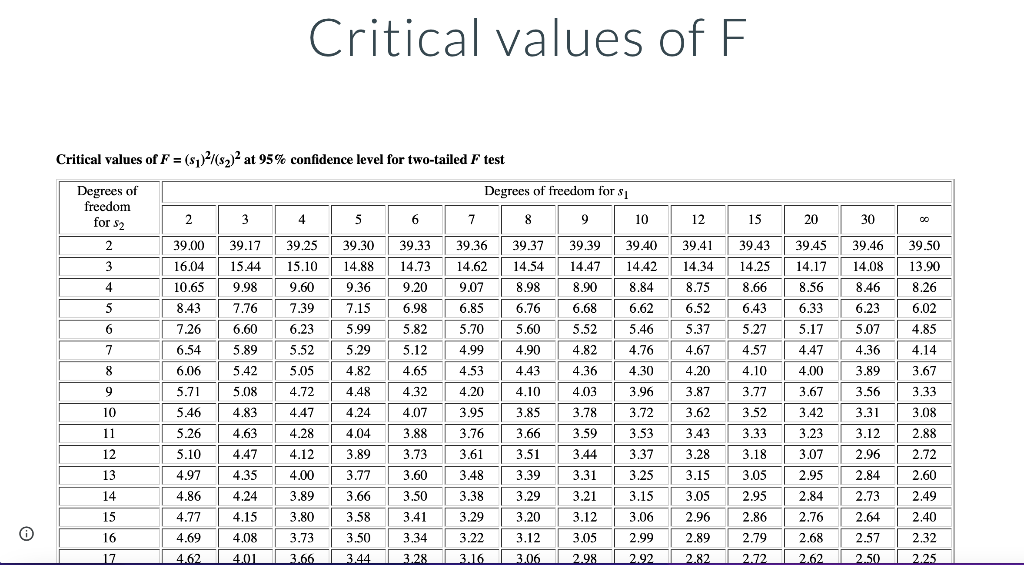
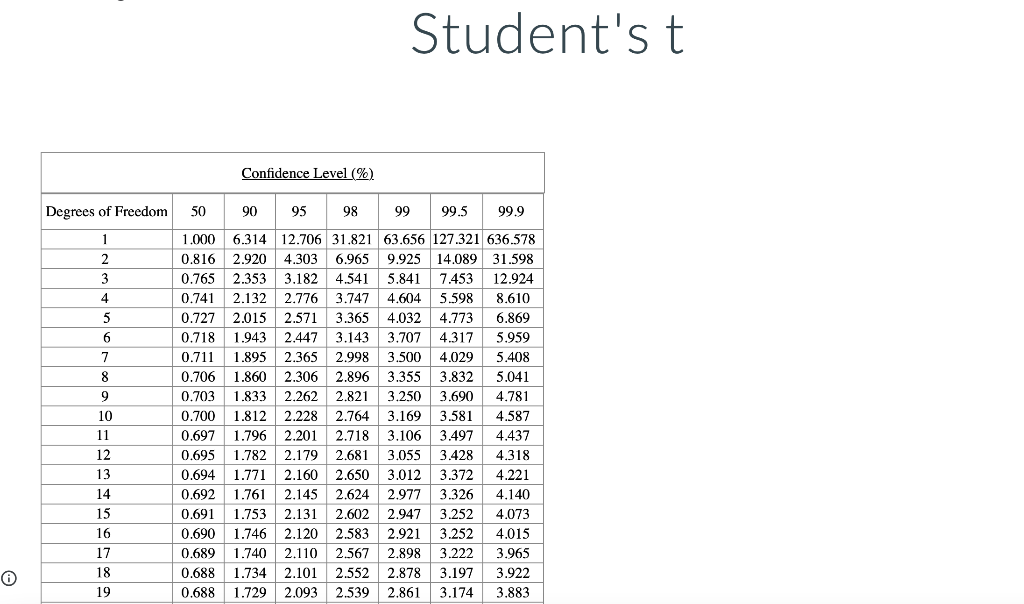
DNA concentration. The nucleotide bases of DNA and RNA are aromatic and absorb ultraviolet light. The concentration of DNA or RNA can be determined by monitoring absorbance at 260 nm. Calibration data for a 15-base single-stranded DNA (4568 g/mol) in a 1-cm cell are shown in the table. DNA (ug/mL) Absorbance 0.080 2.5 5.0 0.149 10.0 0.307 15.0 0.442 20.0 0.620 0.739 25.0 Use Excel to draw a graph of the calibration data and add a trendline. Determine the slope (m) and intercept (b) for the trendline including standard uncertainties in the slope and intercept. m = 0.0289 mL/ug + 0.0006 mL/ug b= 0.0045 0.0097 It Report the R2 value for the trendline. Is the calibration linear? Hint: Residuals - the vertical R2 = 0.9977 distance between data points and line - should be randomly distributed about the line. no yes What is the molar absorptivity of the single-stranded DNA? 0.030 260 nm = M-'cm-1 Question Source: Ouantitative Chemical Analysis 10e | Publisher: W.H. Freeman The absorptivity of DNA and RNA depends on the nucleotides present and their sequence. 13 A popular online encyclopedia say absorptivity for all single-stranded DNA is 0.027 (ug/mL)-cm-7. How much error would result if the web site value were used for this DNA sample? 11.11 error: % Analysis of a DNA sample in triplicate with a hand-held photometer yielded a mean concentration of 8.265 ug/mL and standar deviation of 0.010 ug/mL. A commercial spectrometer gave 8.382 +0.135 ug/mL for n = 3. Use the F-test to determine whether the precisions of the hand-held photometer and the commercial spectrometer are statistical equivalent at the 95% confidence level. Report the calculated F value and the F value from the table. Fcalculated = Ftable = Are the precisions statistically equivalent at the 95% confidence level? yes no Use an appropriate t-test to determine whether the concentrations are statistically equivalent at the 95% confidence level. Report the calculated t value and the t value from the table. I calculated = Itable = Are the concentrations statistically equivalent at the 95% confidence level? no Critical values of F Critical values of F = (sy)/(82) at 95% confidence level for two-tailed F test Degrees of freedom Degrees of freedom for si for 52 2 3 4 5 6 7 8 9 10 12 15 20 30 00 2 39.17 39.30 39.37 39.40 39.43 39.39 14.47 39.46 14.08 3 15.44 14.25 4 8.90 39.00 16.04 10.65 8.43 7.26 6.54 39.25 15.10 9.60 7.39 6.23 8.66 9.98 7.76 6.60 14.88 9.36 7.15 5.99 39.33 14.73 9.20 6.98 5.82 5.12 39.36 14.62 9.07 6.85 5.70 4.99 4.53 4.20 39.41 14.34 8.75 6.52 5.37 14.42 8.84 6.62 5.46 8.46 6.23 39.45 14.17 8.56 6.33 5.17 4.47 14.54 8.98 6.76 5.60 4.90 4.43 4.10 5 39.50 13.90 8.26 6.02 4.85 6.68 5.52 6 5.07 7 5.29 4.82 4.76 4.67 4.36 6.43 5.27 4.57 4.10 3.77 5.52 5.05 4.14 8 4.82 4.36 4.20 4.00 3.89 5.89 5.42 5.08 4.83 6.06 5.71 4.65 4.32 9 4.72 4.48 4.03 3.87 3.67 3.56 3.31 10 4.47 4.07 3.85 3.78 3.62 3.42 5.46 5.26 4.24 4.04 3.52 3.33 11 4.63 4.28 4.12 3.88 3.73 3.59 3.44 12 3.89 4.30 3.96 3.72 3.53 3.37 3.25 3.15 3.06 3.43 3.28 3.15 3.23 3.07 2.95 3.18 3.05 13 3.60 3.67 3.33 3.08 2.88 2.72 2.60 2.49 2.40 3.95 3.76 3.61 3.48 3.38 3.29 3.22 3.66 3.51 3.39 3.29 3.20 5.10 4.97 4.86 4.77 4.69 4.47 4.35 4.24 4.15 4,08 3.31 www. 14 4.00 3.89 3.80 TITIT 3.77 3.66 3.58 LLLLLLL www. TTTTT 3.12 2.96 2.84 2.73 2.64 3.50 3.41 3.34 3.21 3.12 UU . 3.05 2.96 2.95 2.86 2.84 2.76 15 | TI 0 16 3.73 3.12 3.05 2.99 2.68 2.32 3.50 3.44 2.89 2.82 2.79 2.72 2.57 2.50 17 4.62 401 3.66 T 3.28 3.16 3.06 2.98 2.92 2.62 2.25 Student'st Confidence Level (%) Degrees of Freedom 50 90 95 98 99 99.5 99.9 1 2 3 3 4 5 6 7 8 9 10 11 12 13 14 15 1.000 6.314 12.706 31.821 63.656 127.321 636.578 0.816 2.920 4.303 6.965 9.925 14.089 31.598 0.765 2.353 3.182 4.541 5.841 7.453 12.924 0.741 2.132 2.776 3.747 4.604 5.598 8.610 0.727 2.015 2.571 3.365 4.032 4.773 6.869 0.718 1.943 2.447 3.143 3.707 4.317 5.959 0.711 1.895 2.365 2.998 3.500 4.029 5.408 0.706 1.860 2.306 2.896 3.355 3.832 5.041 0.703 1.833 2.262 2.821 3.250 3.690 4.781 0.700 1.812 2.228 2.764 3.169 3.581 4.587 0.697 1.796 2.201 2.718 3.106 3.497 4.437 0.695 1.782 2.179 2.681 3.055 3.428 4.318 0.694 1.771 2.160 2.650 3.012 3.372 4.221 0.692 1.761 1.761 2.145 2.624 2.977 3.326 4.140 0.691 1.753 2.131 2.602 2.947 3.252 4.073 0.690 1.746 2.120 2.583 2.921 3.252 4.015 0.689 1.740 2.110 2.567 2.898 3.222 3.965 0.688 1.734 2.101 2.552 2.878 3.197 3.922 0.688 1.729 2.093 2.539 2.861 3.174 3.883 16 17 18 19Step by Step Solution
There are 3 Steps involved in it
Step: 1

Get Instant Access to Expert-Tailored Solutions
See step-by-step solutions with expert insights and AI powered tools for academic success
Step: 2

Step: 3
Ace Your Homework with AI
Get the answers you need in no time with our AI-driven, step-by-step assistance
Get Started
Transport Processes And Separation Process Principles
Authors: Christie Geankoplis, Allen Hersel, Daniel Lepek
5th Edition
0134181026, 978-0134181028