i have 9 questions that are already were answered i just want to understand how each question were answered like do simple steps just to let me understand. thanks
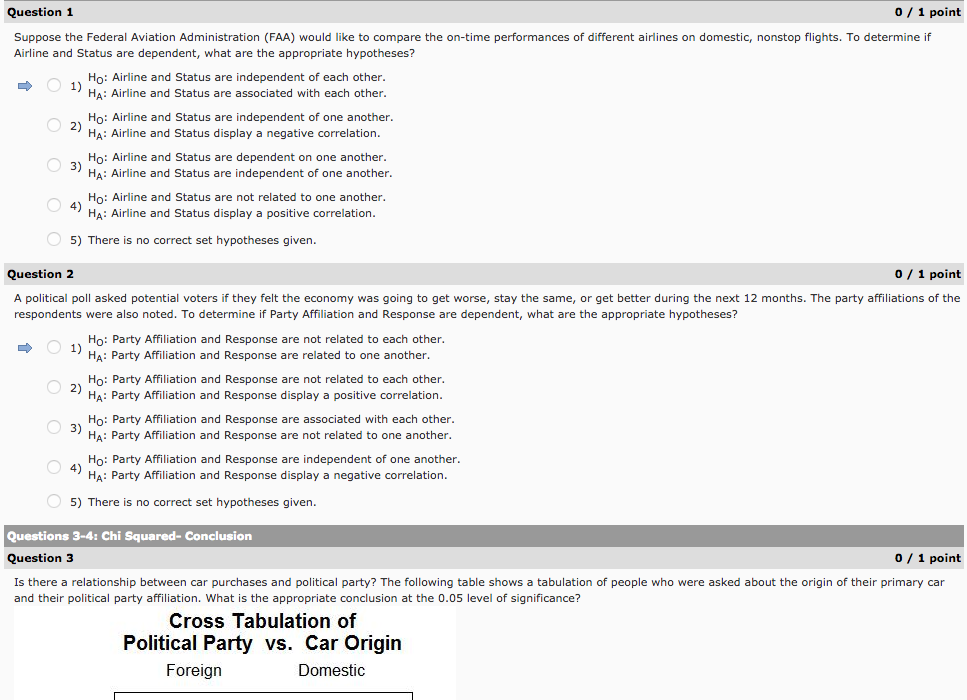
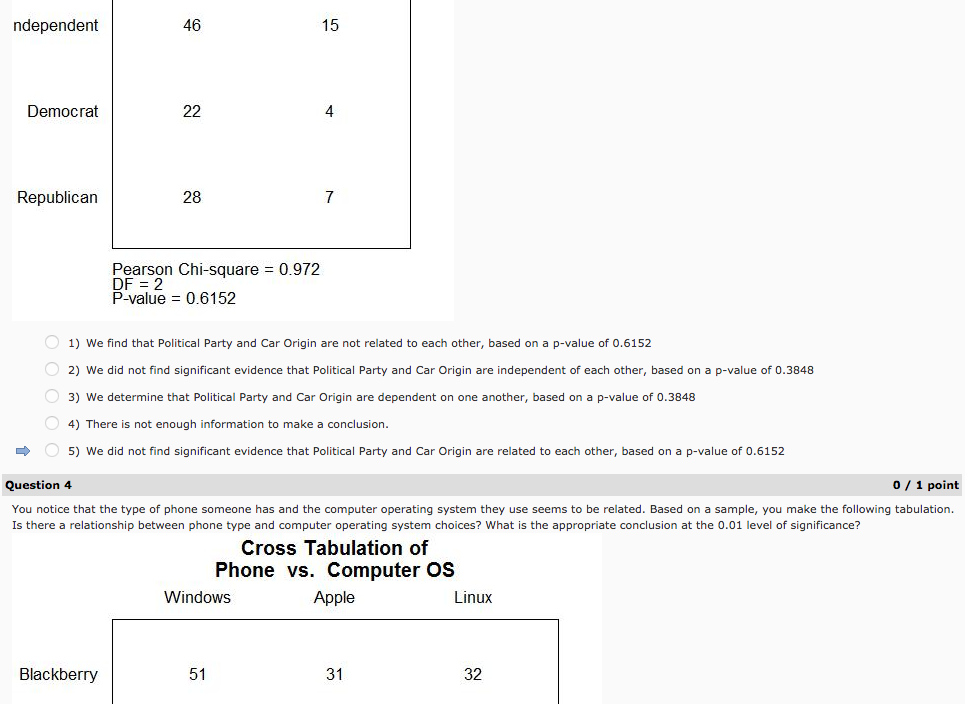
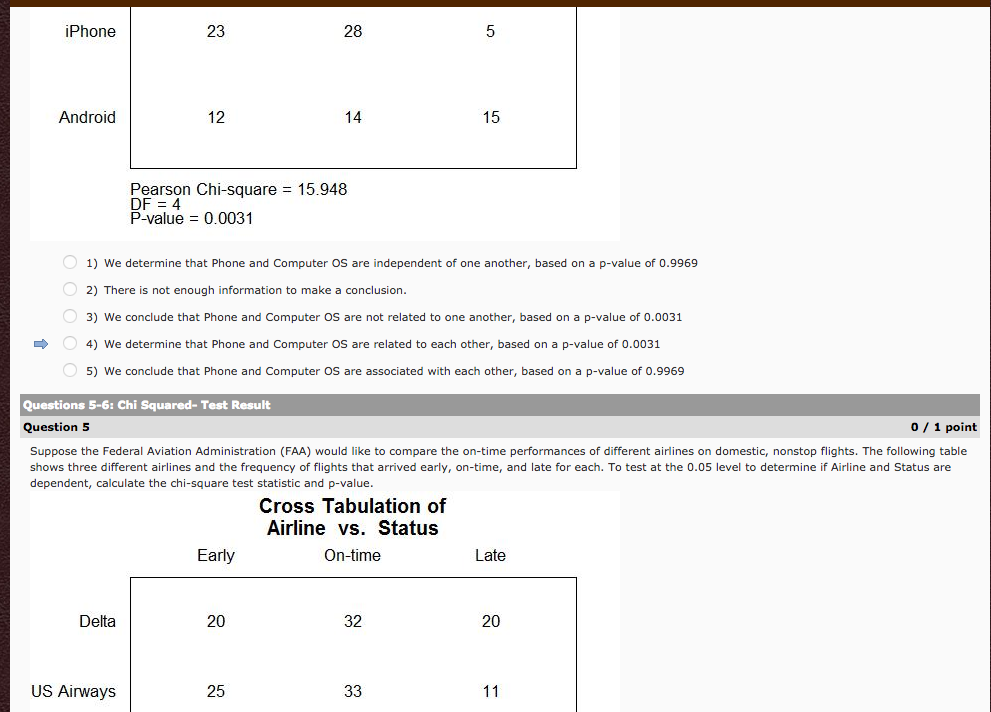
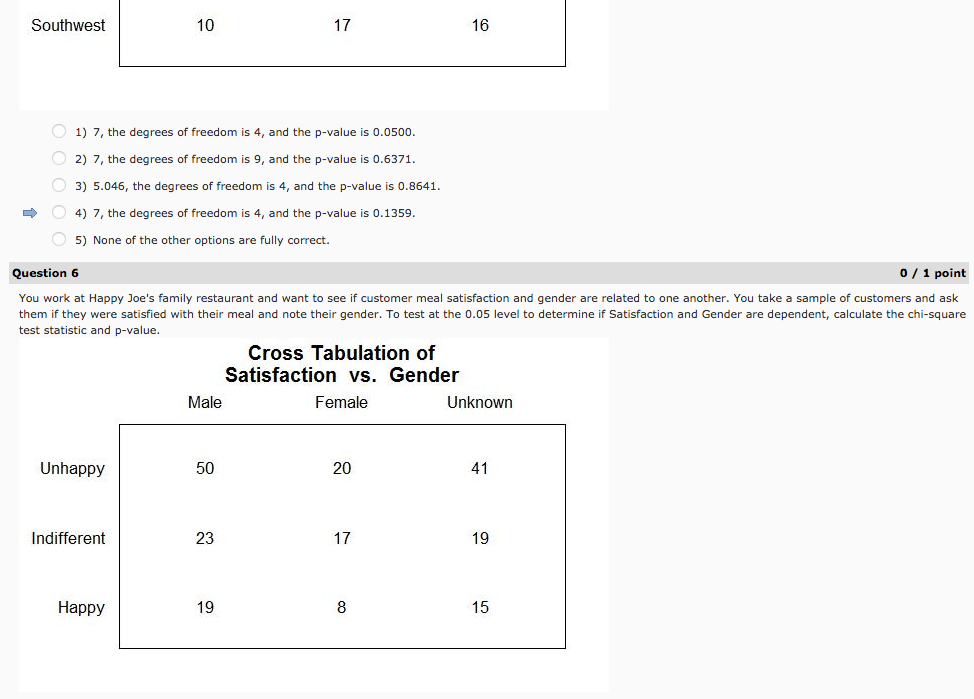
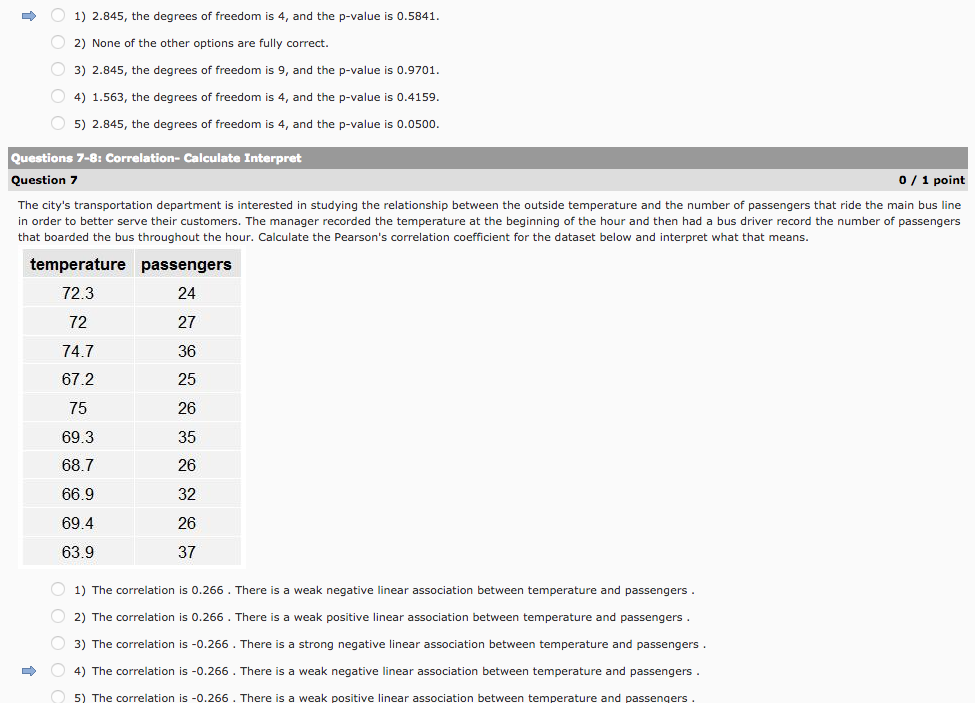
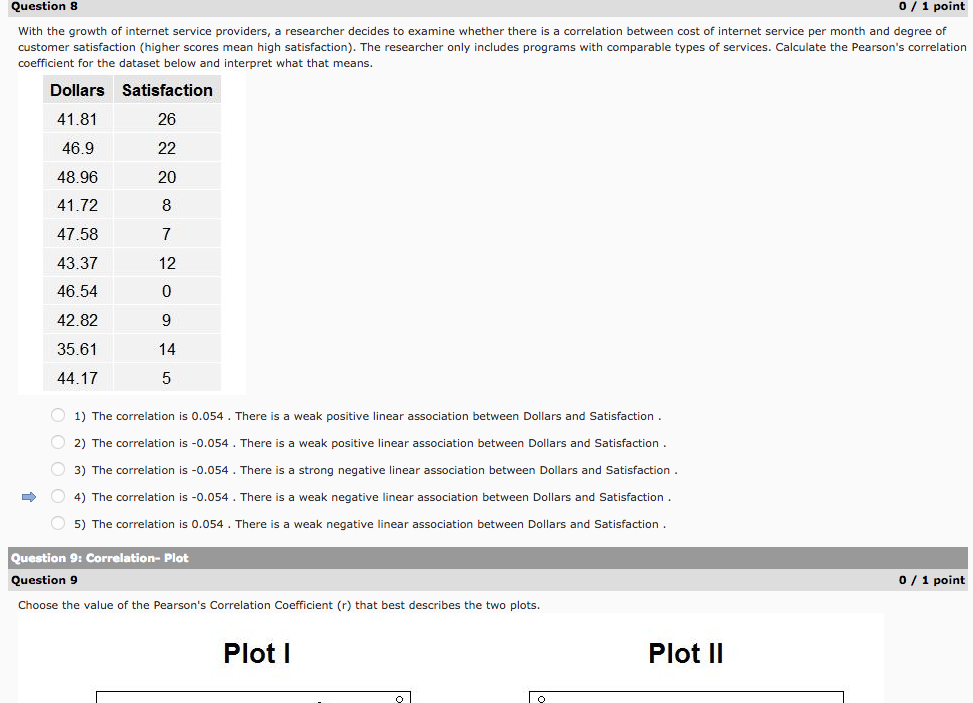
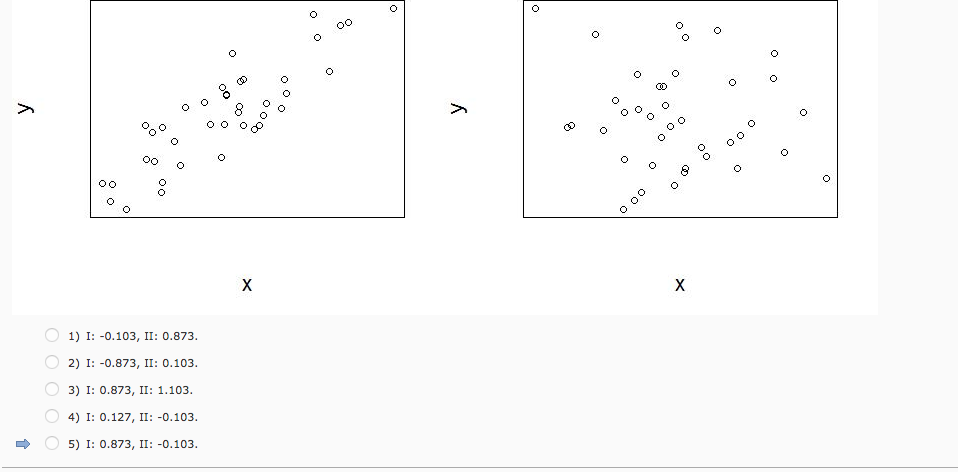
Quiltfnn 1 II I I. point Suppose the Federal Aviation Administration (FAA) would like to compare the ontime performances of different airlines on domestic, nonstop ights. To determine if Airline and Status are dependent, what are the appropriate hypotheses? Ho: Airline and Status are independent ofeach other. HA: Airline and Status are associated with each other. 'n H0: Airline and Status are independent of one another. 2) HA: Airline and Status display a negative correlation. H0: Airline and Status are dependent on one another. 3) Ha: Airline and Status are independent ofone another. Ho: Airline and Status are not related to one another. 4) HA: Airline and Status display a positive correlation. 5) There is no correct set hvpothmes given. Question 1 II 1 I. point A political poll asked potential voters if they felt the economy was going to get worse, stay the same, or get hatter during the next 12 months. The party afliations of the respondents were also noted. To determine if PartwI Afliation and Response are dependent, what are the appropriate hypotheses? Ho: Party Affiliation and Response are not related to each other. ' 1) HA: Party Affiliation and Response are related to one another. H0: Party Affiliation and Response are not related to each other. 2) Ha: Party Affiliation and Response display a positive correlation. Ho: Party Affiliation and Response are associated with each other. 3) Ha: Party Affiliation and Response are not related to one another. Ho: Party Affiliation and Response are independent ofone another. 4) HA: Party Affiliation and Response display a negative correlation. 5) There is no correct set hypotheses given. Question 3 II 1 I. point Is there a relationship between car purchases and political party? The following table shows a tabulation of people who were asked about the origin of their prir'nar'iI car and their political party:r aliation. Ill'll'hat is the appropriate conclusion at the (ME level of significance? Cross Tabulation of Political Party vs. Car Origin Foreign Domestic ndependent 46 1 5 Democrat 22 4 Republican 28 Y Egarsgn Chisquare = 0.972 Pwue = 0.6152 1) We nd that Potitical Part5:I and Car Origin are not related to each other, based on a p-value of 0.6152 2) We did not find signicant evidence that Political Part3:I and Car Origin are independent ofeach otherr based on a pvaEue of 0.3545 3) We determine that Political Party and Car Origin are dependent on one another, based on a pvalue o'FU.3848 4) There is not enough information to make a conclusion. ' 5) We did not nd significant evidence that Political PartyI and Car Origin are related to each other, based on a pvalue of 0.6152 QuII-on 4 II ,9 1 point You notioe that the type of phone someone has and the computer operating system they use seems to be related. Based on a sample. you make the following tabulation. Is there a relationship between phone type and computer operating system choices? What is the appropriate conclusion at the 0.01 levei of signicance? Cross Tabulation of Phone vs. Computer OS Windows Apple Linux Blackberry 51 31 32 iPhone 23 28 5 Android 12 14 15 Bloarsgn Chisquare = 15.948 Pvaue = 0.0031 1) We determine that Phone and Computer OS are independent of one another, based on a pvaloe of 0.9959 2) There is not enough information to make a conclusion. 3) We conclude that Phone and Computer 05 are not related to one another, based on a pvalue ofOJDUBl # 4) We determine that Phone and Computer OS are related to each other, based on a pvalue ofD.0031 5) We conclude that Phone and Computer 05 are associated with each other, based on a pvalue of 0.9969 Questions 5-5: Chi Squared-1 Test Result Question 5 II I I. point Suppose the Federal Aviation Administration (FAA) would like to oompare the ontime performances of different airlines on domestic, nonstop ights. The following table shows three different airlines and the freq uenmI of ights that arrived early, ontjme, and late for each. To test at the 0.05 level to determine if Airline and Status are dependent, calculate the chi-square test statistic and p-value. Cross Tabulation of Airline vs. Status Early Onlime Late Della 2D 32 20 US Airways 25 33 11 Southwest 10 1? 16 1) I", the degrees of freedom is 4, and the pvalue is 0.0500. 2) 7". the degrees of freedom is 9. and the p-value is 0.6311. 3) 5.046, the degrees of freedom is 4, and the pvalue is 0.3641. ' 4) Z the degrees of freedom is 4, and the pvalue is 0.1359. 5) None of the other options are fullyI correct. Question 6 II I I. point You work at Happy:r Joe's family restaurant and want to see if customer meal satisfaction and gender are related to one another. You take a sample ofoustorners and ask them if they were satised with their meal and note their gender. To test at the 0.05 level to determine if Satisfaction and Gender are dependent, calculate the chi-square test statistic and p-value. Cross Tabulation of Satisfaction vs. Gender Male Female Unknown Unhappy 50 20 41 Indifferent 23 1? 19 Happy 19 8 15 - 1) 2.545, the degrees of freedom is 4, and the pvalue is 0.5541. 2) None of the other options are fullyI correct. 3) 2.545, the degrees of freedom is 9. and the p-value is 0.9701. 4) 1.563, the degrees of freedom is 4. and the p-value is 0.4159. 5) 2.545, the degrees of freedom is 4. and the pvalue is 0.0500. Questions Ll: crllticn- Ellcullh Inter-put Question 7 II I I. point The city's transportation department is interested in studying the relationship between the outside temperature and the number of passengers that ride the main bus line in order to better serve their customers. The manager recorded the temperature at the beginning of the hour and then had a bus driver record the number of passengers that boarded the bus throughout the hour. Calculate the Pearson's correlation coefcient for the dataset below and interpret what that means. temperature passengers 72.3 24 72 27 74.7 36 67.2 25 75 26 69.3 35 68.7 26 66.9 32 69.4 26 63.9 37 1) The correlation is 0.266 . There is a weak negative linear association between temperature and passengers . 2) The correlation is [3.266 . There is a weak positive linear association between temperature and passengers . 3) The correlation is -l3.266 . There is a strong negative linear association between temperature and passengers . - 4) The correlation is l3.266 . There is a weak negative linear association between temperature and passengers . 5'] The correlation is I3.266 . There is a weak positive linear association between temperature and Dassenoers . Quin-lm 8 Gilli-aim: With the growth of internet service providers, a researcher decides to examine whether there is a correlation between cost of intemet service per month and degree of customer satisfaction (higher scores mean high satisfaction). The researcher only includes programs with comparable types of services. Calculate the Pearson's oorrelation coefcient for the dataset below and interpret what that mea ns. Dollars Sasfacon 41 .81 443.53!I 48.96 41 .72 47.58 43.37 46.54 42.82 35.61 44.17 26 22 2D 14 5 1) The oorrelation is 0.854 . There is a weak positive linear association between Dollars and Satisfaction . 2) The correlation is {3.854 A There is a weak positive linear association between Dollars and Satisfaction . 3) The oorrelation is 43.054 . There is a strong negative linear association between Dollars and Satisfaction . I 4) The oorrelation is 41054 1 There is a weak negative linear association between Dollars and Satisfaction . 5) The oorrelation is 0.854 . There is a weak negative linear association between Dollars and Satisfaction . Question Q: Carrol-tinn- Plot Qullon i flpoinl: Choose the value of the Pearson's Correlation Coefficient (r) that best describes the two plots. Plot | Plot N \f