

Answered step by step
Verified Expert Solution
Question
1 Approved Answer
I have a buisness plan that is due tomorow i need help figuring out the finacials because they're coming out negative in my net income.
I have a buisness plan that is due tomorow i need help figuring out the finacials because they're coming out negative in my net income. Down below i uploaded the first four finacials of my buisness so if theres inputs thats wrong please let me know wnd correct it if possible. I really need help figuring out the finacial portion of my buisness plan!!
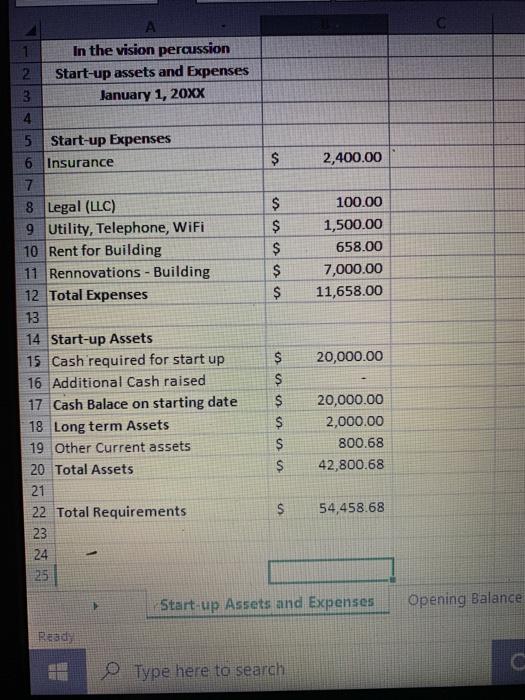
start up assets and expenses
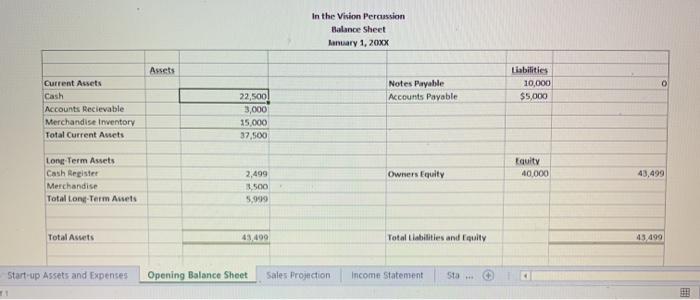
opening balance
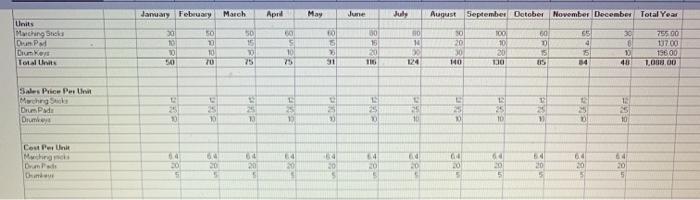
sales projection
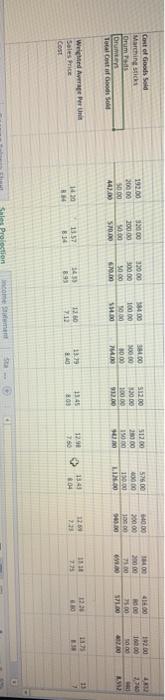
sales projection continued
income statement
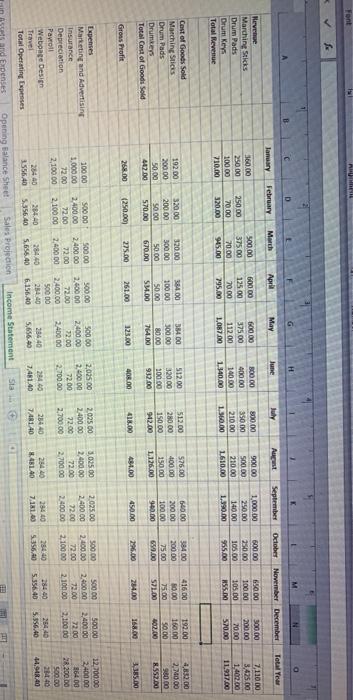
Income statement continued

when i say continued that mean that wasnt the end of the certain phase please help ASAP
$ 2,400.00 In the vision percussion 2 Start-up assets and Expenses 3 January 1, 20XX 4 5 Start-up Expenses 6 Insurance 7 8 Legal (LLC) 9 Utility, Telephone, WiFi 10 Rent for Building 11 Rennovations - Building 12 Total Expenses 13 14 Start-up Assets 15 Cash required for start up 16 Additional Cash raised 17 Cash Balace on starting date 18 Long term Assets 19 Other Current assets 20 Total Assets 21 22 Total Requirements 23 24 $ $ $ $ $ 100.00 1,500.00 658.00 7,000.00 11,658.00 20,000.00 $ $ $ $ S $ 20,000.00 2,000.00 800.68 42,800.68 $ 54,458.68 Start-up Assets and Expenses Opening Balance Ready Type here to search In the Vision Percussion Balance Sheet January 1, 20xx Assets Liabilities 10,000 $5,000 Notes Payable Accounts Payable 0 Current Assets Cash Accounts Recievable Merchandise Inventory Total Current Aucts 22,500) 3,000 15.000 37,500 Equity 40.000 Owners Equity 43,499 Long Term Assets Cash Register Merchandise Total Long-Term Awets 2,499 500 5,999 Total Asus Total Liabilities and Equity 43 499 Start-up Assets and Expenses Opening Balance Sheet Sales Projection Income Statement January February March April May June July August September October November December Total Year SO 50 BO 30 10 Units Marching Stick Dun PM Gun Key Total Unit TO 5 65 50 1 60 30 15 20 110 Sol 20 30 140 100 10 20 110 10 15 75500 1700 13600 100.00 10 TU 5 0 25 31 124 48 Sales PricePerUn 13 DR 23 Drupadi Drum 25 1 25 23 35 10 1 2 TD 25 1 10 Cour Per Una G 60 6 20 5 64 20 64 20 5 Ouma Die 20 5 20 32 20 5 20 5 64 20 5 5 5 ET 330 3400 10000 2765 Cost of God Marching stics Drums Drums Tocal cost of SOM 2000 0 19304 20000 SODO 447.00 3300 2001 0.00 50.00 So 3000 10000 91200 5120 2000 100 575 10000 110,00 LINDO MODO 20000 10000 9.00 200 16000 50.00 100 000 0006 OTO 7500 21.00 100 DOWS . 129 122 125 Weighed Arrage en Sales Price Cost 140 1357 814 12.50 7.12 145 893 + ET DE 1345 BOB 134 804 2 Proloction come Font M D C Total Year May October September June February April July Mach August November December Tamary Revenue Marching Sticks Drum Pads Drum Keys Total Revenue 160.00 250.00 10000 730.00 250.00 70.00 320.00 500.00 375.00 20.00 945. 60000 125.00 70.00 295.00 500.00 375 00 112.00 1.057.00 800.00 400.00 140.00 1.340.00 300.00 350.00 210.00 1.500.00 900.00 5001 210.00 1.610.00 1,000.00 250.00 140.00 1.390.00 500.00 250.00 105.00 955.00 650.00 100 DO 10500 255.00 300.00 200.00 20.00 570.00 7,110.00 3,425.00 1,402.00 11.917.00 38400 200.00 Cast of Goods Sold Marching Sticks Drum Pads Drumseys Total Cost of Goods Sold 19200 200.00 50.00 402.00 32000 200.00 50.00 570.00 320.00 300.00 50.00 670.00 38400 100.00 50.00 $94.00 35400 300.00 80.00 764.00 51200 320 00 100.00 932.00 512.00 280.00 15000 9020 576.00 400.00 150.00 1126.00 540.00 200.00 100.00 940.00 416 DO 0.00 75.00 571.00 192.00 160.00 50.00 4,832.00 2. MO 00 9000 8.552.00 2500 699.00 16.0 385.00 408.00 484.00 1200 284.00 261.00 123.00 295.00 450.00 Gross Profit (250.001) 200 275.00 2,025.00 2.40000 72.00 2.700.00 2.025.00 2.400 00 22.00 2.700.00 3,02500 2.400.00 72.00 2.700.00 2025 00 2.400.00 72.00 2.400.00 500.00 2.400.00 72.00 2.100.00 500.00 2.400.00 72.00 2.100.00 500.00 2,400.00 72.00 Expenses Marketing and Advertising 100.00 SOO DO 50000 500.00 50000 Insurance 1.000.00 2.400.00 2.400.00 2.60000 2.400.00 Depreciation 72.00 72.00 72.00 72.00 72.00 Payroll 2,100.00 2.100.00 2.400 00 2.400.00 2.40000 Webpage Design 50000 Travel 264.40 25440 284 40 Total Operating Expenses 1555.40 5,356.40 5.656.40 6.156.40 5,656.40 and Expenses Opening Balance Sheet Sales Projection Income Statement 12.700.00 2.400.00 86400 2R200.00 500.00 24 44.948.40 28440 1,481.40 2840 25440 748140 25440 3.41.40 2440 7,181.43 25440 51.0 264.40 5.356.40 25440 5.356.40 sta 40 DR. New LILARIN het Sales Proyecto Income Statement $ 2,400.00 In the vision percussion 2 Start-up assets and Expenses 3 January 1, 20XX 4 5 Start-up Expenses 6 Insurance 7 8 Legal (LLC) 9 Utility, Telephone, WiFi 10 Rent for Building 11 Rennovations - Building 12 Total Expenses 13 14 Start-up Assets 15 Cash required for start up 16 Additional Cash raised 17 Cash Balace on starting date 18 Long term Assets 19 Other Current assets 20 Total Assets 21 22 Total Requirements 23 24 $ $ $ $ $ 100.00 1,500.00 658.00 7,000.00 11,658.00 20,000.00 $ $ $ $ S $ 20,000.00 2,000.00 800.68 42,800.68 $ 54,458.68 Start-up Assets and Expenses Opening Balance Ready Type here to search In the Vision Percussion Balance Sheet January 1, 20xx Assets Liabilities 10,000 $5,000 Notes Payable Accounts Payable 0 Current Assets Cash Accounts Recievable Merchandise Inventory Total Current Aucts 22,500) 3,000 15.000 37,500 Equity 40.000 Owners Equity 43,499 Long Term Assets Cash Register Merchandise Total Long-Term Awets 2,499 500 5,999 Total Asus Total Liabilities and Equity 43 499 Start-up Assets and Expenses Opening Balance Sheet Sales Projection Income Statement January February March April May June July August September October November December Total Year SO 50 BO 30 10 Units Marching Stick Dun PM Gun Key Total Unit TO 5 65 50 1 60 30 15 20 110 Sol 20 30 140 100 10 20 110 10 15 75500 1700 13600 100.00 10 TU 5 0 25 31 124 48 Sales PricePerUn 13 DR 23 Drupadi Drum 25 1 25 23 35 10 1 2 TD 25 1 10 Cour Per Una G 60 6 20 5 64 20 64 20 5 Ouma Die 20 5 20 32 20 5 20 5 64 20 5 5 5 ET 330 3400 10000 2765 Cost of God Marching stics Drums Drums Tocal cost of SOM 2000 0 19304 20000 SODO 447.00 3300 2001 0.00 50.00 So 3000 10000 91200 5120 2000 100 575 10000 110,00 LINDO MODO 20000 10000 9.00 200 16000 50.00 100 000 0006 OTO 7500 21.00 100 DOWS . 129 122 125 Weighed Arrage en Sales Price Cost 140 1357 814 12.50 7.12 145 893 + ET DE 1345 BOB 134 804 2 Proloction come Font M D C Total Year May October September June February April July Mach August November December Tamary Revenue Marching Sticks Drum Pads Drum Keys Total Revenue 160.00 250.00 10000 730.00 250.00 70.00 320.00 500.00 375.00 20.00 945. 60000 125.00 70.00 295.00 500.00 375 00 112.00 1.057.00 800.00 400.00 140.00 1.340.00 300.00 350.00 210.00 1.500.00 900.00 5001 210.00 1.610.00 1,000.00 250.00 140.00 1.390.00 500.00 250.00 105.00 955.00 650.00 100 DO 10500 255.00 300.00 200.00 20.00 570.00 7,110.00 3,425.00 1,402.00 11.917.00 38400 200.00 Cast of Goods Sold Marching Sticks Drum Pads Drumseys Total Cost of Goods Sold 19200 200.00 50.00 402.00 32000 200.00 50.00 570.00 320.00 300.00 50.00 670.00 38400 100.00 50.00 $94.00 35400 300.00 80.00 764.00 51200 320 00 100.00 932.00 512.00 280.00 15000 9020 576.00 400.00 150.00 1126.00 540.00 200.00 100.00 940.00 416 DO 0.00 75.00 571.00 192.00 160.00 50.00 4,832.00 2. MO 00 9000 8.552.00 2500 699.00 16.0 385.00 408.00 484.00 1200 284.00 261.00 123.00 295.00 450.00 Gross Profit (250.001) 200 275.00 2,025.00 2.40000 72.00 2.700.00 2.025.00 2.400 00 22.00 2.700.00 3,02500 2.400.00 72.00 2.700.00 2025 00 2.400.00 72.00 2.400.00 500.00 2.400.00 72.00 2.100.00 500.00 2.400.00 72.00 2.100.00 500.00 2,400.00 72.00 Expenses Marketing and Advertising 100.00 SOO DO 50000 500.00 50000 Insurance 1.000.00 2.400.00 2.400.00 2.60000 2.400.00 Depreciation 72.00 72.00 72.00 72.00 72.00 Payroll 2,100.00 2.100.00 2.400 00 2.400.00 2.40000 Webpage Design 50000 Travel 264.40 25440 284 40 Total Operating Expenses 1555.40 5,356.40 5.656.40 6.156.40 5,656.40 and Expenses Opening Balance Sheet Sales Projection Income Statement 12.700.00 2.400.00 86400 2R200.00 500.00 24 44.948.40 28440 1,481.40 2840 25440 748140 25440 3.41.40 2440 7,181.43 25440 51.0 264.40 5.356.40 25440 5.356.40 sta 40 DR. New LILARIN het Sales Proyecto Income Statement Step by Step Solution
There are 3 Steps involved in it
Step: 1

Get Instant Access to Expert-Tailored Solutions
See step-by-step solutions with expert insights and AI powered tools for academic success
Step: 2

Step: 3
Ace Your Homework with AI
Get the answers you need in no time with our AI-driven, step-by-step assistance
Get Started
Managerial Accounting A Focus on Ethical Decision Making
Authors: Steve Jackson, Roby Sawyers, Greg Jenkins
5th edition
324663854, 978-0324663853