Answered step by step
Verified Expert Solution
Question
1 Approved Answer
I have a folder called digit inside that folder i have 1756 images of different numbers. I need to create a matrix of 64 columns

I have a folder called "digit" inside that folder i have 1756 images of different numbers. I need to create a matrix of 64 columns and 1756 rows. Each row will have 64 different number representing the pixels of that particular image. So since the images are 8 by 8 that means in total its 64 pictures.
please help create a method that creates a table like this , that iterates down the folder's images and gives you a list or with 64 numbers. Thank you
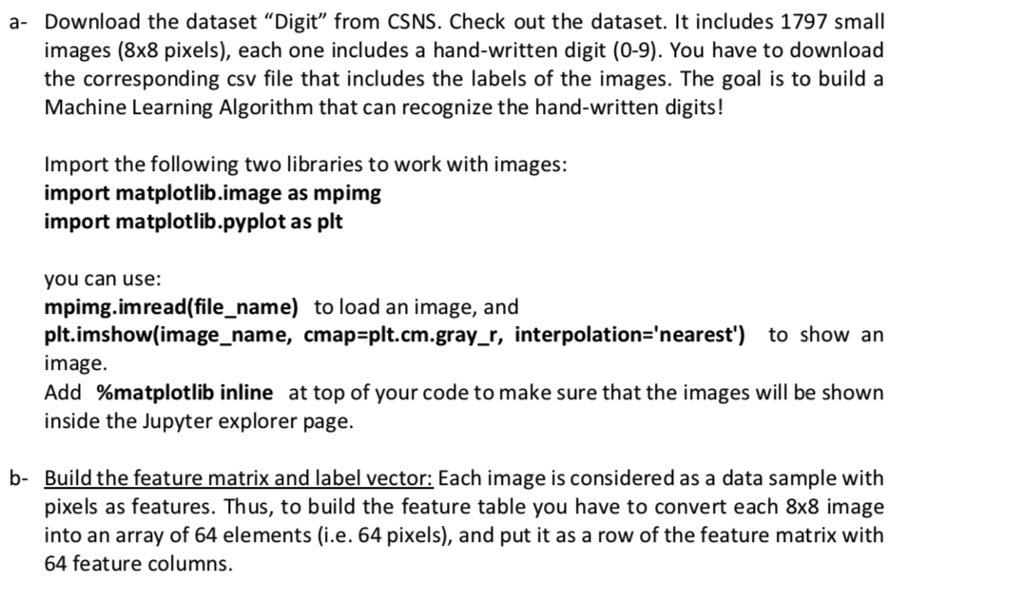
a- Download the dataset "Digit" from CSNS. Check out the dataset. It includes 1797 small images (8x8 pixels), each one includes a hand-written digit (0-9). You have to download the corresponding csv file that includes the labels of the images. The goal is to build a Machine Learning Algorithm that can recognize the hand-written digits! Import the following two libraries to work with images: import matplotlib.image as mpimg import matplotlib.pyplot as plt you can use: mpimg.imread(file_name) to load an image, and plt.imshow(image_name, cmap-plt.cm.gray_r, interpolation-'nearest') to show an image Add %matplotlib inline at top of your code to make sure that the images will be shown inside the Jupyter explorer page b- Build the feature matrix and label vector: Each image is considered as a data sample with pixels as features. Thus, to build the feature table you have to convert each 8x8 image into an array of 64 elements (i.e. 64 pixels), and put it as a row of the feature matrix with 64 feature columns. a- Download the dataset "Digit" from CSNS. Check out the dataset. It includes 1797 small images (8x8 pixels), each one includes a hand-written digit (0-9). You have to download the corresponding csv file that includes the labels of the images. The goal is to build a Machine Learning Algorithm that can recognize the hand-written digits! Import the following two libraries to work with images: import matplotlib.image as mpimg import matplotlib.pyplot as plt you can use: mpimg.imread(file_name) to load an image, and plt.imshow(image_name, cmap-plt.cm.gray_r, interpolation-'nearest') to show an image Add %matplotlib inline at top of your code to make sure that the images will be shown inside the Jupyter explorer page b- Build the feature matrix and label vector: Each image is considered as a data sample with pixels as features. Thus, to build the feature table you have to convert each 8x8 image into an array of 64 elements (i.e. 64 pixels), and put it as a row of the feature matrix with 64 feature columnsStep by Step Solution
There are 3 Steps involved in it
Step: 1

Get Instant Access to Expert-Tailored Solutions
See step-by-step solutions with expert insights and AI powered tools for academic success
Step: 2

Step: 3

Ace Your Homework with AI
Get the answers you need in no time with our AI-driven, step-by-step assistance
Get Started


