I have a question related to IBM is based on the Harvard Business case "IBM at the Crossroads" and financial statements of IBM from 2013 to 2016 which I have attached as a doc . Here please read the material analyze the four years of financial data, and use other reliable information via online search to address the following questions I have below
https://drive.google.com/file/d/1QGO9aX794e23TQ3zLBCbDdsXiTVwZOfT/view?usp=sharing
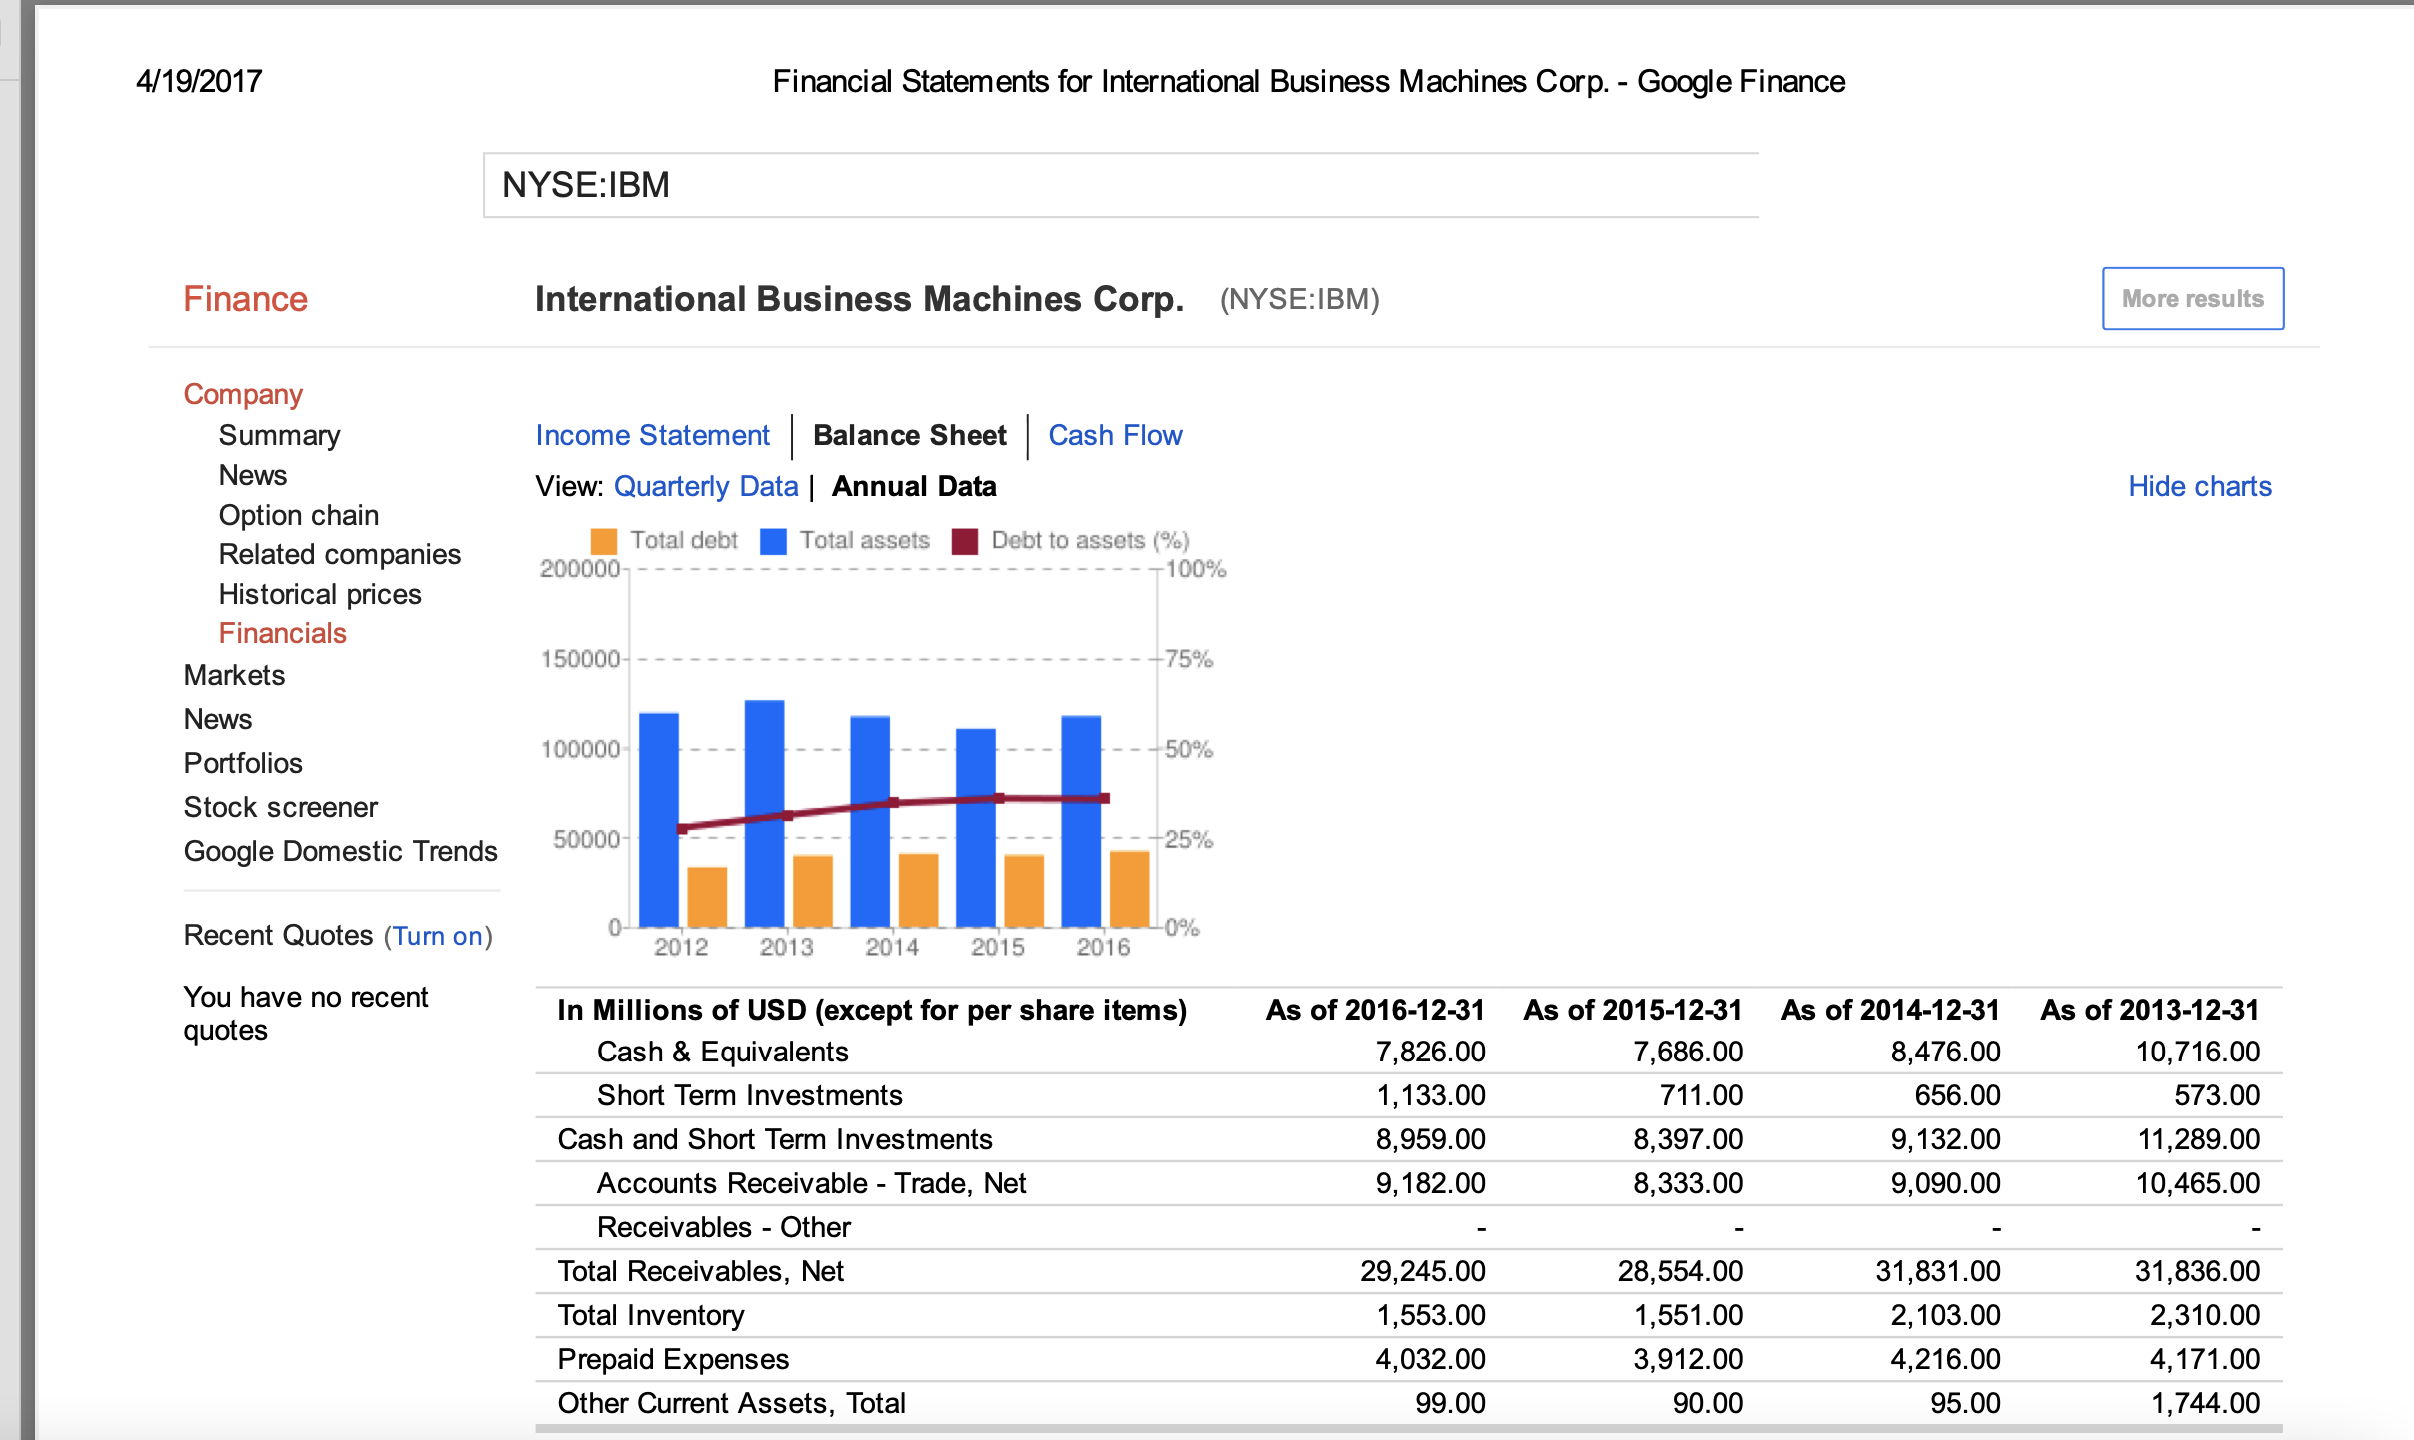
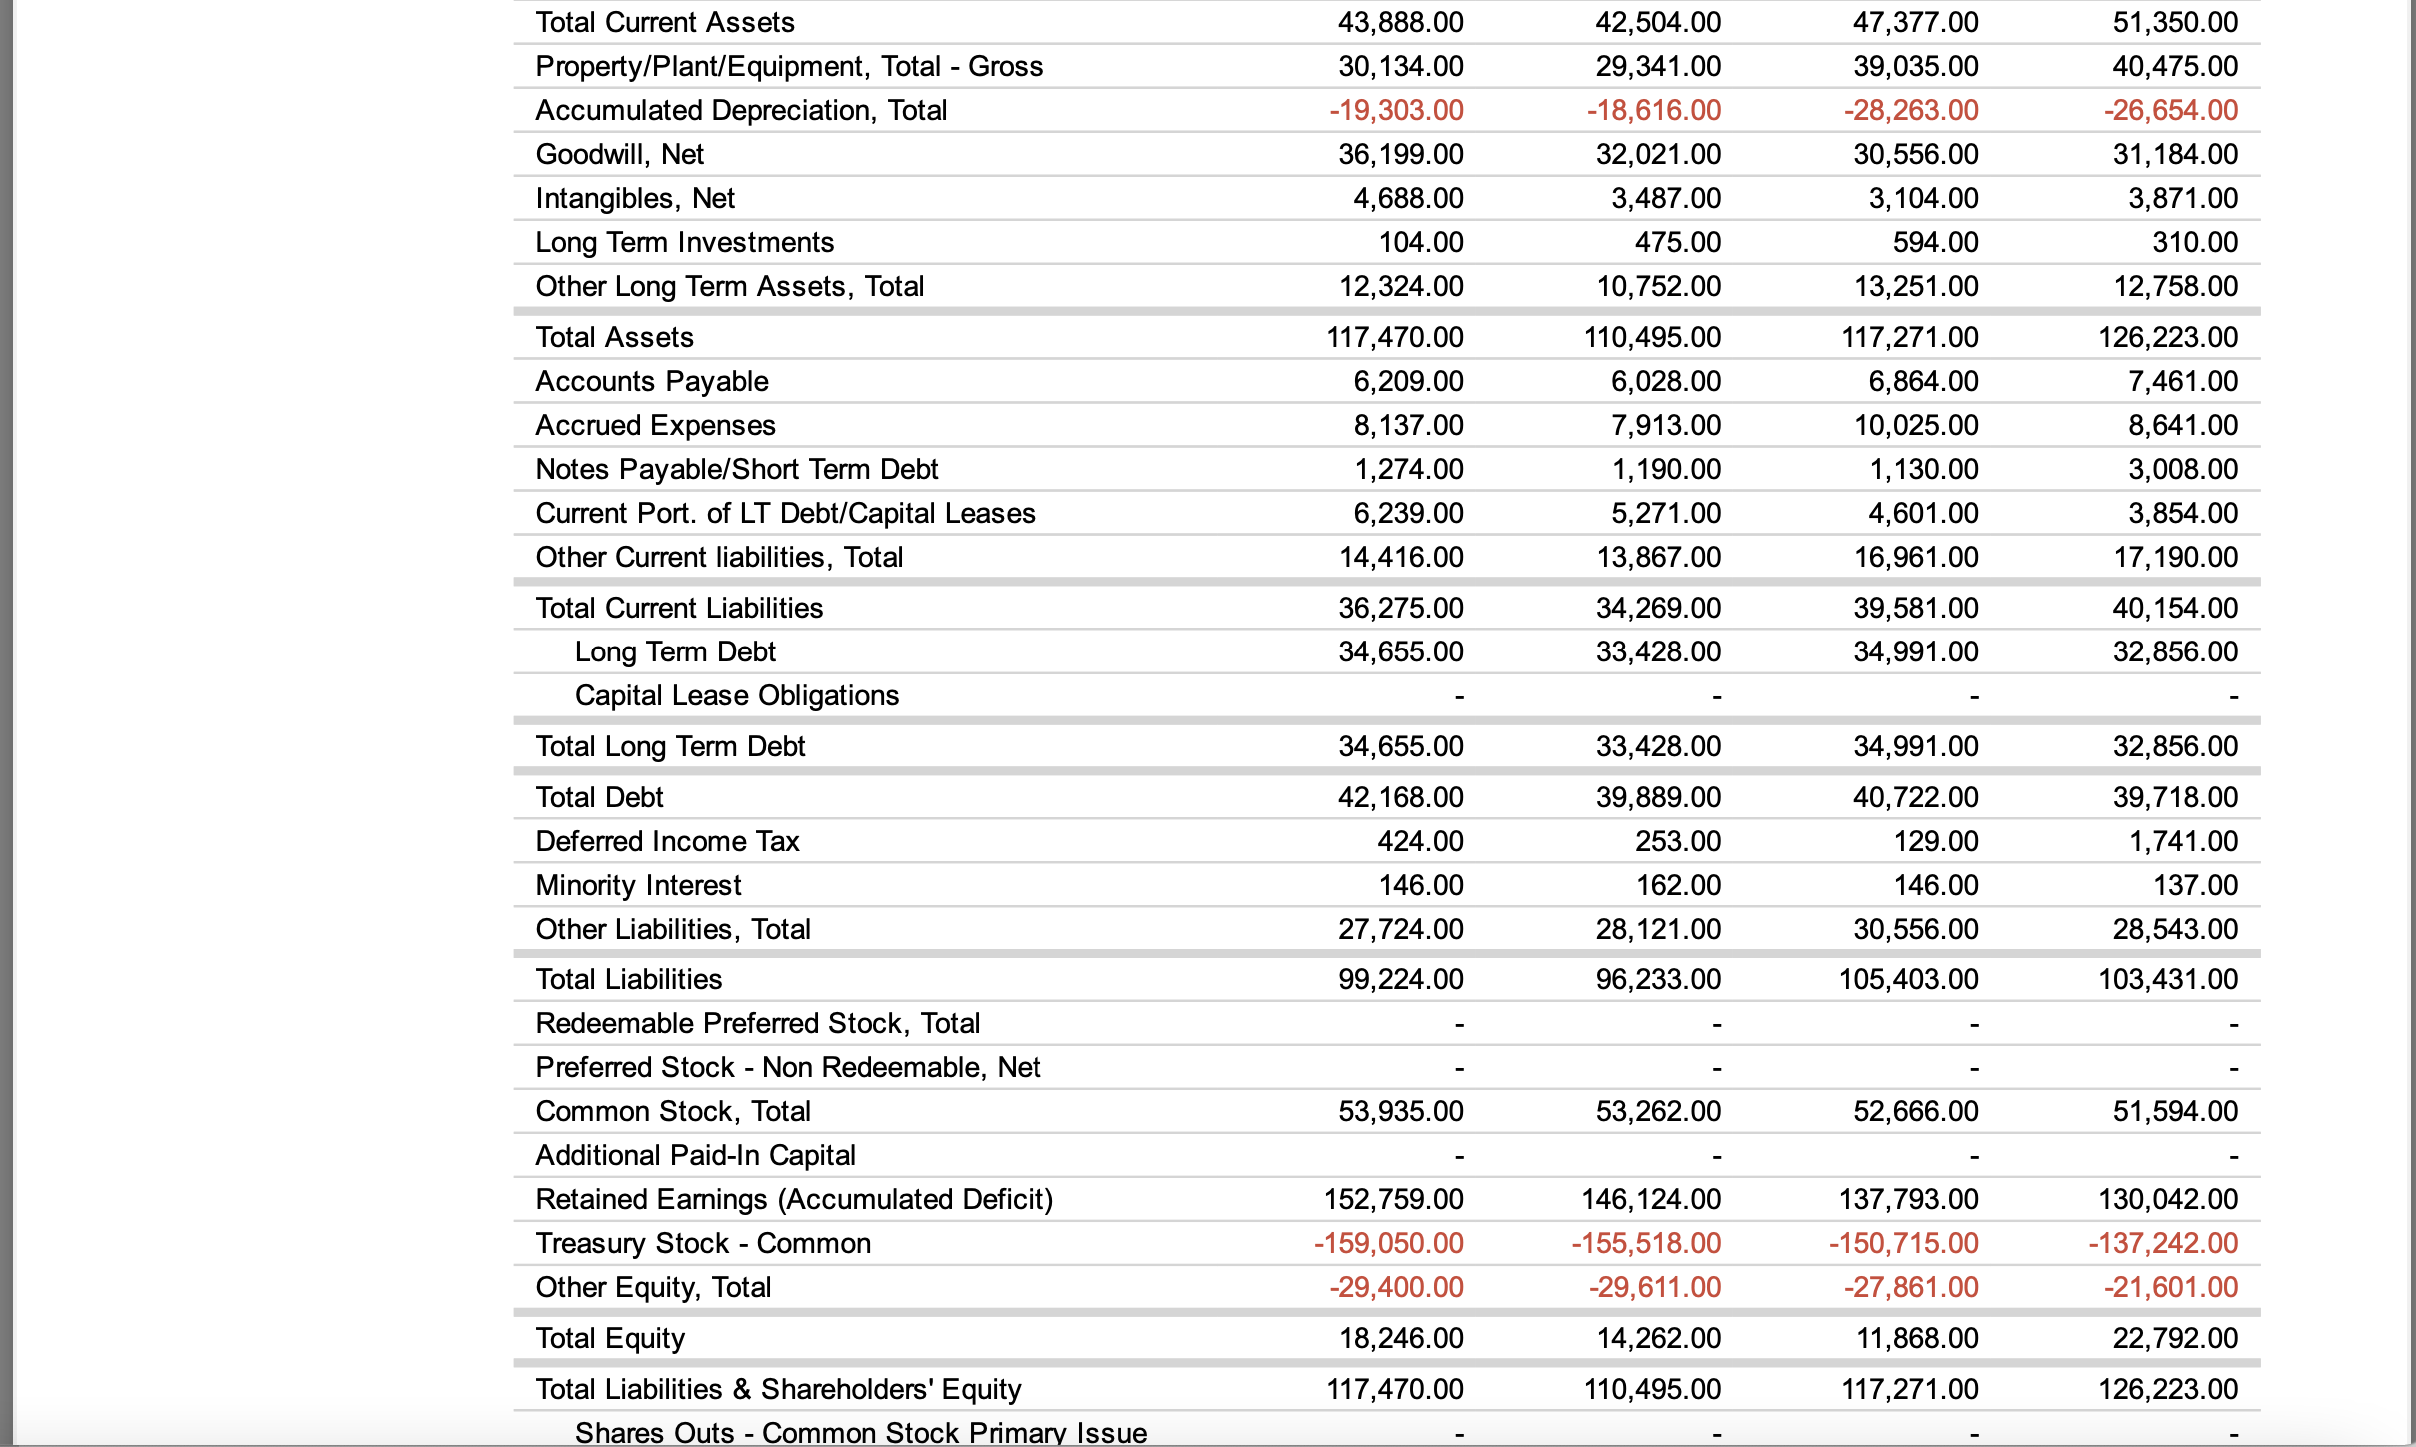
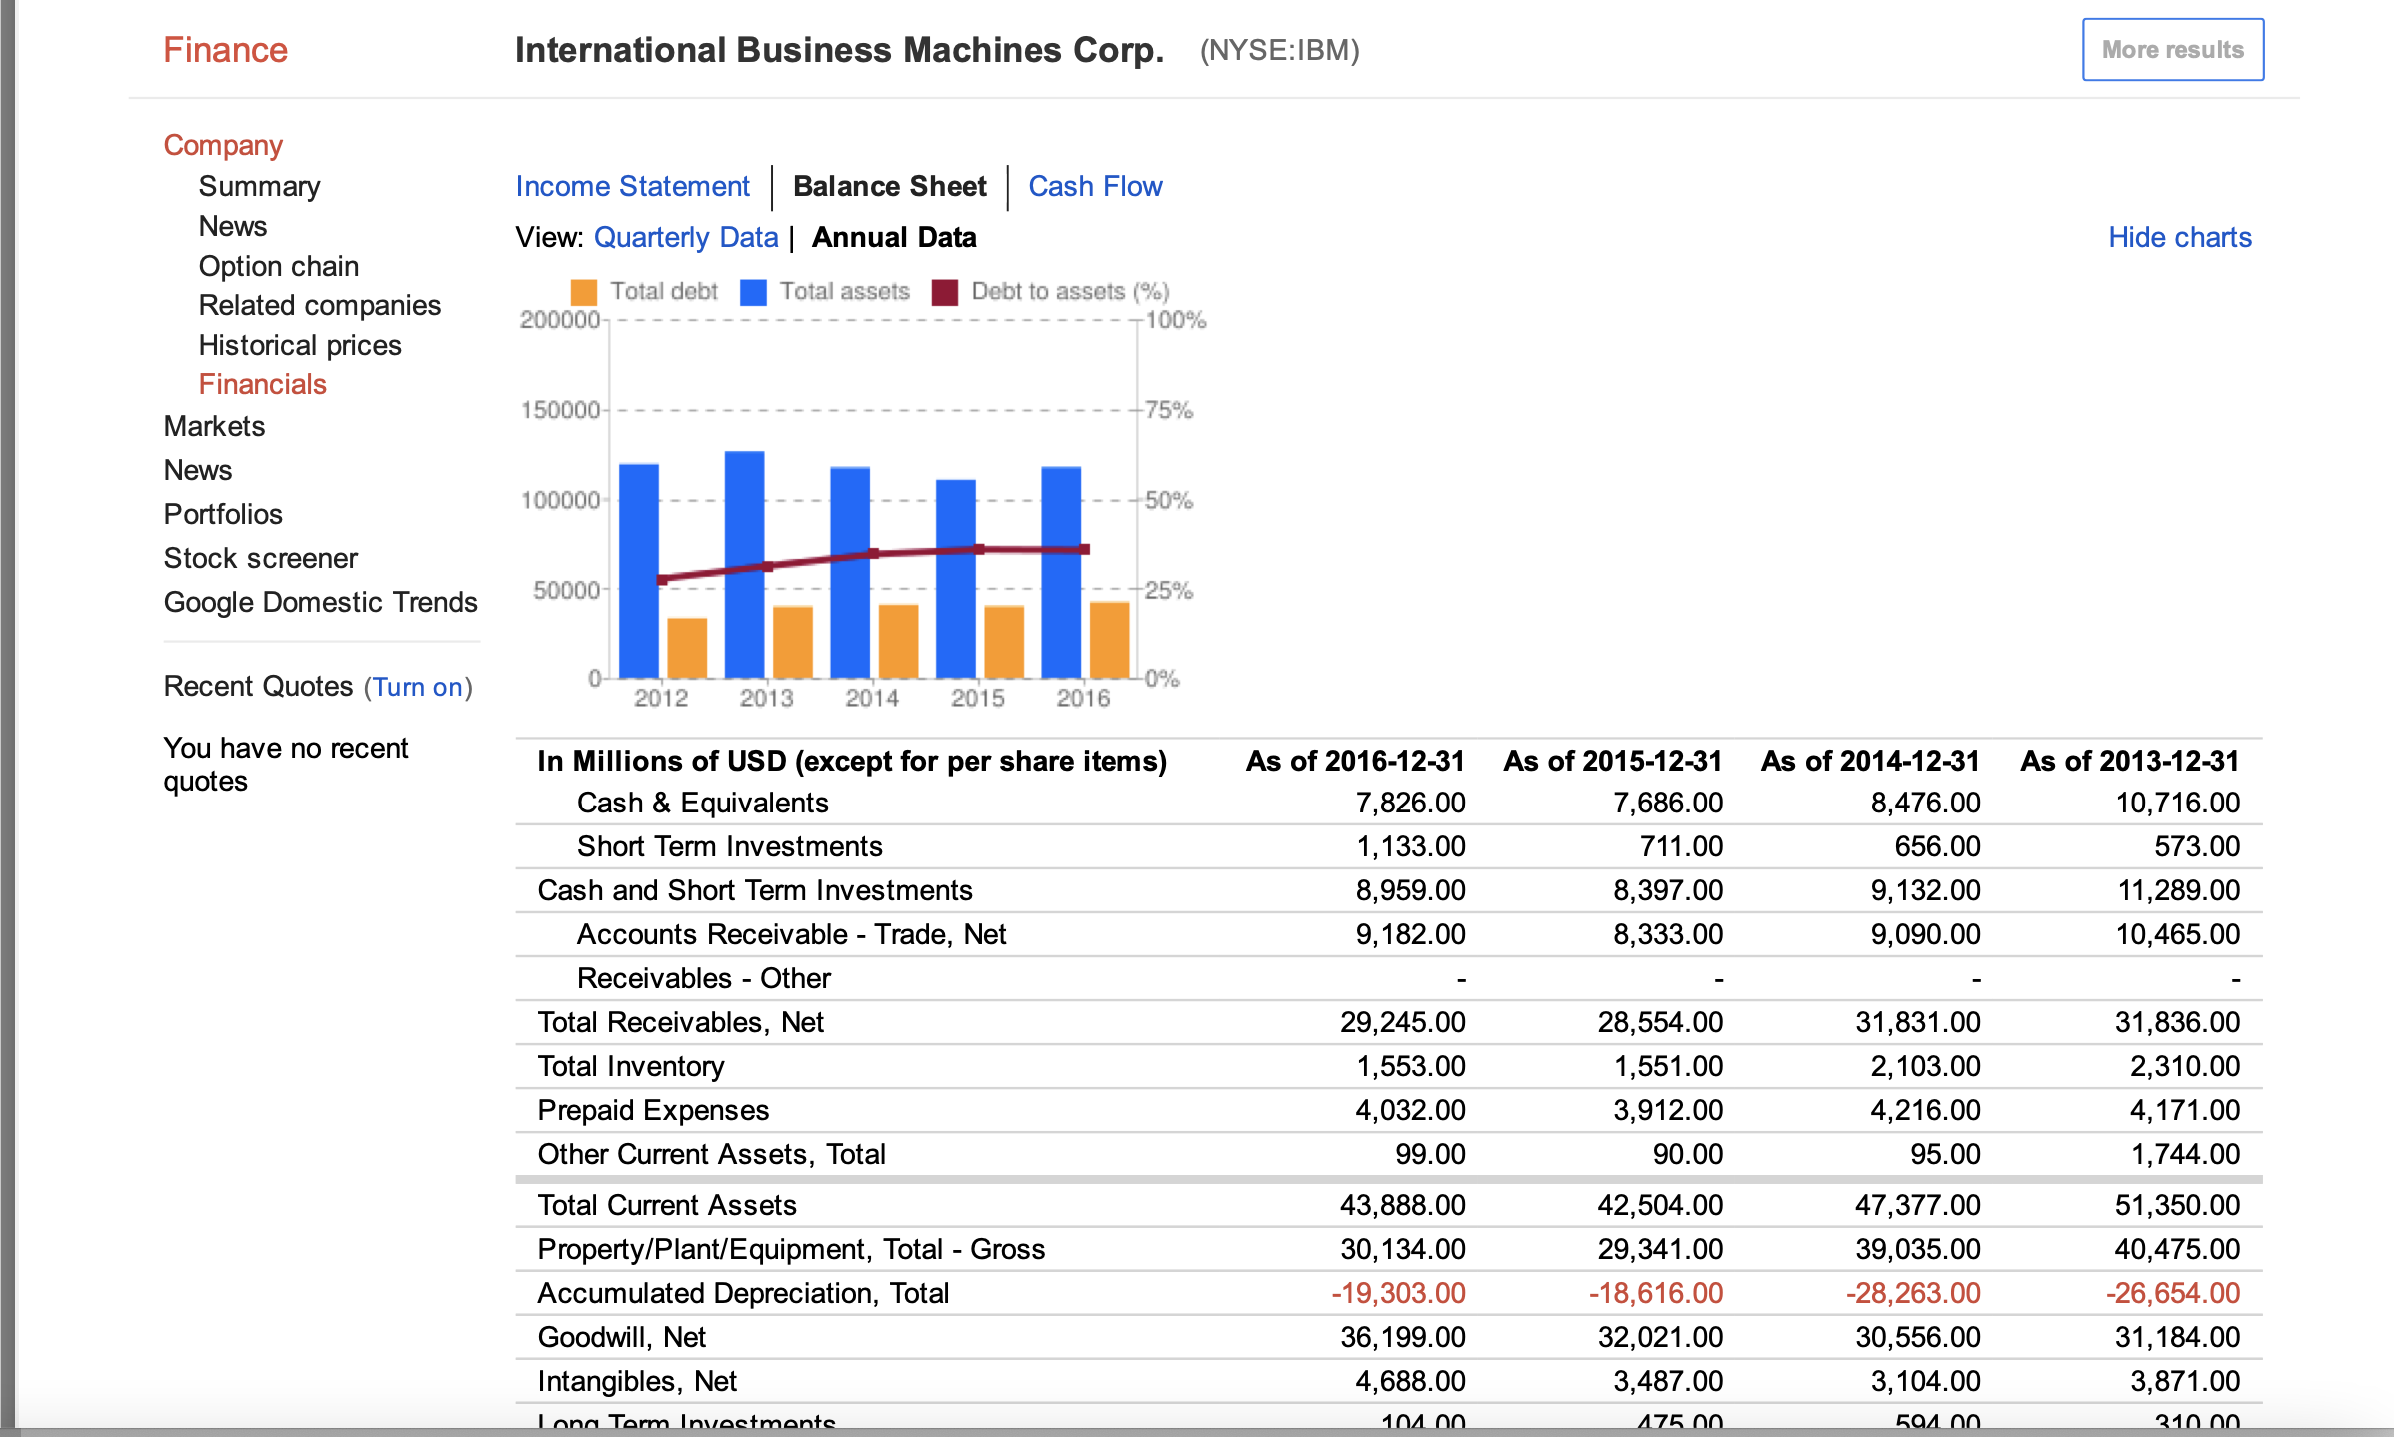
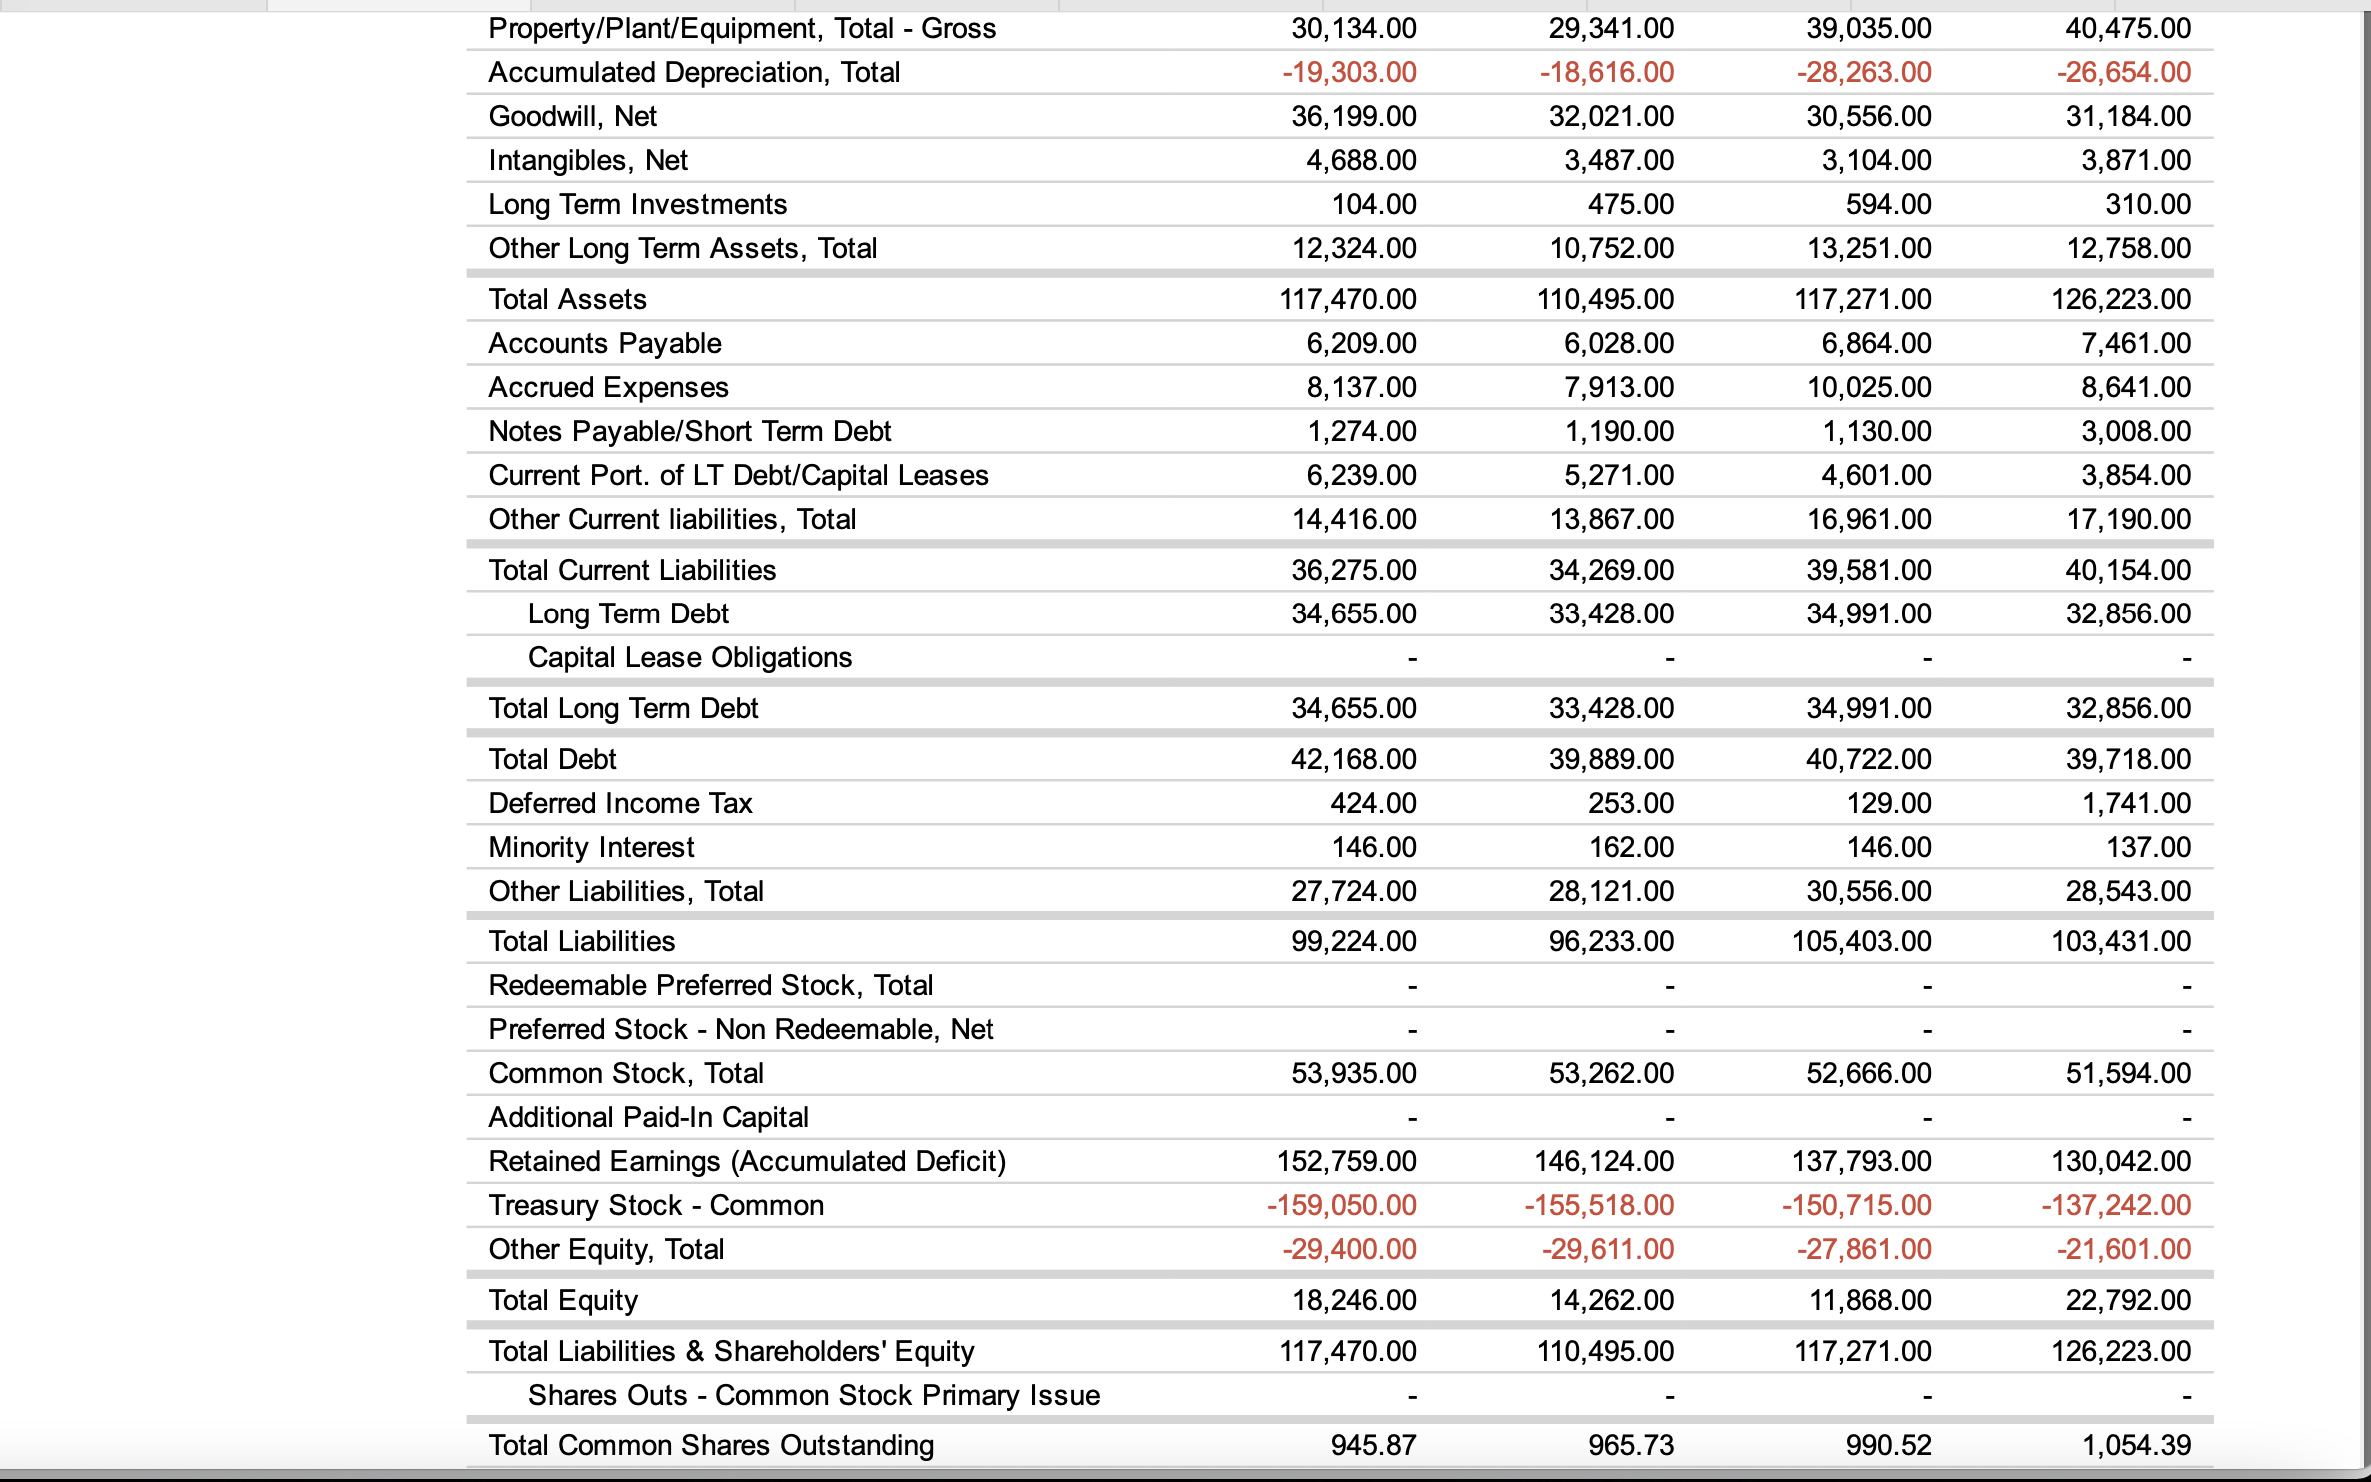
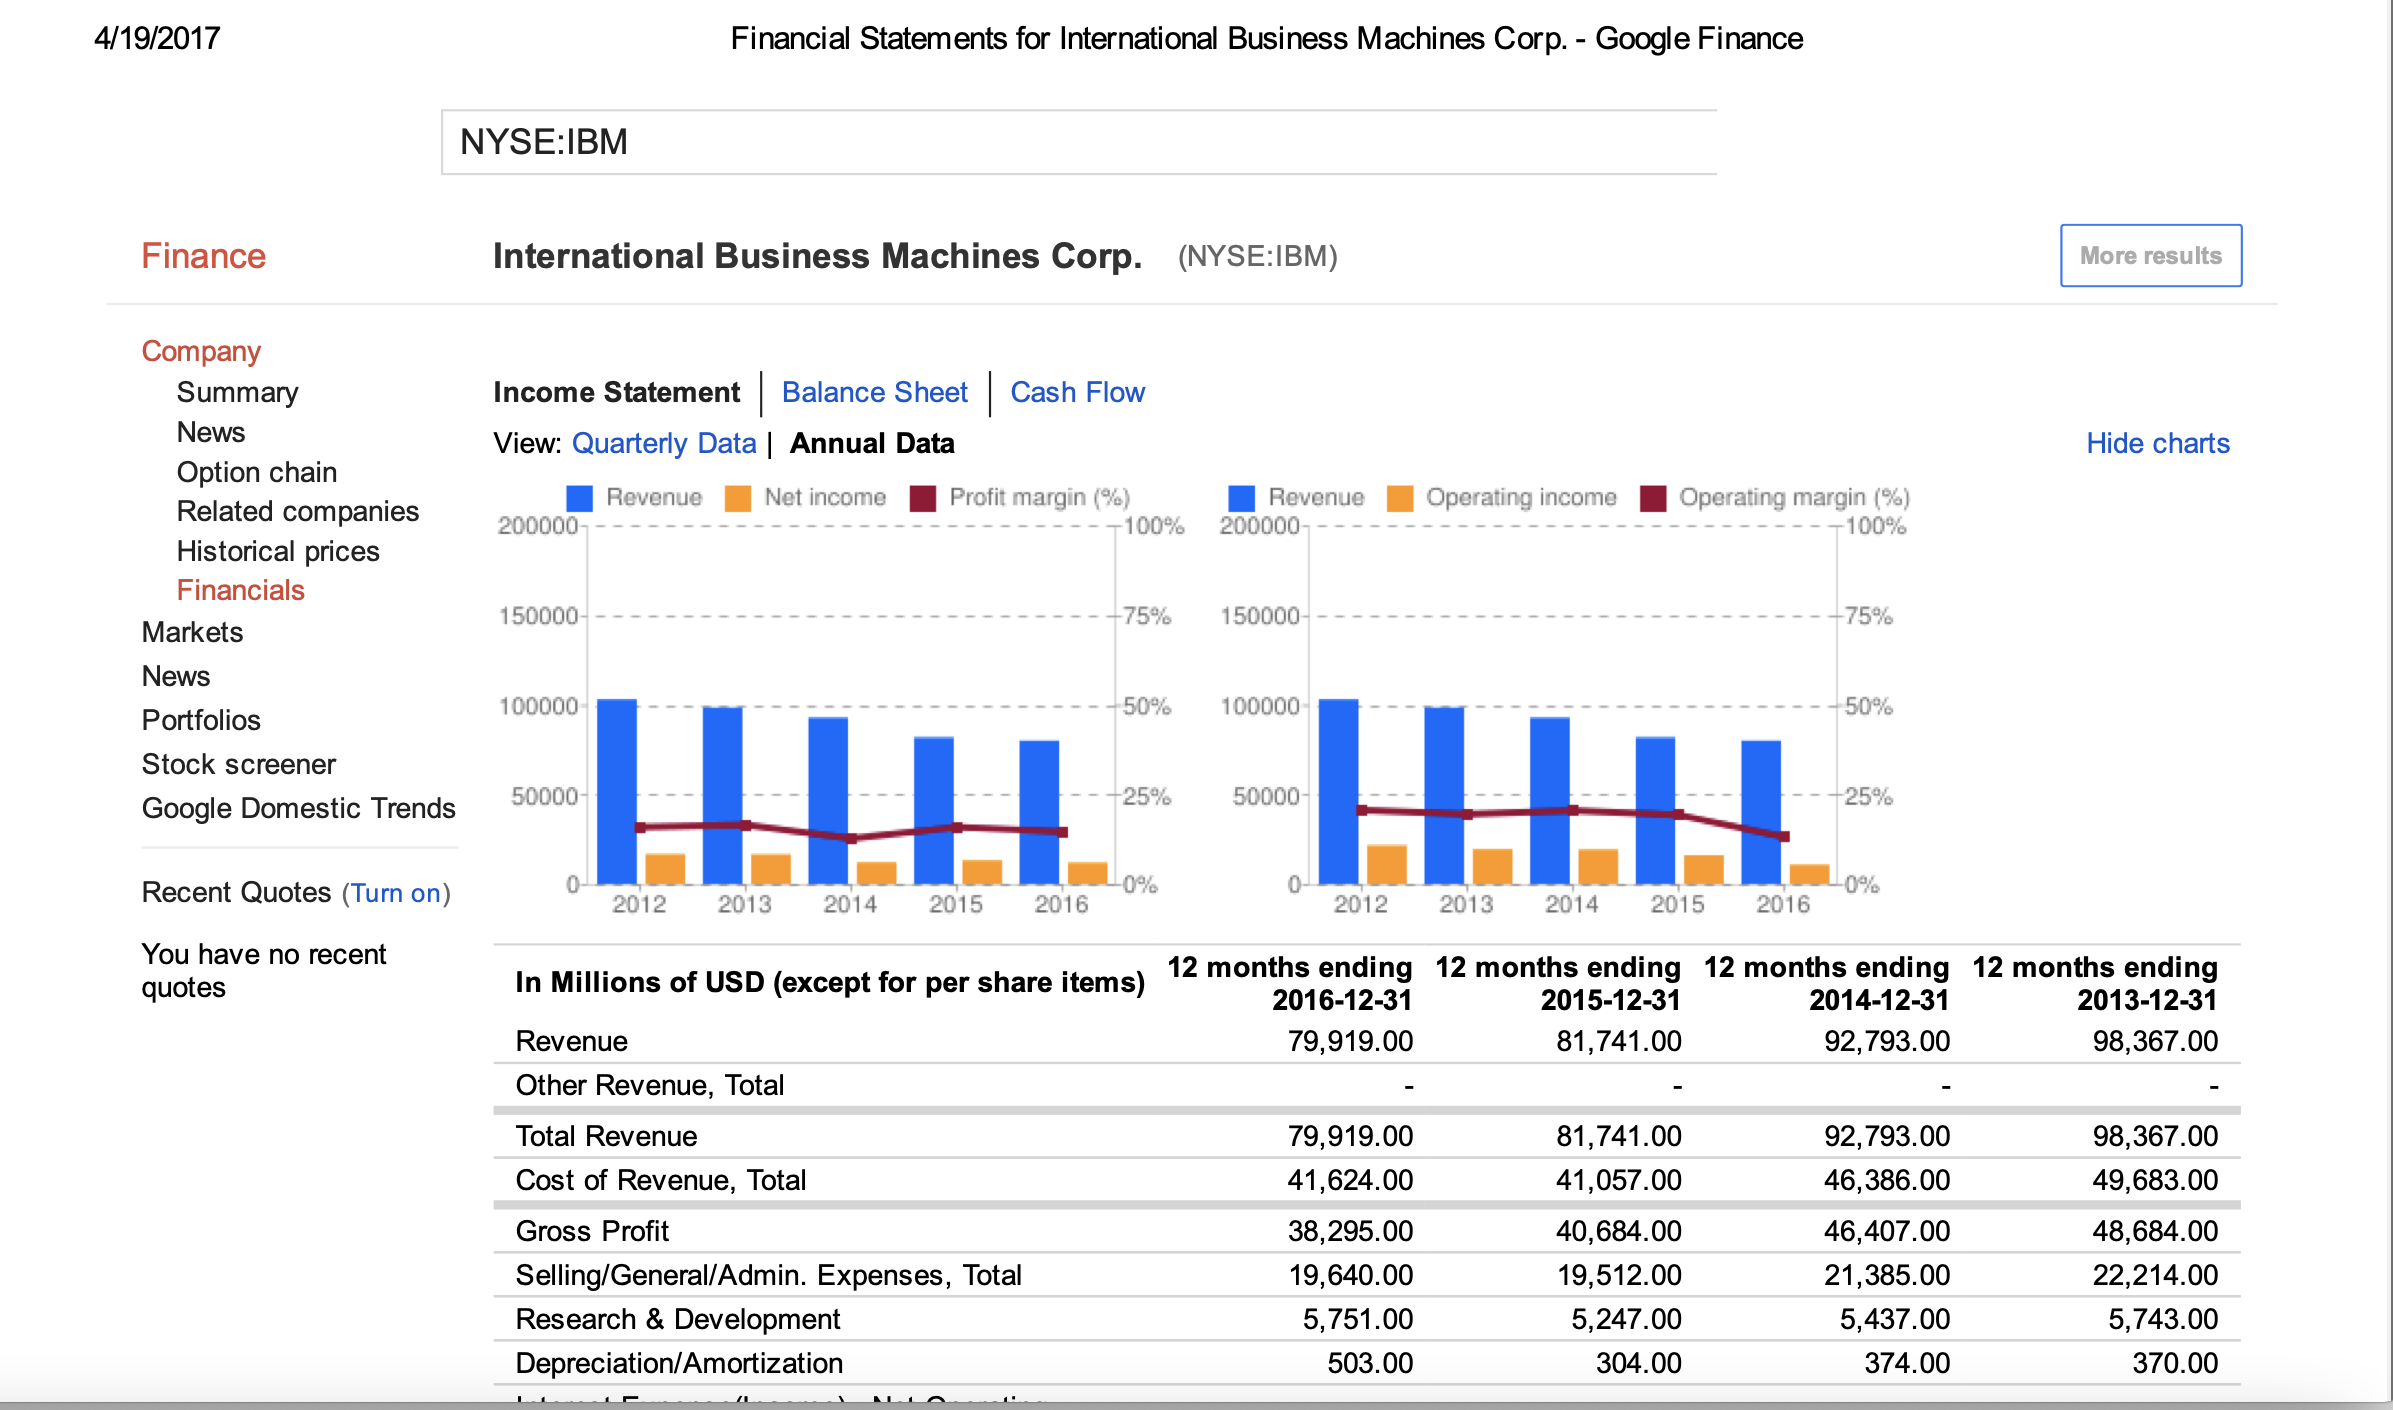
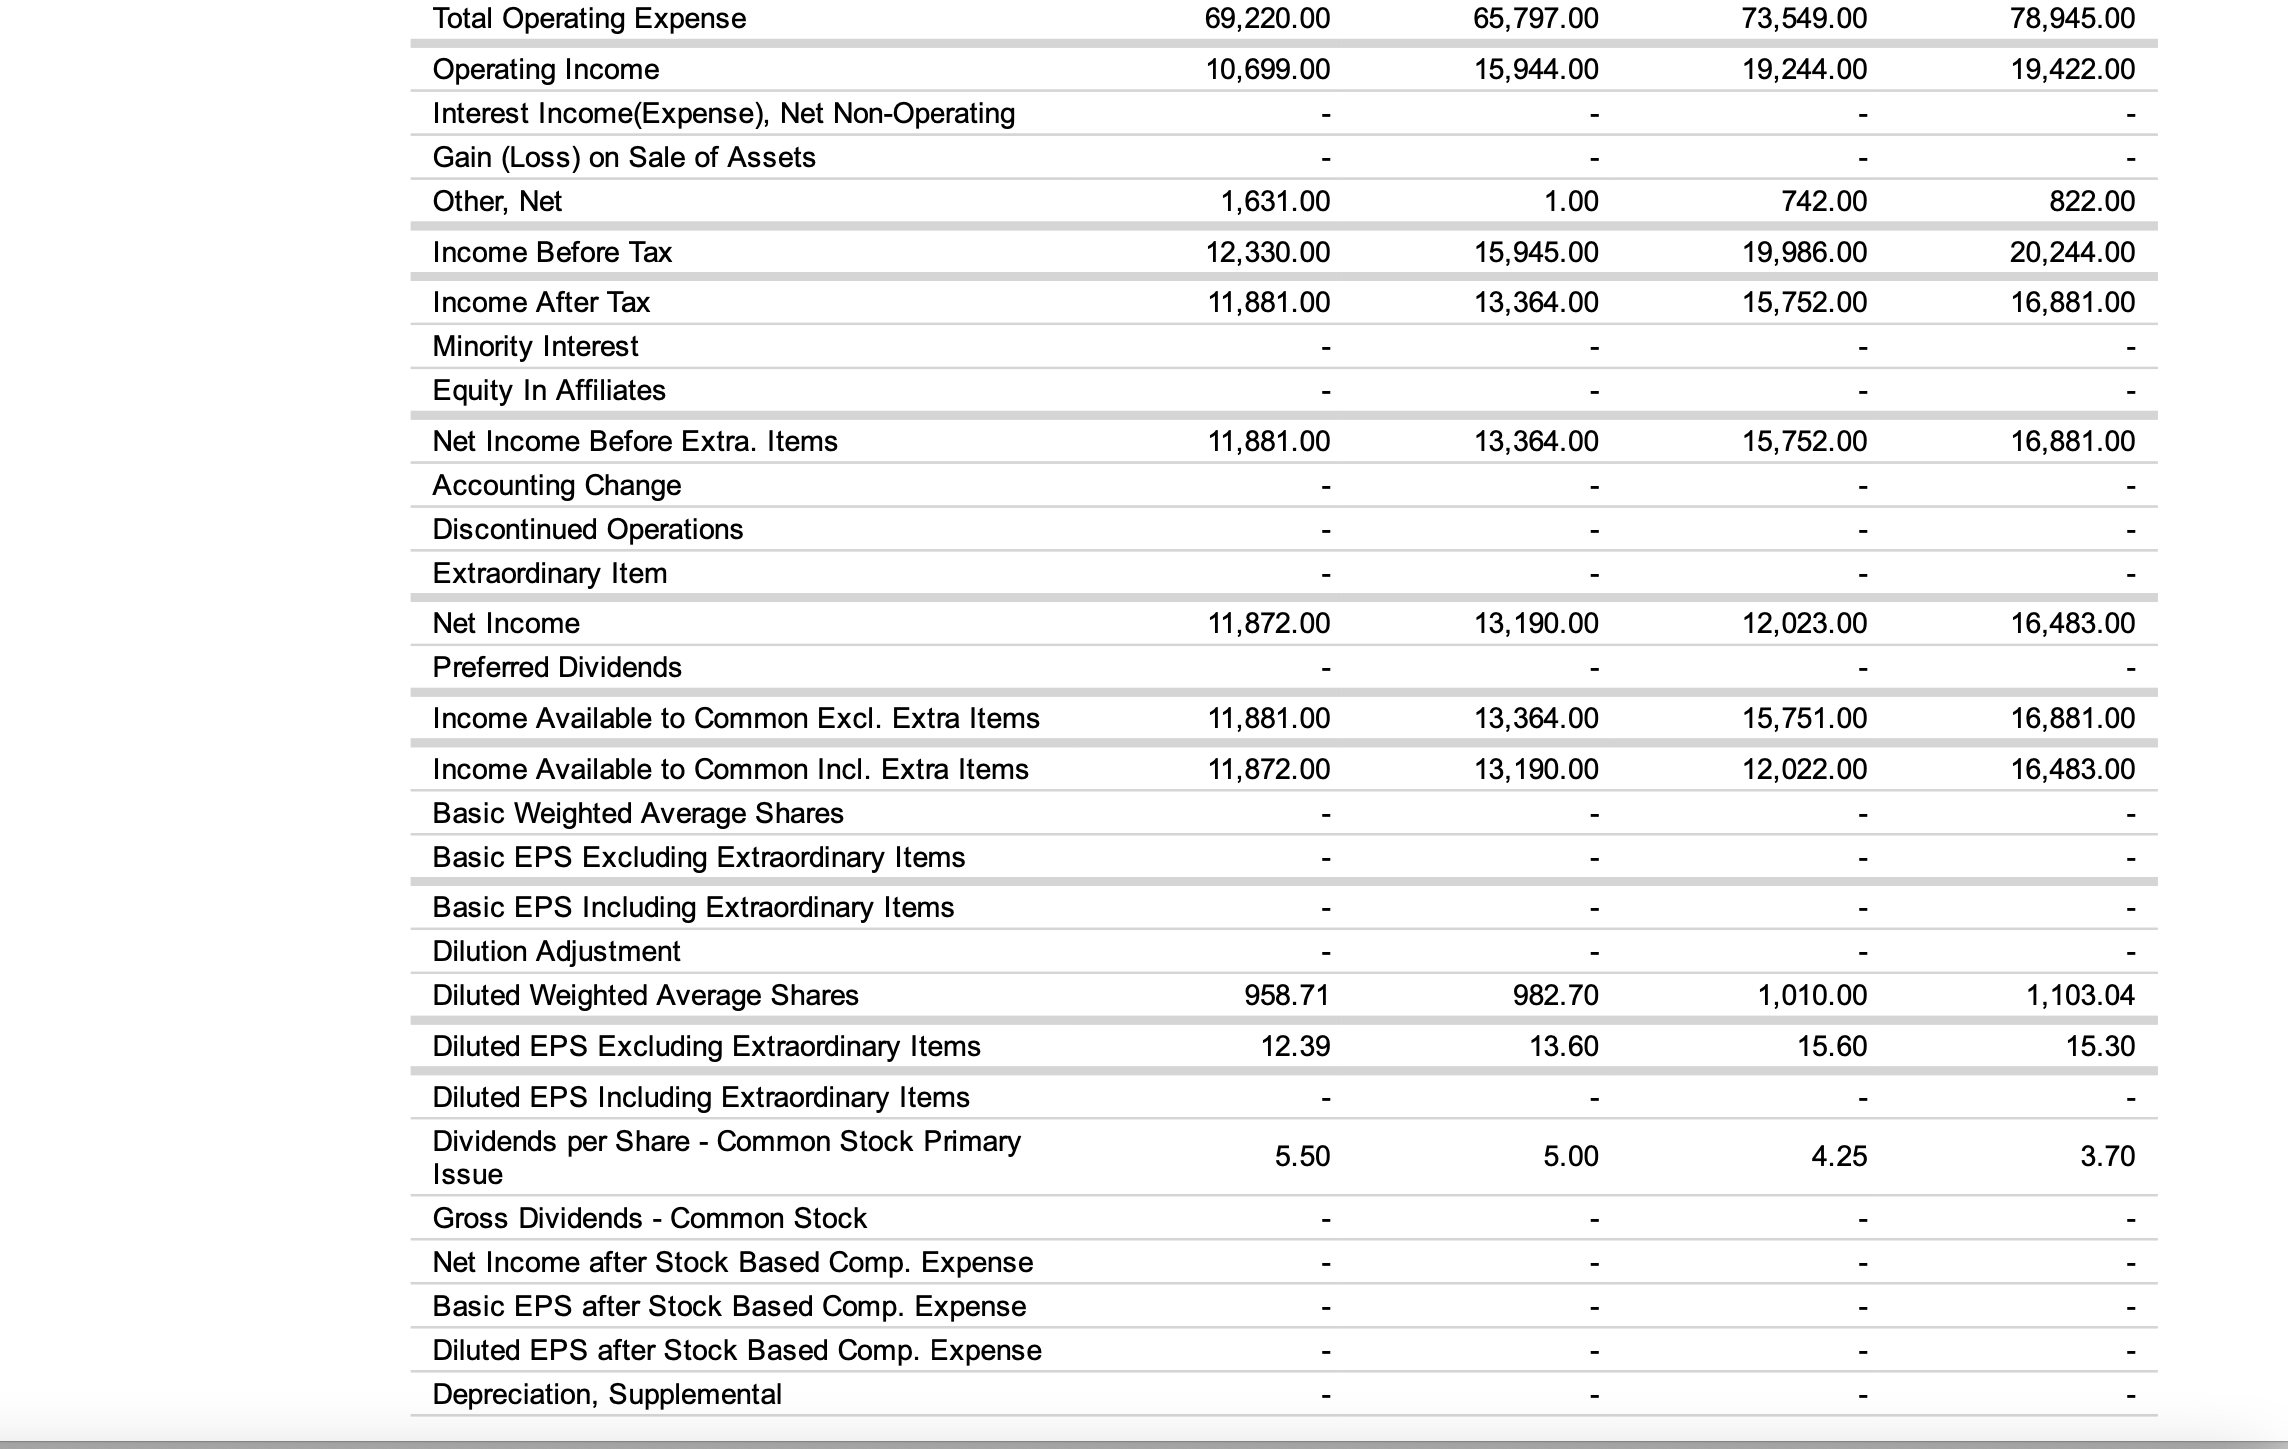
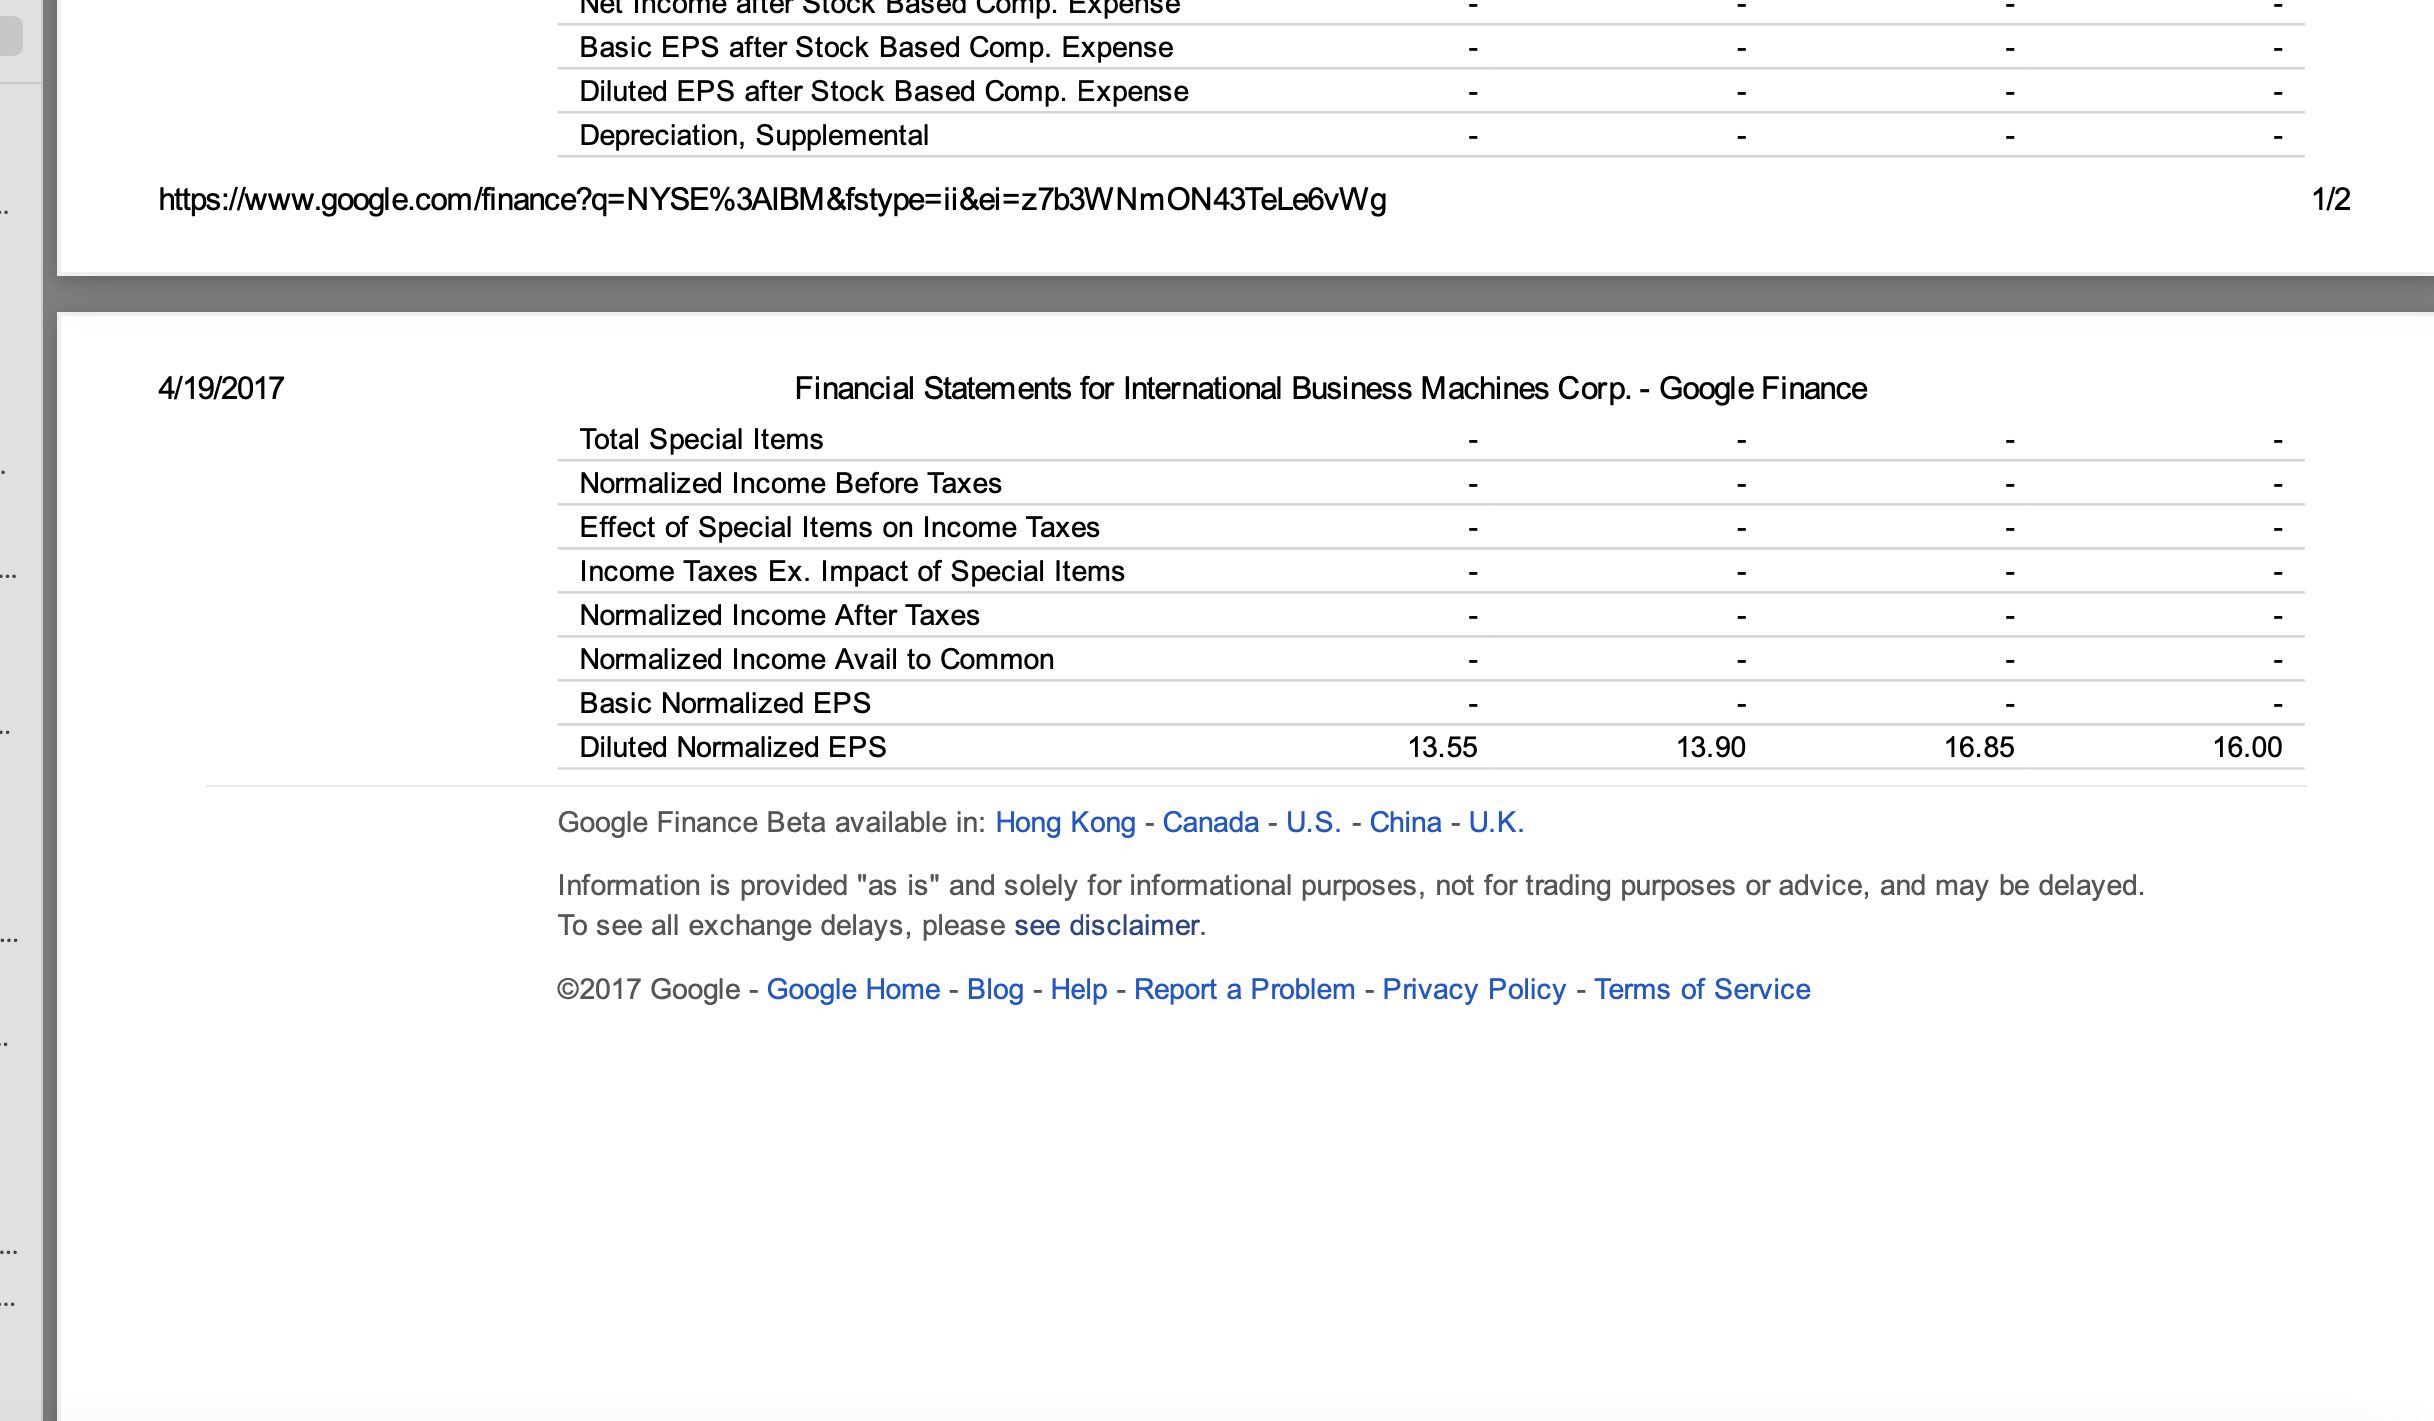
01. Which of the following functional areas will be affected by IBM CEO Rometty's strategy (the \"strategic imperatives\")? Select TWO options you believe are correct and write a short justification for EACH selected. A. IBM's new strategy will affect its financial performance in the short term. B. IBM's new strategy will reduce employee benefits in HR policy. C. IBM's new strategy will increase outsourced manufacturing of consumer electronics to countries with cheaper labor. D. IBM's new strategy will allocate more investment to RQD. , 4/19/2017 Financial Statements for International Business Machines Corp. - Google Finance NYSE:|BM Finance International Business Machines Corp. (NYSE:|BM) More results Company Summary Income Statement I Balance Sheet Cash Flow News View: Quarterly Data | Annual Data Hide charts Option chain Related companies 200057.23] f2") _ ! T9235??? __'_ PW}? '38??? 1130\Total Current Assets Property/Plant/Equipment, Total - Gross Accumulated Depreciation, Total Goodwill, Net Intangibles, Net Long Term Investments Other Long Term Assets, Total Total Assets Accounts Payable Accrued Expenses Notes Payable/Short Term Debt Cunent Port. of LT Debt/Capital Leases Other Current liabilities, Total Total Current Liabilities Long Term Debt Capital Lease Obligations Total Long Term Debt Total Debt Deferred Income Tax Minority Interest Other Liabilities, Total Total Liabilities Redeemable Prefened Stock, Total Preferred Stock - Non Redeemable, Net Common Stock, Total Additional Paid-In Capital Retained Earnings (Accumulated Deficit) Treasury Stock - Common Other Equity, Total Total Equity Total Liabilities & Shareholders' Equity Shares Outs - Common Stock Primary Issue 43,888.00 30,134.00 -1 9,303.00 36,199.00 4,688.00 104.00 12,324.00 117,470.00 6,209.00 8,137.00 1,274.00 6,239.00 14,416.00 36,275.00 34,655.00 34,655.00 42,168.00 424.00 146.00 27,724.00 99,224.00 53,935.00 152,759.00 -1 59,050.00 -29,400.00 18,246.00 117,470.00 42,504.00 29,341.00 -18,616.00 32,021.00 3,487.00 475.00 10,752.00 110,495.00 6,028.00 7,913.00 1,190.00 5,271.00 13,867.00 34,269.00 33,428.00 33,428.00 39,889.00 253.00 162.00 28,121.00 96,233.00 53,262.00 146,124.00 455,518.00 29,611.00 14,262.00 110,495.00 47,377.00 39,035.00 -28,263.00 30,556.00 3,104.00 594.00 13,251.00 117,271.00 6,864.00 10,025.00 1,130.00 4,601.00 16,961.00 39,581.00 34,991.00 34,991.00 40,722.00 129.00 146.00 30,556.00 105,403.00 52,666.00 137,793.00 -150,715.00 -27,861 .00 11,868.00 117,271.00 51,350.00 40,475.00 -26,654.00 31,184.00 3,871.00 310.00 12,758.00 126,223.00 7,461.00 8,641.00 3,008.00 3,854.00 17,190.00 40,154.00 32,856.00 32,856.00 39,718.00 1,741.00 137.00 28,543.00 103,431.00 51,594.00 130,042.00 -1 37,242.00 -21,601.00 22,792.00 126,223.00 Finance International Business Machines Corp. (NYSE:IBM) More results Company Summary Income Statement |Balance Sheet Cash Flow News View: Quarterly Data | Annual Data Hide charts Option chain Related companies Total debt Total assets Debt to assets (%) 200000- - 100% Historical prices Financials Markets 150000- -75% News Portfolios 100000 Stock screener Google Domestic Trends 50000- Recent Quotes (Turn on) 2012 2013 2014 2015 2016 You have no recent In Millions of USD (except for per share items) As of 2016-12-31 As of 2015-12-31 As of 2014-12-31 As of 2013-12-31 quotes Cash & Equivalents 7,826.00 7,686.00 8,476.00 10,716.00 Short Term Investments 1, 133.00 711.00 656.00 573.00 Cash and Short Term Investments 8,959.00 8,397.00 9, 132.00 11,289.00 Accounts Receivable - Trade, Net 9, 182.00 8,333.00 9,090.00 10,465.00 Receivables - Other Total Receivables, Net 29,245.00 28,554.00 31,831.00 31,836.00 Total Inventory 1,553.00 1,551.00 2, 103.00 2,310.00 Prepaid Expenses 4,032.00 3,912.00 4,216.00 4, 171.00 Other Current Assets, Total 99.00 90.00 95.00 1,744.00 Total Current Assets 43,888.00 42,504.00 47,377.00 51,350.00 Property/Plant/Equipment, Total - Gross 30, 134.00 29,341.00 39,035.00 40,475.00 Accumulated Depreciation, Total -19,303.00 -18,616.00 -28,263.00 -26,654.00 Goodwill, Net 36, 199.00 32,021.00 30,556.00 31, 184.00 Intangibles, Net 4,688.00 3,487.00 3, 104.00 3,871.00 Long Term Investments 101 00 475 00 501 00 310 00Property/Plant/Equipment, Total - Gross Accumulated Depreciation, Total Goodwill, Net Intangibles, Net Long Term Investments Other Long Term Assets, Total Total Assets Accounts Payable Accrued Expenses Notes Payable/Short Term Debt Current Port. of LT Debt/Capital Leases Other Current liabilities, Total Total Current Liabilities Long Term Debt Capital Lease Obligations Total Long Term Debt Total Debt Deferred Income Tax Minority Interest Other Liabilities, Total Total Liabilities Redeemable Preferred Stock, Total Preferred Stock - Non Redeemable, Net Common Stock, Total Additional Paid-In Capital Retained Earnings (Accumulated Decit) Treasury Stock - Common Other Equity, Total Total Equity Total Liabilities & Shareholders' Equity Shares Outs - Common Stock Primary Issue Total Common Shares Outstanding , 30,134.00 -19,303.00 36,199.00 4,688.00 104.00 12,324.00 117,470.00 6,209.00 8,137.00 1,274.00 6,239.00 14,416.00 36,275.00 34,655.00 34,655.00 42,168.00 424.00 146.00 27,724.00 99,224.00 53,935.00 152,759.00 459,050.00 29,400.00 18,246.00 117,470.00 945.87 7 29,341.00 -18,616.00 32,021.00 3,487.00 475.00 10,752.00 110,495.00 6,028.00 7,913.00 1,190.00 5,271 .00 13,867.00 34,269.00 33,428.00 33,428.00 39,889.00 253.00 162.00 28,121.00 96,233.00 53,262.00 146,124.00 455,518.00 -29,611.00 14,262.00 110,495.00 ,, , 965.73 39,035.00 -28,263.00 30,556.00 3,104.00 594.00 13,251.00 117,271.00 6,864.00 10,025.00 1,130.00 4,601.00 16,961.00 39,581.00 34,991.00 34,991.00 40,722.00 129.00 146.00 30,556.00 105,403.00 52,666.00 137,793.00 -1 50,71 5.00 -27,861 .00 11,868.00 117,271.00 990.52 , 40,475.00 -26,654.00 31,184.00 3,871.00 310.00 12,758.00 126,223.00 7,461 .00 8,641 .00 3,008.00 3,854.00 17,190.00 40,154.00 32,856.00 32,856.00 39,718.00 1 ,741 .00 137.00 28,543.00 103,431.00 51,594.00 130,042.00 437,242.00 -21,601.00 22,792.00 126,223.00 1.054.397 4/19/2017 Finance Company Summary News Option chain Related companies Historical prices Financials Markets News Portfolios Stock screener Google Domestic Trends Recent Quotes (Turn on) You have no recent quotes b Financial Statements for International Business Machines Corp. - Google Finance NYSE:IBM International Business Machines Corp. Income Statement I Balance Sheet Cash Flow View: Quarterly Data | Annual Data I Revenue I Net income I Profil margin ('15) 200000 777777777777777777777777777777 400% 150000 .............................. -7510, 100000 50000' 2012 2013 2014 2015 2016 In Millions of USD (except for per share items) Revenue Other Revenue, Total Total Revenue Cost of Revenue, Total Gross Prot Selling/General/Admin. Expenses, Total Research & Development Depreciation/Amortization 12 months ending (NYSE:IBM) I Revenue I Operaling income I Operating margin [92] 200000 777777777777777777777777777777 v 1 00% 150000 .............................. 45% 100000 ..................... 50.,\" 500003 . _ -25.,9 . law 2012 2013 2014 2015 2016 2016-12-31 2015-12-31 2014-12-31 79,919.00 31,741.00 92,793.00 79,919.00 61,741.00 92,793.00 41,624.00 41,057.00 46,386.00 38,295.00 40,684.00 46,407.00 19,640.00 19,512.00 21,335.00 5,751.00 5,247.00 5,437.00 503.00 304.00 374.00 More results Hide charts 12 months ending 12 months ending 12 months ending 2013-12-31 98,367.00 98,367.00 49,683.00 48,684.00 22,214.00 5,743.00 370.00 Total Operating Expense Operating Income Interest Income(Expense), Net Non-Operating Gain (Loss) on Sale of Assets Other, Net Income Before Tax Income After Tax Minority Interest Equity In Affiliates Net Income Before Extra. Items Accounting Change Discontinued Operations Extraordinary Item Net Income Preferred Dividends Income Available to Common Ech. Extra Items Income Available to Common Incl. Extra Items Basic Weighted Average Shares Basic EPS Excluding Extraordinary Items Basic EPS Including Extraordinary Items Dilution Adjustment Diluted Weighted Average Shares Diluted EPS Excluding Extraordinary Items Diluted EPS Including Extraordinary Items Dividends per Share - Common Stock Primary Issue Gross Dividends - Common Stock Net Income after Stock Based Comp. Expense Basic EPS after Stock Based Comp. Expense Diluted EPS after Stock Based Comp. Expense Depreciation, Supplemental 69,220.00 10,699.00 1,631.00 12,330.00 11,881.00 11,881.00 11,872.00 11,881.00 11,872.00 958.71 12.39 5.50 65,797.00 15,944.00 1.00 15,945.00 13,364.00 13,364.00 13,190.00 13,364.00 13,190.00 982.70 13.60 5.00 73,549.00 19,244.00 742.00 19,986.00 15,752.00 15,752.00 12,023.00 15,751.00 12,022.00 1,010.00 15.60 4.25 78,945.00 19,422.00 822.00 20,244.00 16,881.00 16,881.00 16,483.00 16,881.00 16,483.00 1,103.04 15.30 3.70 Basic EPS after Stock Based Comp. Expense Diluted EPS after Stock Based Comp. Expense Depreciation, Supplemental https://www.google.com/finance?q=NYSE%3AIBM&fstype=ii&ei=z763WNmON43Tele6vWg 1/2 4/19/2017 Financial Statements for International Business Machines Corp. - Google Finance Total Special Items Normalized Income Before Taxes Effect of Special Items on Income Taxes Income Taxes Ex. Impact of Special Items Normalized Income After Taxes Normalized Income Avail to Common Basic Normalized EPS Diluted Normalized EPS 13.55 13.90 16.85 16.00 Google Finance Beta available in: Hong Kong - Canada - U.S. - China - U.K. Information is provided "as is" and solely for informational purposes, not for trading purposes or advice, and may be delayed. To see all exchange delays, please see disclaimer. 2017 Google - Google Home - Blog - Help - Report a Problem - Privacy Policy - Terms of Service