Answered step by step
Verified Expert Solution
Link Copied!

Question

1 Approved Answer

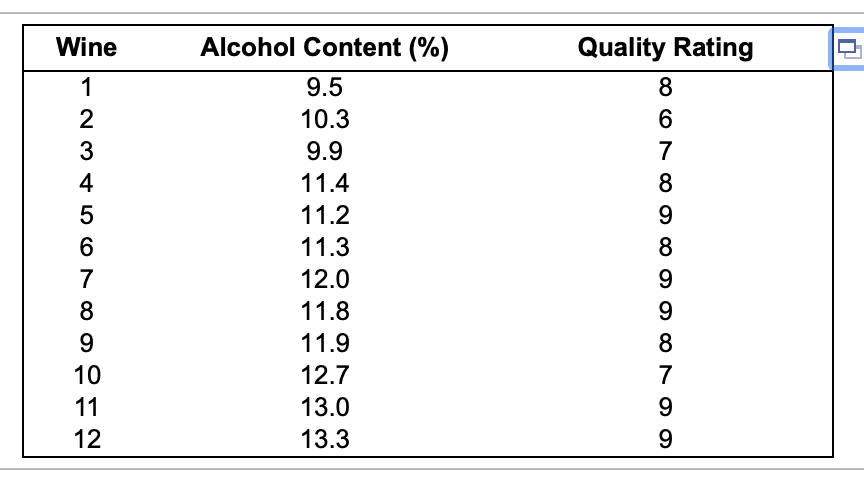
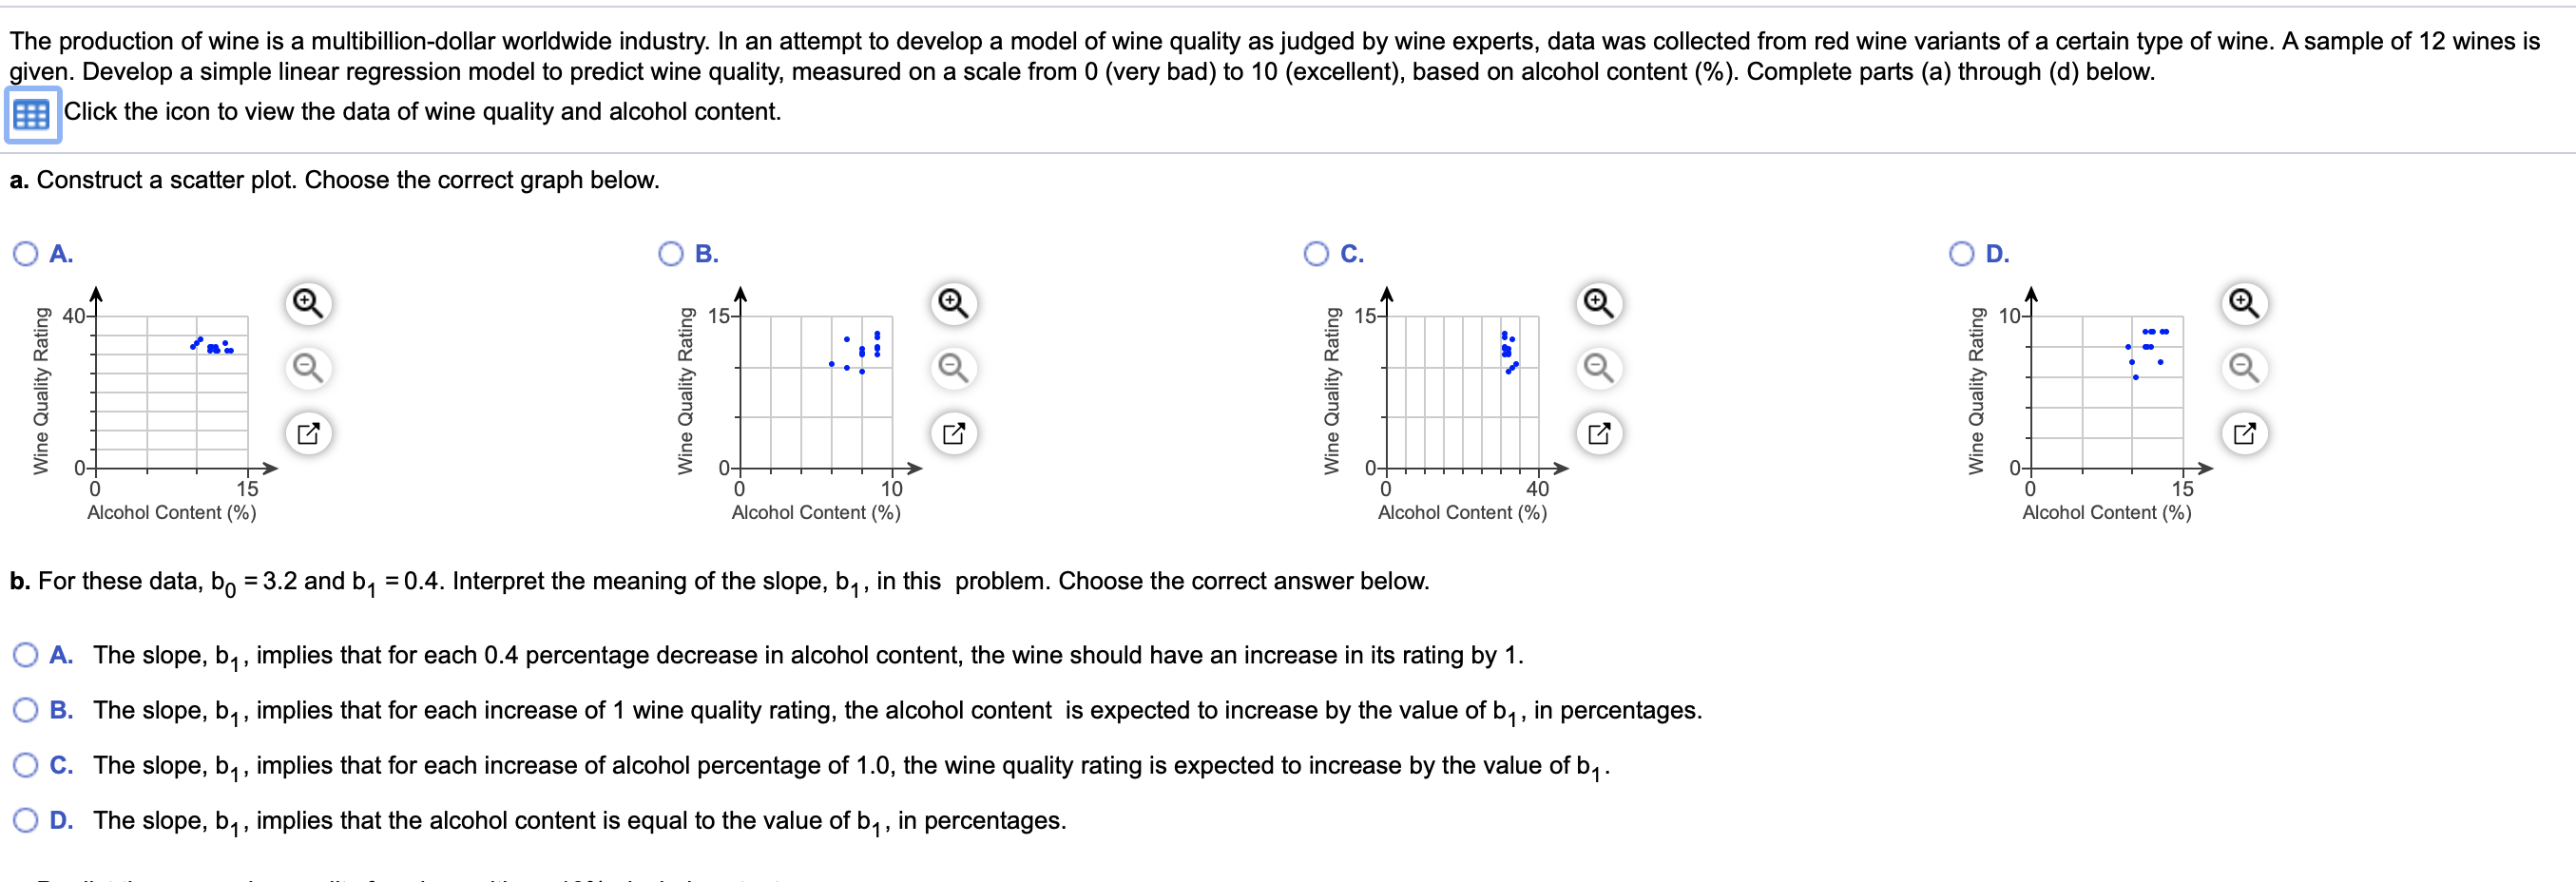
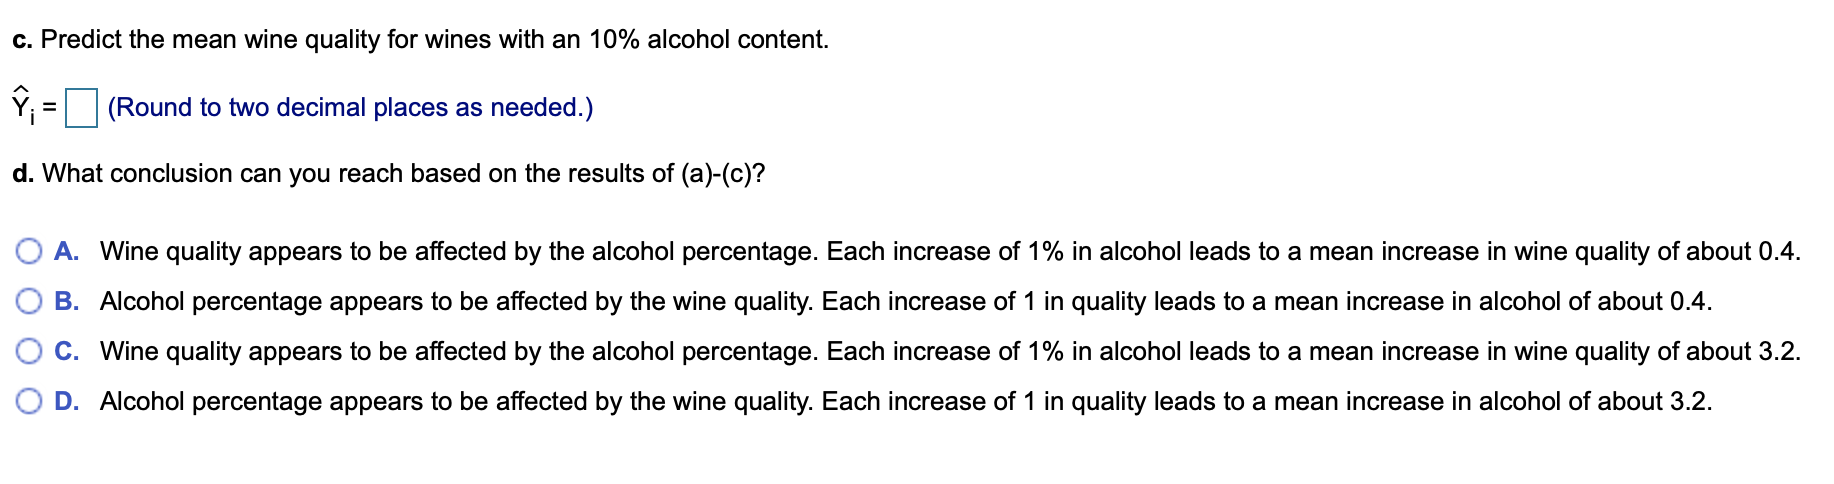
I have attached my question below fThe production of wine is a multibilliondollar worldwide industry. In an attempt to develop a model of wine quality

I have attached my question below

image text in transcribedimage text in transcribedimage text in transcribed
\fThe production of wine is a multibilliondollar worldwide industry. In an attempt to develop a model of wine quality asjudged by wine experts, data was collected from red wine variants of a certain type of wine. A sample of 12 wines is . Develop a simple linear regression model to predict wine quality, measured on a scale from 0 (very bad) to 10 (excellent), based on alcohol content (%). Complete parts (a) through (d) below. Click the icon to view the data of wine quality and alcohol content. a. Construct a scatter plot. Choose the correct graph below. 0 p O a QB. O ;> 01 I .-. 0 5i ' 'l l l A a A a a e. if; t +, a IIIvIIvy> o 15 0 1o 0 40 o 15 Alcohol Content (9.) Alcohol Content (%) Alcohol Content (/.,) Alcohol Content (%) Wlne Quality Rating r Wine Quality Rating Wine Quality Rating Wine Quality Rating 'P . 4! E o o I b. For these data, b0 = 3.2 and b1 = 0.4. Interpret the meaning of the slope, b1, in this problem. Choose the correct answer below. 0 A. The slope, b1, implies that for each 0.4 percentage decrease in alcohol content, the wine should have an increase in its rating by 1. O B. The slope, b1, implies that for each increase of 1 wine quality rating, the alcohol content is expected to increase by the value of b1, in percentages. O C. The slope, b1, implies that for each increase of alcohol percentage of 1.0, the wine quality rating is expected to increase by the value of b1. 0 D. The slope, b1, implies that the alcohol content is equal to the value of b1, in percentages. c. Predict the mean wine quality for wines with an 10% alcohol content. $i = D (Round to two decimal places as needed.) (I. What conclusion can you reach based on the results of (a)-(c)? O A. Wine quality appears to be affected by the alcohol percentage. Each increase of 1% in alcohol leads to a mean increase in wine quality of about 0.4. O B. Alcohol percentage appears to be affected by the wine quality. Each increase of 1 in quality leads to a mean increase in alcohol of about 0.4. O C. Wine quality appears to be affected by the alcohol percentage. Each increase of 1% in alcohol leads to a mean increase in wine quality of about 3.2. O D. Alcohol percentage appears to be affected by the wine quality. Each increase of 1 in quality leads to a mean increase in alcohol of about 3.2

Step by Step Solution

There are 3 Steps involved in it

Step: 1

blur-text-image

Get Instant Access to Expert-Tailored Solutions

See step-by-step solutions with expert insights and AI powered tools for academic success

Step: 2

blur-text-image

Step: 3

blur-text-image

Ace Your Homework with AI

Get the answers you need in no time with our AI-driven, step-by-step assistance

Get Started

Recommended Textbook for

Applied Linear Algebra

Authors: Peter J. Olver, Cheri Shakiban

1st edition

131473824, 978-0131473829

More Books

Students also viewed these Mathematics questions