Answered step by step
Verified Expert Solution
Question
1 Approved Answer
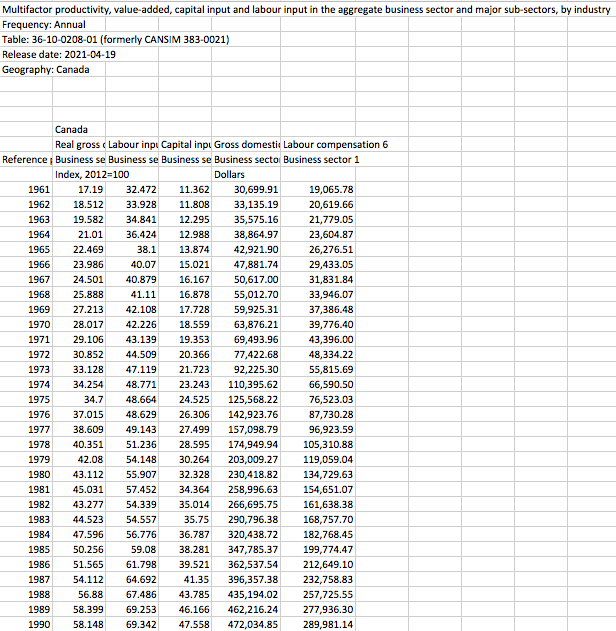
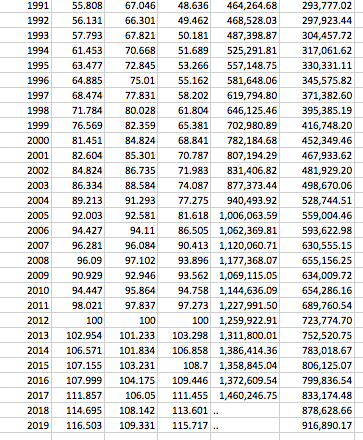
I have attached the data needed to complete the question. Thank you Multifactor productivity, value-added, capital input and labour input in the aggregate business sector


I have attached the data needed to complete the question. Thank you
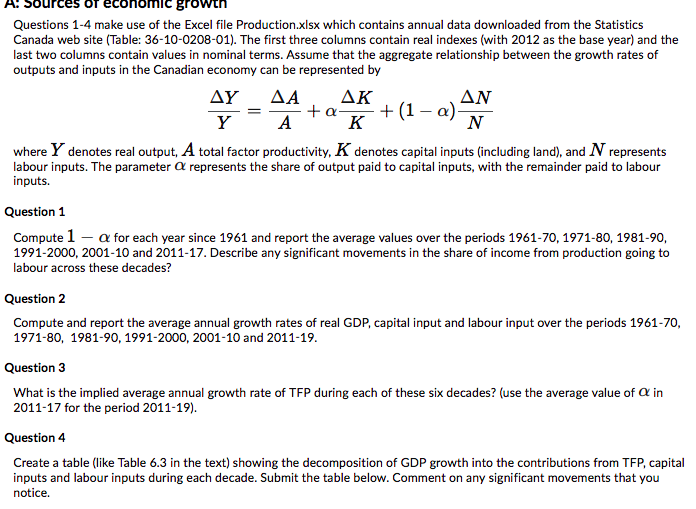
Multifactor productivity, value-added, capital input and labour input in the aggregate business sector and major sub-sectors, by industry Frequency: Annual Table: 36-10-0208-01 (formerly CANSIM 383-0021) Release date: 2021-04-19 Geography: Canada Canada Real gross e Labour inpi Capital inpl Gross domestie Labour compensation 6 Reference Business se Business se Business se Business secto Business sector 1 Index, 2012=100 Dollars 1961 17.19 32.472 11.362 30,699.91 19,065.78 1962 18.512 33.928 11.808 33,135.19 20,619.66 1963 19.582 34.841 12.295 35,575.16 21,779.05 1964 21.01 36.424 12.988 38,864.97 23,604.87 1965 22.469 38.1 13.874 42,921.90 26,276.51 1966 23.986 40.07 15.021 47,881.74 29,433.05 1967 24.501 40.879 16.167 50,617.00 31,831.84 1968 25.888 41.11 16.878 55,012.70 33,946.07 1969 27.213 42.108 17.728 59,925.31 37,386.48 1970 28.017 42.226 18.559 63,876.21 39,776.40 1971 29.106 43.139 19.353 69,493.96 43,396.00 1972 30.852 44.509 20.366 77,422.68 48,334.22 1973 33.128 47.119 21.723 92,225.30 55,815.69 1974 34.254 48.771 23.243 110,395.62 66,590.50 1975 34.7 48.664 24.525 125,568.22 76,523.03 1976 37.015 48.629 26.306 142,923.76 87,730.28 1977 38.609 49.143 27.499 157,098.79 96,923.59 1978 40.351 51.236 28.595 174,949.94 105,310.88 1979 42.08 54.148 30.264 203,009.27 119,059.04 1980 43.112 55.907 32.328 230,418.82 134,729.63 1981 45.031 57.452 34.364 258,996.63 154,651.07 1982 43.277 54.339 35.014 266,695.75 161,638.38 1983 44.523 54.557 35.75 290,796.38 168,757.70 1984 47.596 56.776 36.787 320,438.72 182,768.45 1985 50.256 59.08 38.281 347,785.37 199,774.47 1986 51.565 61.798 39.521 362,537.54 212,649.10 1987 54.112 64.692 41.35 396,357.38 232.758.83 1988 56.88 67.486 43.785 435,194.02 257,725.55 1989 58.399 69.253 46.166 462,216.24 277,936.30 1990 58.148 69.342 47.558 472,034.85 289,981.14 1991 1992 1993 1994 1995 1996 1997 1998 1999 2000 2001 2002 2003 2004 2005 2006 2007 2008 2009 2010 2011 2012 2013 2014 2015 2016 2017 2018 2019 55.808 56.131 57.793 61.453 63.477 64.885 68.474 71.784 76.569 81.451 82.604 84.824 86.334 89.213 92.003 94.427 96.281 96.09 90.929 94.447 98.021 100 102.954 106.571 107.155 107.999 111.857 114.695 116.503 67.046 66.301 67.821 70.668 72.845 75.01 77.831 80.028 82.359 84.824 85.301 86.735 88.584 91.293 92.581 94.11 96.084 97.102 92.946 95.864 97.837 100 101.233 101.834 103.231 104.175 106.05 108.142 109.331 48.636 464,264.68 49.462 468,528.03 50.181 487,398.87 51.689 525,291.81 53.266 557,148.75 55.162 581,648.06 58.202 619,794.80 61.804 646,125.46 65.381 702,980.89 68.841 782,184.68 70.787 807,194.29 71.983 831,406.82 74.087 877,373.44 77.275 940,493.92 81.618 1,006,063.59 86.505 1,062,369.81 90.413 1,120,060.71 93.896 1,177,368.07 93.562 1,069,115.05 94.758 1,144,636.09 97.273 1,227,991.50 100 1,259,922.91 103.298 1,311,800.01 106.858 1,386,414.36 108.7 1,358,845.04 109.446 1,372,609.54 111.455 1,460,246.75 113.601. 115.717 .. 293,777.02 297,923.44 304,457.72 317,061.62 330,331.11 345,575.82 371,382.60 395,385.19 416,748.20 452,349.46 467,933.62 481,929.20 498,670.06 528,744.51 559,004.46 593,622.98 630,555.15 655,156.25 634,009.72 654,286.16 689,760.54 723,774.70 752,520.75 783,018.67 806,125.07 799,836.54 833,174.48 878,628.66 916,890.17 of econ growth Questions 1-4 make use of the Excel file Production.xlsx which contains annual data downloaded from the Statistics Canada web site (Table: 36-10-0208-01). The first three columns contain real indexes (with 2012 as the base year) and the last two columns contain values in nominal terms. Assume that the aggregate relationship between the growth rates of outputs and inputs in the Canadian economy can be represented by AY AK AN +a +(1 a) Y A K N where Y denotes real output, A total factor productivity, K denotes capital inputs (including land), and N represents labour inputs. The parameter a represents the share of output paid to capital inputs, with the remainder paid to labour inputs. Question 1 Compute 1 - a for each year since 1961 and report the average values over the periods 1961-70, 1971-80, 1981-90, 1991-2000, 2001-10 and 2011-17. Describe any significant movements in the share of income from production going to labour across these decades? Question 2 Compute and report the average annual growth rates of real GDP, capital input and labour input over the periods 1961-70, 1971-80, 1981-90, 1991-2000, 2001-10 and 2011-19. Question 3 What is the implied average annual growth rate of TFP during each of these six decades? (use the average value of a in 2011-17 for the period 2011-19). Question 4 Create a table (like Table 6.3 in the text) showing the decomposition of GDP growth into the contributions from TFP, capital inputs and labour inputs during each decade. Submit the table below. Comment on any significant movements that you notice. Multifactor productivity, value-added, capital input and labour input in the aggregate business sector and major sub-sectors, by industry Frequency: Annual Table: 36-10-0208-01 (formerly CANSIM 383-0021) Release date: 2021-04-19 Geography: Canada Canada Real gross e Labour inpi Capital inpl Gross domestie Labour compensation 6 Reference Business se Business se Business se Business secto Business sector 1 Index, 2012=100 Dollars 1961 17.19 32.472 11.362 30,699.91 19,065.78 1962 18.512 33.928 11.808 33,135.19 20,619.66 1963 19.582 34.841 12.295 35,575.16 21,779.05 1964 21.01 36.424 12.988 38,864.97 23,604.87 1965 22.469 38.1 13.874 42,921.90 26,276.51 1966 23.986 40.07 15.021 47,881.74 29,433.05 1967 24.501 40.879 16.167 50,617.00 31,831.84 1968 25.888 41.11 16.878 55,012.70 33,946.07 1969 27.213 42.108 17.728 59,925.31 37,386.48 1970 28.017 42.226 18.559 63,876.21 39,776.40 1971 29.106 43.139 19.353 69,493.96 43,396.00 1972 30.852 44.509 20.366 77,422.68 48,334.22 1973 33.128 47.119 21.723 92,225.30 55,815.69 1974 34.254 48.771 23.243 110,395.62 66,590.50 1975 34.7 48.664 24.525 125,568.22 76,523.03 1976 37.015 48.629 26.306 142,923.76 87,730.28 1977 38.609 49.143 27.499 157,098.79 96,923.59 1978 40.351 51.236 28.595 174,949.94 105,310.88 1979 42.08 54.148 30.264 203,009.27 119,059.04 1980 43.112 55.907 32.328 230,418.82 134,729.63 1981 45.031 57.452 34.364 258,996.63 154,651.07 1982 43.277 54.339 35.014 266,695.75 161,638.38 1983 44.523 54.557 35.75 290,796.38 168,757.70 1984 47.596 56.776 36.787 320,438.72 182,768.45 1985 50.256 59.08 38.281 347,785.37 199,774.47 1986 51.565 61.798 39.521 362,537.54 212,649.10 1987 54.112 64.692 41.35 396,357.38 232.758.83 1988 56.88 67.486 43.785 435,194.02 257,725.55 1989 58.399 69.253 46.166 462,216.24 277,936.30 1990 58.148 69.342 47.558 472,034.85 289,981.14 1991 1992 1993 1994 1995 1996 1997 1998 1999 2000 2001 2002 2003 2004 2005 2006 2007 2008 2009 2010 2011 2012 2013 2014 2015 2016 2017 2018 2019 55.808 56.131 57.793 61.453 63.477 64.885 68.474 71.784 76.569 81.451 82.604 84.824 86.334 89.213 92.003 94.427 96.281 96.09 90.929 94.447 98.021 100 102.954 106.571 107.155 107.999 111.857 114.695 116.503 67.046 66.301 67.821 70.668 72.845 75.01 77.831 80.028 82.359 84.824 85.301 86.735 88.584 91.293 92.581 94.11 96.084 97.102 92.946 95.864 97.837 100 101.233 101.834 103.231 104.175 106.05 108.142 109.331 48.636 464,264.68 49.462 468,528.03 50.181 487,398.87 51.689 525,291.81 53.266 557,148.75 55.162 581,648.06 58.202 619,794.80 61.804 646,125.46 65.381 702,980.89 68.841 782,184.68 70.787 807,194.29 71.983 831,406.82 74.087 877,373.44 77.275 940,493.92 81.618 1,006,063.59 86.505 1,062,369.81 90.413 1,120,060.71 93.896 1,177,368.07 93.562 1,069,115.05 94.758 1,144,636.09 97.273 1,227,991.50 100 1,259,922.91 103.298 1,311,800.01 106.858 1,386,414.36 108.7 1,358,845.04 109.446 1,372,609.54 111.455 1,460,246.75 113.601. 115.717 .. 293,777.02 297,923.44 304,457.72 317,061.62 330,331.11 345,575.82 371,382.60 395,385.19 416,748.20 452,349.46 467,933.62 481,929.20 498,670.06 528,744.51 559,004.46 593,622.98 630,555.15 655,156.25 634,009.72 654,286.16 689,760.54 723,774.70 752,520.75 783,018.67 806,125.07 799,836.54 833,174.48 878,628.66 916,890.17 of econ growth Questions 1-4 make use of the Excel file Production.xlsx which contains annual data downloaded from the Statistics Canada web site (Table: 36-10-0208-01). The first three columns contain real indexes (with 2012 as the base year) and the last two columns contain values in nominal terms. Assume that the aggregate relationship between the growth rates of outputs and inputs in the Canadian economy can be represented by AY AK AN +a +(1 a) Y A K N where Y denotes real output, A total factor productivity, K denotes capital inputs (including land), and N represents labour inputs. The parameter a represents the share of output paid to capital inputs, with the remainder paid to labour inputs. Question 1 Compute 1 - a for each year since 1961 and report the average values over the periods 1961-70, 1971-80, 1981-90, 1991-2000, 2001-10 and 2011-17. Describe any significant movements in the share of income from production going to labour across these decades? Question 2 Compute and report the average annual growth rates of real GDP, capital input and labour input over the periods 1961-70, 1971-80, 1981-90, 1991-2000, 2001-10 and 2011-19. Question 3 What is the implied average annual growth rate of TFP during each of these six decades? (use the average value of a in 2011-17 for the period 2011-19). Question 4 Create a table (like Table 6.3 in the text) showing the decomposition of GDP growth into the contributions from TFP, capital inputs and labour inputs during each decade. Submit the table below. Comment on any significant movements that you noticeStep by Step Solution
There are 3 Steps involved in it
Step: 1

Get Instant Access to Expert-Tailored Solutions
See step-by-step solutions with expert insights and AI powered tools for academic success
Step: 2

Step: 3

Ace Your Homework with AI
Get the answers you need in no time with our AI-driven, step-by-step assistance
Get Started


