I Have attached the math word problems as an attachment, thank you for your help
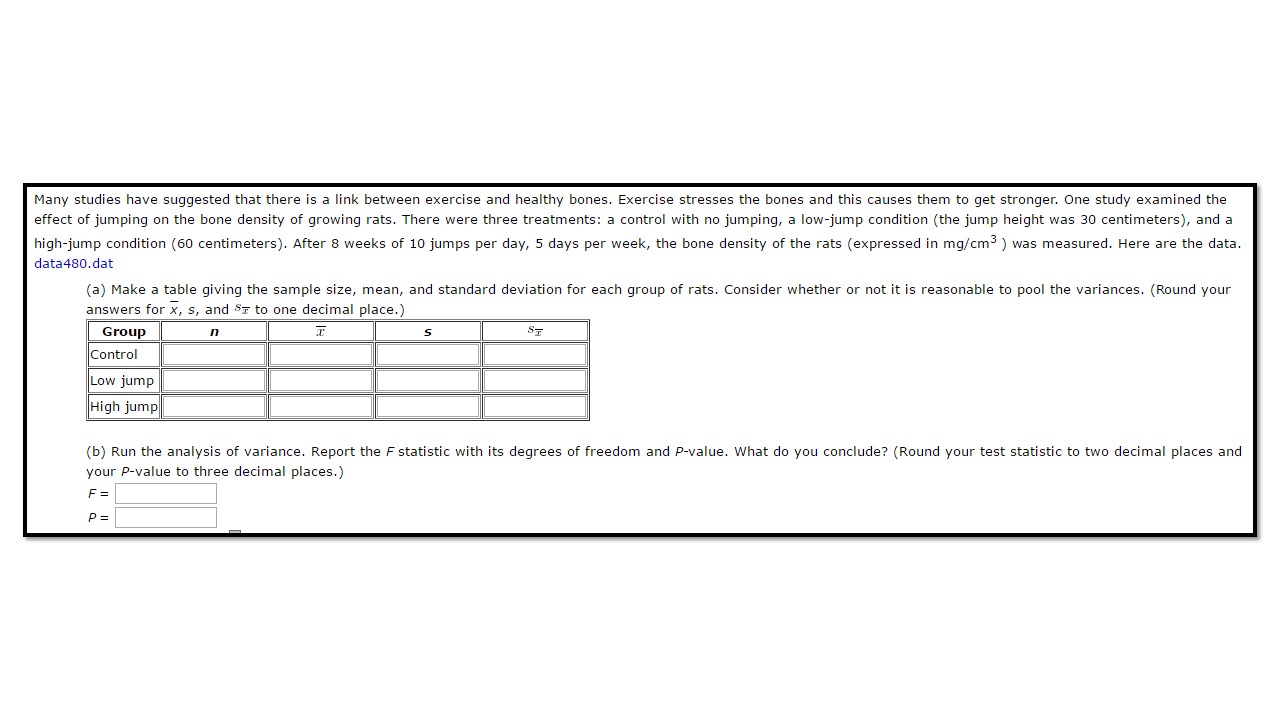
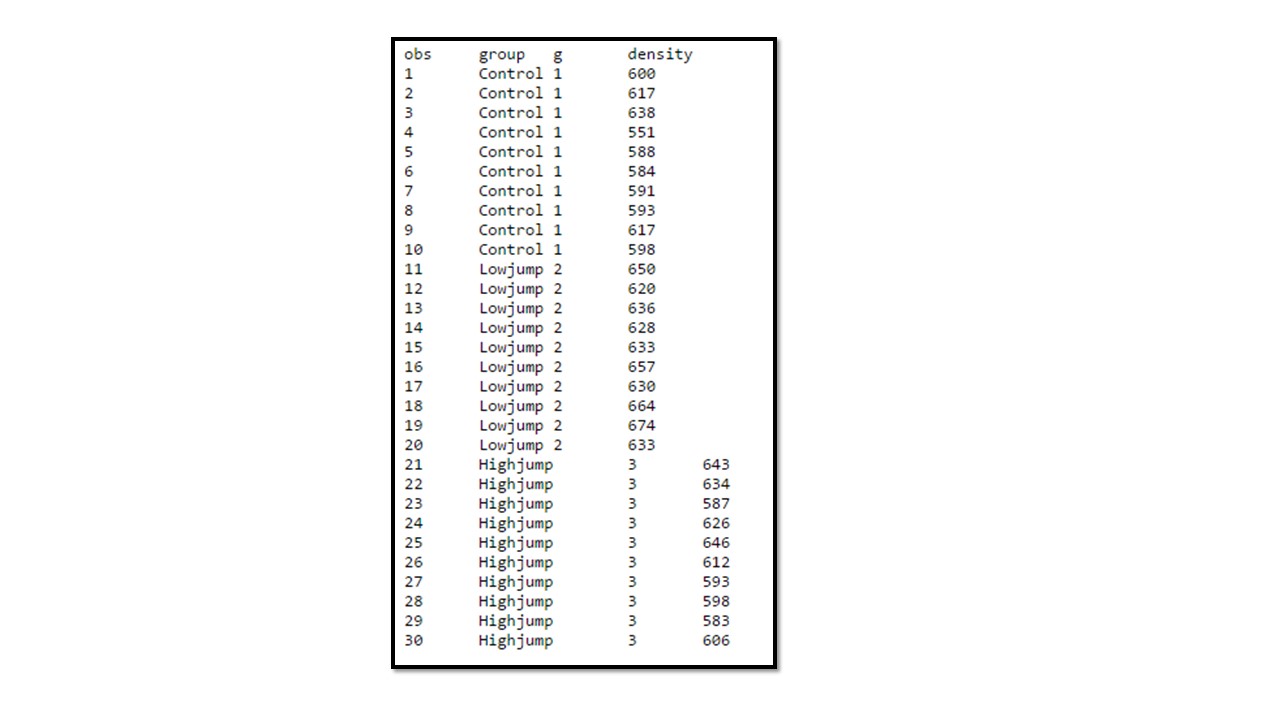
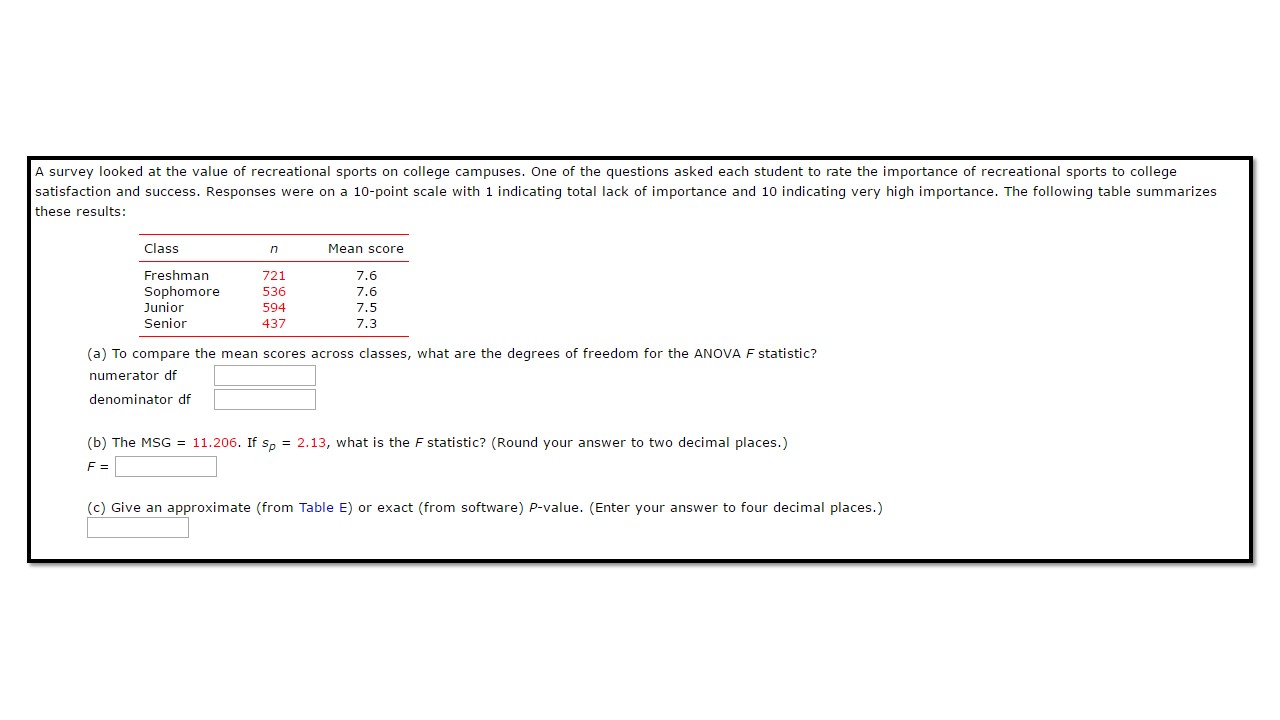
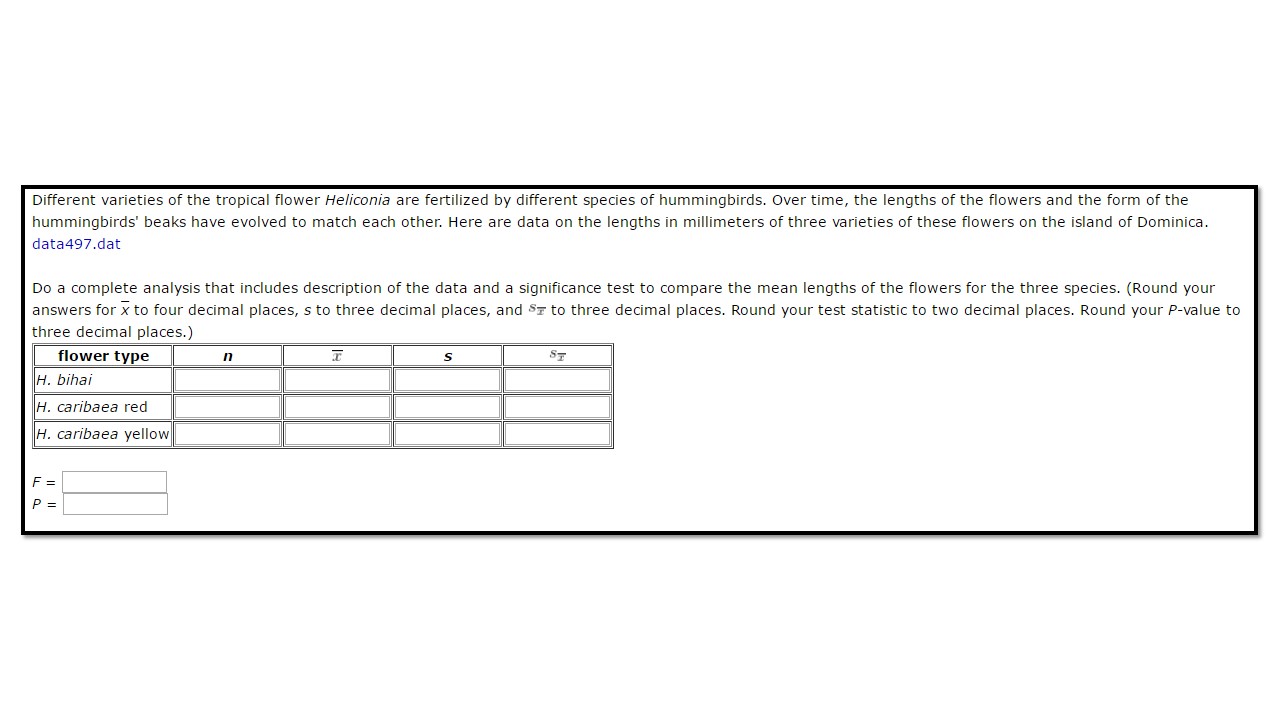
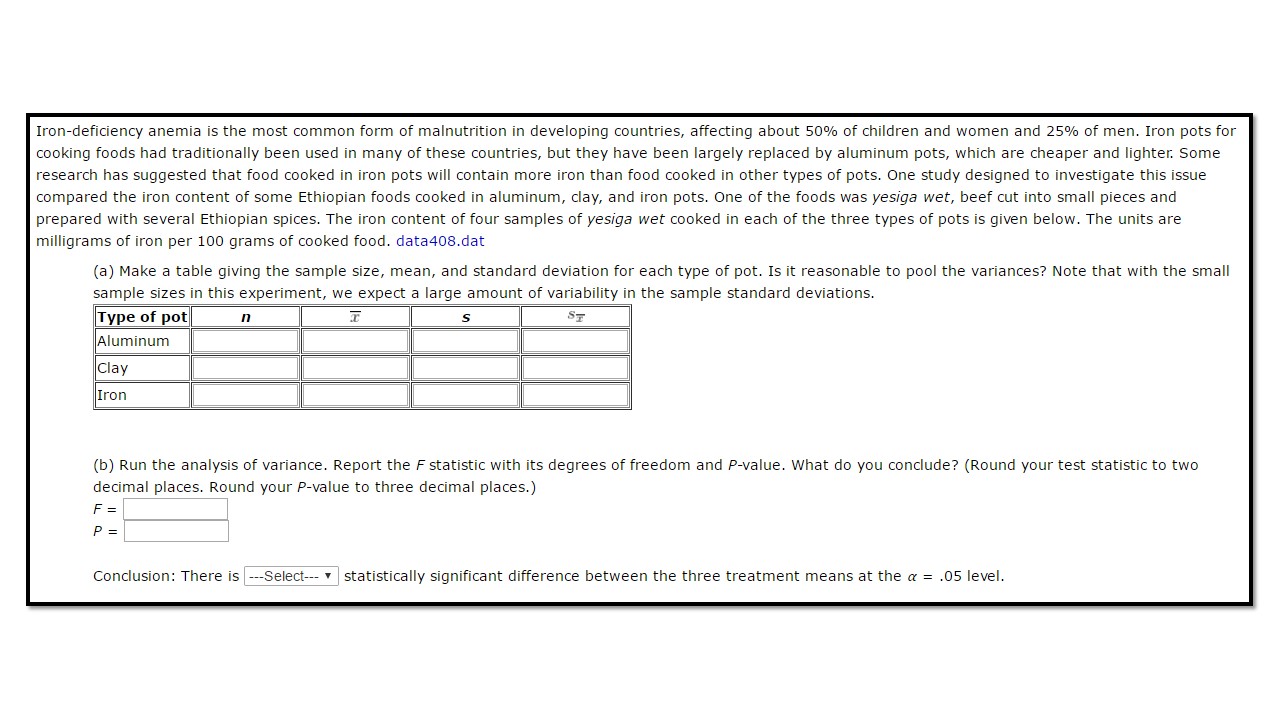
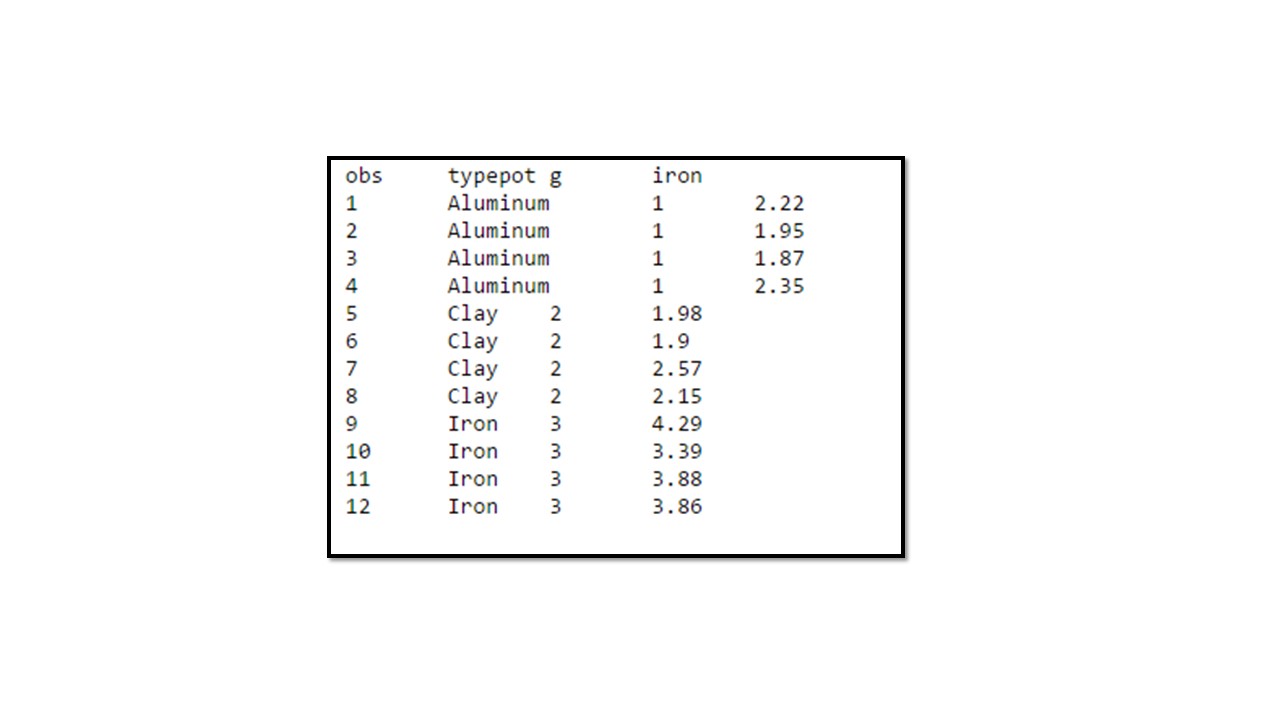
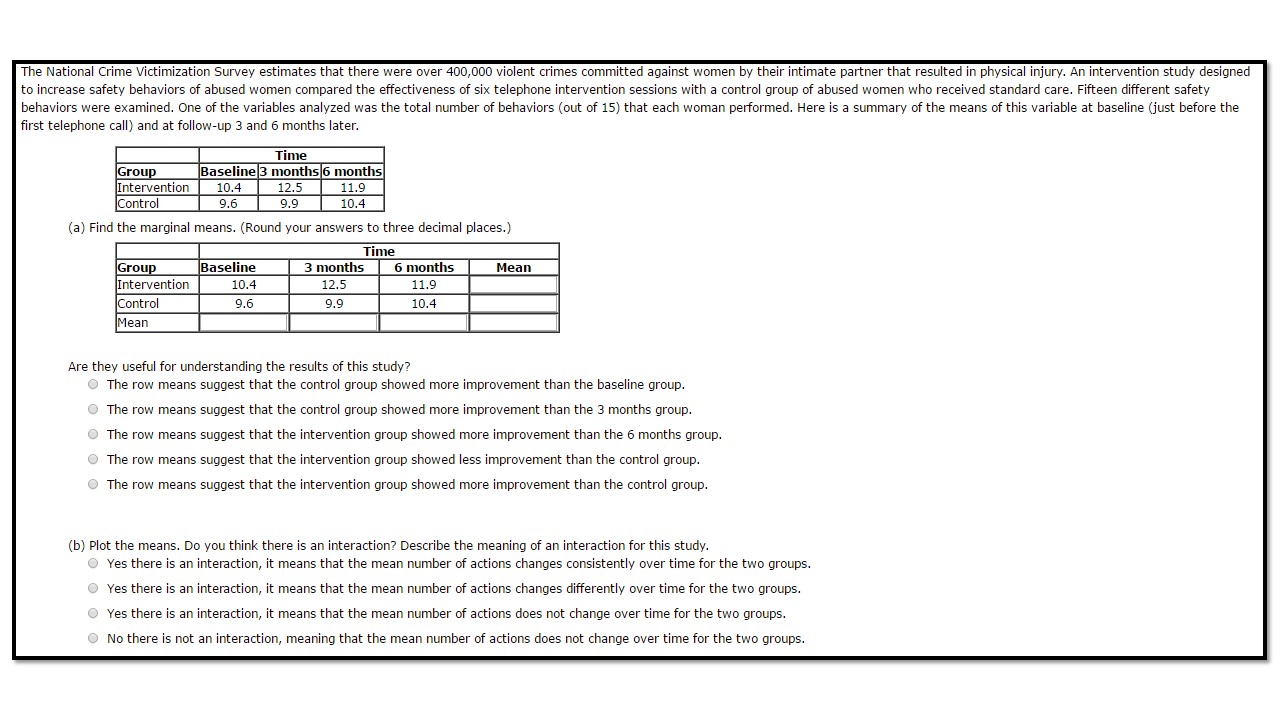
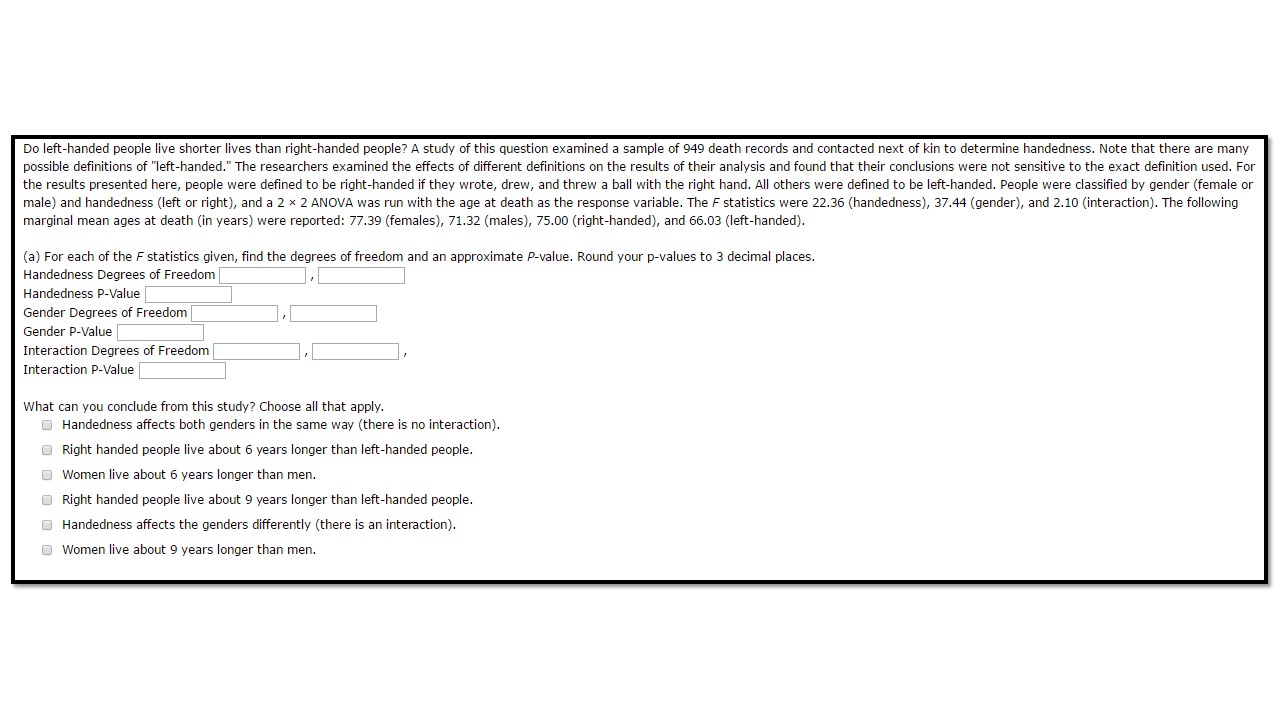
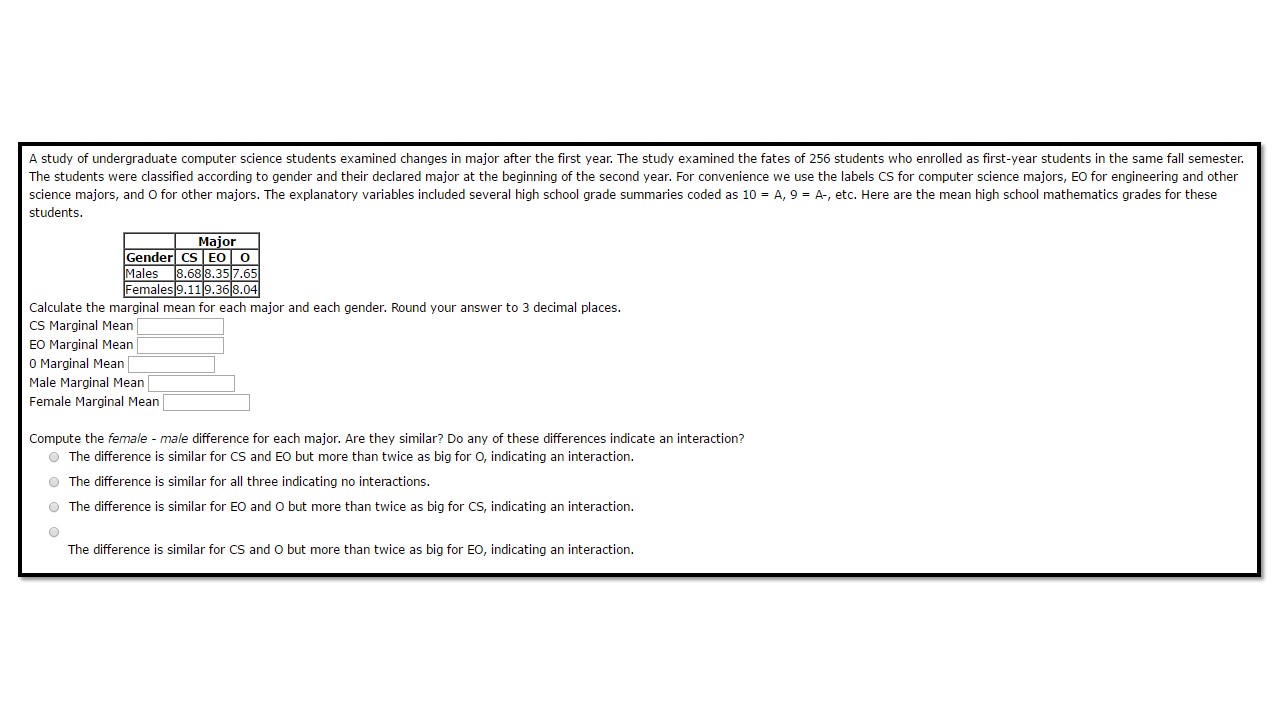
Many studies have suggested that there is a link between exercise and healthy bones. Exercise stresses the bones and this causes them to get stronger. One study examined the effect of jumping on the bone density of growing rats. There were three treatments: a control with no jumping, a low-jump condition (the jump height was 30 centimeters), and a high-jump condition (60 centimeters). After 8 weeks of 10 jumps per day, 5 days per week, the bone density of the rats {expressed in mg,"cm3 ) was measured. Here are the data. data480.dat (a) Make a table giving the sample size, mean, and standard deviation for each group of rats. Consider whether or not it is reasonable to pool the variances. (Round your answers for i s, and SE to one decimal place.) Group 11 E SE Control Low jump High jump (b) Run the analysis of variance. Report the Fstatistic with its degrees of freedom and Pivalue. What do you conclude? (Round your test statistic to two decimal places and your P-value to three decimal places.) ouummhwmlIo U' VI group Control Control Control Control Control Control Control Control Control Control Lowjump Lowjump Lowjump Lowjump Lowjump Loujump Lowjump Lowjump Lowjump Lowjump Highjump Highjump Highjump Highjump Highjump Highjump Highjump Highjump Highjump Highjump NMMNNMNMNNHHHIIHHHHHHCM density 698 617 638 551 5 88 5 84 591 5 9 3 61? 5 98 650 628 636 628 633 657 636 664 674 633 UJ UWWWWWWWW A survey looked at the value of recreational sports on college campuses. One of the questions asked each student to late the importance of recreational sports to college satisfaction and success. Responses were on a 10-point scale with 1 indicating total lack of importance and 10 indicating very high importance. The following table summarizes these results: Class n Mean score Freshman 721 7.6 Sophomore 536 76 Junior 594 75 Senior 437 7.3 (a) To compare the mean scores across classes, what are the degrees of freedom for the ANOVA Fstatistic? numerator cif denominator of (b) The MSG = 11.206. If 5,, = 2.13, what is the Fstatistic? (Round your answer to two decimal places.) F: (c) Give an approximate (from Table E) or exact (from software) P-value. (Enter your answer to four decimal places.) \fvariety bihai bihai bihai bihai bihai bihai bihai bihai bihai bihai bihai bihai bihai bihai bihai bihai red red red red red red red red red red red red red red red red red red red red red red red yellow yellow yellow yellow yellow yellow yellow yellow yellow yellow yellow yellow yellow yellow yellow length 48.37 48.57 47.05 46.48 48.24 48.12 51 46.85 46.42 47.88 47.03 48.16 49.77 48.32 47.79 49.97 39.68 40.91 37.27 38.77 40.22 41.43 41.15 37.02 39.32 37.21 39.62 36.44 39.81 37.74 41.14 41.17 41.21 39.58 42.03 38.76 41.37 39.9 42.12 35.96 34.9 35.19 37.53 37.03 33.28 36.6 36.62 35.62 34.81 35.1 34.7 37.27 36.07 35.15 Different varieties of the tropical ower Helicom'a are fertilized by different species of hummingbirds. Over time, the lengths of the owers and the form of the hummingbirds' beaks have evolved to match each other. Here are data on the lengths in millimeters of three varieties ofthese owers on the island of Dominica. data497.dat Do a complete analysis that includes description of the data and a signicance test to compare the mean lengths of the owers for the three species. (Round your answers for to four decimal places, 5 to three decimal places, and 51" to three decimal places. Round your test statistic to two decimal places. Round your Prvalue to three decimal places.) flower type I 52 H. bmar H. samba ea red H. caribaea yellow Irondeciency anemia is the most common form of malnutrition in developing countries, affecting about 50% of children and women and 25% of men. Iron pots for cooking foods had traditionally been used in many of these countries, but they have been largely replaced by aluminum pots, which are cheaper and lighter. Some research has suggested that food cooked in iron pots will contain more iron than food cooked in other types of pots. One study designed to investigate this issue compared the iron content of some Ethiopian foods cooked in aluminum, clay, and iron pots. One ofthe foods was yesiga wet, beef cut into small pieces and prepared with several Ethiopian spices. The iron content of four samples of yesrga wet cooked in each of the three types of pots is given below. The units are milligrams of iron per ll] grams of cooked food. data4nB.dat (a) Make a table giving the sample size, mean, and standard deviation for each type of pot. Is it reasonable to pool the variances? Note that with the small sample sizes in this experiment, we expect a large amount of variability in the sample standard deviations. Type of pot n E 5 Sir Aluminum Clay Iron (b) Run the analysis of variance. Report the F statistic with its degrees of freedom and Pvalue. What do you conclude? (Round your test statistic to two decimal places. Round your Pvalue to three decimal places.) Conclusion: There is statistically signicant difference between the three treatment means at the a = .05 level. o 1 2 3 4 5 6 7 8 9 1 tYPEP0t 3 Aluminum Aluminum Aluminum Aluminum Clay Clay Clay Clay Iron Iron Iron Iron WWWWHNNN \"JIM uu :5 ha ha ha ha pa ha ha pi H W o . U'l . WNHU'IKDKD 'Id '0 G300 GM 0 The National Crime Victimization Survey estimates that there were over Anoooo violent crimes committed against women by their intimate partner that resulted in physical injury. An intervention study designed to increase safety behaviors of abused women compared the effectiveness of six telephone intervention sessions with a control group of abused women who received standard care. Fifteen different safety behaviors were examined. One ofthe variables analyzed was the total number of behaviors (out of 15) that each woman performed. Here is a summary ofthe means ofthis vanable at baseline (just before the rst telephone call) and at follow-up 3 and 6 months later. _ mmm \"15- (a) Find the marginal means. (Round your answers to three decimal places.) mmmm | _\"'E- | mllll Are they useful for understanding the results ofthis study? 0 The raw means suggest that the control group showed more improvement than the baseline group. O The row means suggest that the control group showed more improvement than the 3 months group. O The row means suggest that the intervention group showed more improvement than the 6 months group. O The row means suggest that the intervention group showed less improvement than the control group. O The row means suggest that the intervention group showed more improvement than the control group. (b) Plot the means. Do you think there is an interaction? Describe the meaning of an interaction for this study. 0 Yes there is an interaction. it means that the mean number of actions changes consistently over time for the two groups. 0 Yes there is an interaction. it means that the mean number of actions changes differently over time for the two groups. 0 Yes there is an interaction, it means that the mean number of actions does not change over time for the two groups. 0 No there is not an interaction, meaning that the mean number of actions does not change over time for the two groups. Do left-handed people live shorter lives than right-handed people? A study ofthis question examined a sample of 949 death records and contacted next of kin to determine handedness. Note that there are many possible denitions of "lefthanded." 111e researchers examined the effects of different denitions on the results oftheir analysis and found that their conclusions were not sensitive to the exact denition used. For the results presented here, people were dened to be ght-handed if they wrote, drew, and threw a ball with the ght hand. All others were dened to be lefthanded. People were classied by gender (female or male) and handedness (left or right), and a 2 I 2 ANOVA was run with the age at death as the response variable. 'I1Ie F statistics were 22.36 (handedness), 37.44 (gender), and 2.10 (interaction). We following marginal mean ages at death (in years) were reported: 77.39 (females). 71.32 (males). 75.00 (rightihanded), and 65.03 (leftihanded). (a) For each ofthe F statistics given, nd the degrees offreedom and an approximate Pivalue. Round your pivalues to 3 decimal places. Handedness Degrees of Freedom , Handedness Pivalue Gender Degrees of Freedom Gender P-Value Interaction Degrees of Freedom Interaction PM: ue what can you conclude from this study? Choose a I that apply. Handedness aects both genders in the same way (there is no interaction). Right handed people live about 6 years longer than left-handed people. Women live about 6 years longer than men. Right handed people live about 9 years longer than leftihanded people. Handedness affects the genders differently (there is an interaction). Women live about 9 years longer than men. A study of undergraduate computer science students examined changes in major after the rst year. The study examined the fates of 256 students who enrolled as rst-year students in the same fall semester. 111e students were classied according to gender and their declared major at the beginning ofthe second year. For convenience we use the labels CS for computer science majors, E0 for engineering and other science majors. and 0 for other majors. 111e explanatory variables included several high school grade summaries coded as 10 = A, 9 = A. etc. Here are the mean high school mathematics grades for these students. Calculate the marginal mean for each major and each gender. Round your answer to El decimal places. CS Marginal Mean E0 Marginal Mean CI Marginal Mean Male Marginal Mean Female Marginal Mean Compute the fermle 7 male difference for each major. Are they similar? Do any ofthese differences indicate an interaction? 0 1119 dierence is similar for CS and E0 but more than twice as big for 0, indicating an interaction. 0 1119 dierence is similar for all three indicating no interactions. 0 111e difference is similar for E0 and 0 but more than twice as big for CSI indicating an interaction. 0 111a difference is similar for CS and 0 but more than twice as big for E0, indicating an interaction. Question 2: Group Control Low Jump High Jump n 10 10 10 Xbar 597.7 642.5 612.8 S 544.9 312.9 538.8 Sxbar 172.3 99.0 170.4 F = 11.16 P = 0.000 Question 3: a. 3, 2284 b. 2.47 c. 0.0602 Question 4: Groups bihai n 16 red 23 yellow 15 xbar 48.126 3 39.733 5 35.722 0 S 1.630 S-xbar 0.408 2.869 0.598 1.332 0.344 F = 304.09 P = 0.000 Question 5: Groups Aluminu m Clay Iron F = 43.56 P = 0.000 n 4 xbar 2.0975 S 0.0508 S-xbar 0.0254 4 4 2.1500 3.8550 0.0893 0.1354 0.0446 0.0677 There is a statistically Question 6: Group Interventio n Control Mean Baseline 10.4 3 months 12.5 6 months 11.9 Mean 11.600 9.6 10.000 9.9 11.200 10.4 11.150 9.967 10.783 Option 5 Option 4 Question 7: 1, 945, 0.000 1, 945, 0.000 1, 945, 0.148 Option 1, Option 3; Option 4; Question 8: 8.895; 8.855; 7.845; 8.227; 8.837 Option 4 Question 2: Group Control Low Jump High Jump n 10 10 10 Xbar 597.7 642.5 612.8 S 23.3 17.7 23.2 S 1.277 S-xbar 0.319 1.694 0.353 1.154 0.298 F = 11.16 P = 0.000 Question 3: a. 3, 2284 b. 2.47 c. 0.0602 Question 4: Groups bihai n 16 red 23 yellow 15 xbar 48.126 3 39.733 5 35.722 0 F = 304.09 P = 0.000 Question 5: Groups Aluminu m Clay Iron F = 43.56 P = 0.000 n 4 xbar 2.0975 S 0.2253 S-xbar 0.1126 4 4 2.1500 3.8550 0.2988 0.3679 0.1494 0.1840 S-xbar 7.4 5.6 7.3 There is a statistically Question 6: Group Interventio n Control Mean Baseline 10.4 3 months 12.5 6 months 11.9 Mean 11.600 9.6 10.000 9.9 11.200 10.4 11.150 9.967 10.783 Option 5 Option 4 Question 7: 1, 945, 0.000 1, 945, 0.000 1, 945, 0.148 Option 1, Option 3; Option 4; Question 8: 8.895; 8.855; 7.845; 8.227; 8.837 Option 4 Question 2: Group Control Low Jump High Jump n 10 10 10 Xbar 597.7 642.5 612.8 S 544.9 312.9 538.8 Sxbar 172.3 99.0 170.4 F = 11.16 P = 0.000 Question 3: a. 3, 2284 b. 2.47 c. 0.0602 Question 4: Groups bihai n 16 red 23 yellow 15 xbar 48.126 3 39.733 5 35.722 0 S 1.630 S-xbar 0.408 2.869 0.598 1.332 0.344 F = 304.09 P = 0.000 Question 5: Groups Aluminu m Clay Iron F = 43.56 P = 0.000 n 4 xbar 2.0975 S 0.0508 S-xbar 0.0254 4 4 2.1500 3.8550 0.0893 0.1354 0.0446 0.0677 There is a statistically Question 6: Group Interventio n Control Mean Baseline 10.4 3 months 12.5 6 months 11.9 Mean 11.600 9.6 10.000 9.9 11.200 10.4 11.150 9.967 10.783 Option 5 Option 4 Question 7: 1, 945, 0.000 1, 945, 0.000 1, 945, 0.148 Option 1, Option 3; Option 4; Question 8: 8.895; 8.855; 7.845; 8.227; 8.837 Option 4 Question 2: Group Control Low Jump High Jump n 10 10 10 Xbar 597.7 642.5 612.8 S 23.3 17.7 23.2 S 1.277 S-xbar 0.319 1.694 0.353 1.154 0.298 F = 11.16 P = 0.000 Question 3: a. 3, 2284 b. 2.47 c. 0.0602 Question 4: Groups bihai n 16 red 23 yellow 15 xbar 48.126 3 39.733 5 35.722 0 F = 304.09 P = 0.000 Question 5: Groups Aluminu m Clay Iron F = 43.56 P = 0.000 n 4 xbar 2.0975 S 0.2253 S-xbar 0.1126 4 4 2.1500 3.8550 0.2988 0.3679 0.1494 0.1840 S-xbar 7.4 5.6 7.3 There is a statistically Question 6: Group Interventio n Control Mean Baseline 10.4 3 months 12.5 6 months 11.9 Mean 11.600 9.6 10.000 9.9 11.200 10.4 11.150 9.967 10.783 Option 5 Option 4 Question 7: 1, 945, 0.000 1, 945, 0.000 1, 945, 0.148 Option 1, Option 3; Option 4; Question 8: 8.895; 8.855; 7.845; 8.227; 8.837 Option 4
