

Question
I have loaded a shapefile into r studio and used the plot function to plot the polygons representing different counties. When I go to label
I have loaded a shapefile into r studio and used the plot function to plot the polygons representing different counties.
When I go to label the polygons with ordered numbers 1-28, the label appear but they are stacked in certain areas.
Is there anything I can do to so the number labels aren't stacked?
I've included a copy of my code and screenshot of my plot below.
#Label Featuresas.data.frame(p)p$value 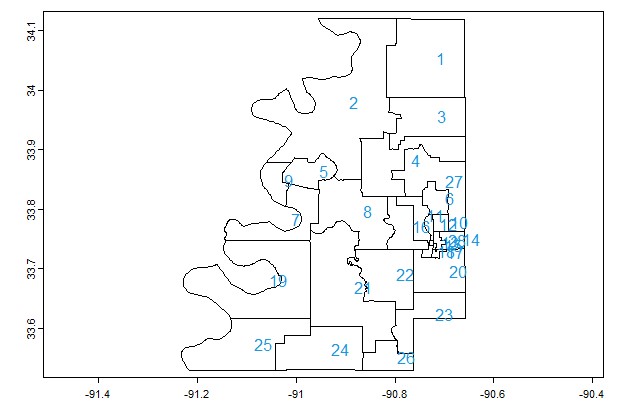
Step by Step Solution
There are 3 Steps involved in it
Step: 1

Get Instant Access to Expert-Tailored Solutions
See step-by-step solutions with expert insights and AI powered tools for academic success
Step: 2

Step: 3
Ace Your Homework with AI
Get the answers you need in no time with our AI-driven, step-by-step assistance
Get Started
Variational Inequalities And Frictional Contact Problems
Authors: Anca Capatina
1st Edition
3319101633, 9783319101637