

Answered step by step
Verified Expert Solution
Question
1 Approved Answer
I have provided the coding for part a and b . All I need the PLOT GRAPH IMAGE with the correct lables. I will rate
I have provided the coding for part a and b All I need the PLOT GRAPH IMAGE with the correct lables. I will rate if provided what I asked for.A lot can go wrong when recording a patients ECG. If the electrode patches on the skin are not sufficiently conductive, then the measured signal will be poor. If the patches are placed in the wrong locations, then the amplitude of the signal may be too small to be of any value. Alternatively, if the patches are placed in opposite locations, the signal will be flipped upsidedown. Understanding how best to correct for these and other challenges will improve your ability to diagnose and process any sort of signal, biological or otherwise.
You are provided with a poorquality ECG recording that is stored in the data file named badECG.txt which you can download from Canvas. The sampling rate is Hz for three seconds. The data is poor in these ways: there is an unwanted DC offset, the data is flipped upsidedown, and the recorded signal level is too low.
a Your task is to write a new script that reads badECG.txt and processes the poor signal data into something that looks more like a good ECG. Do this by performing the following:
o Remove the DC offset
o Invert the waveform
o Proportionally amplify the signal so that the highest peak is approximately at the mV level
b On the same fully labeled graph, plot both the original bad signal and your improved signal versus the time not index You need to show the full three seconds of recorded data on the graph.
Copy and paste your image here.
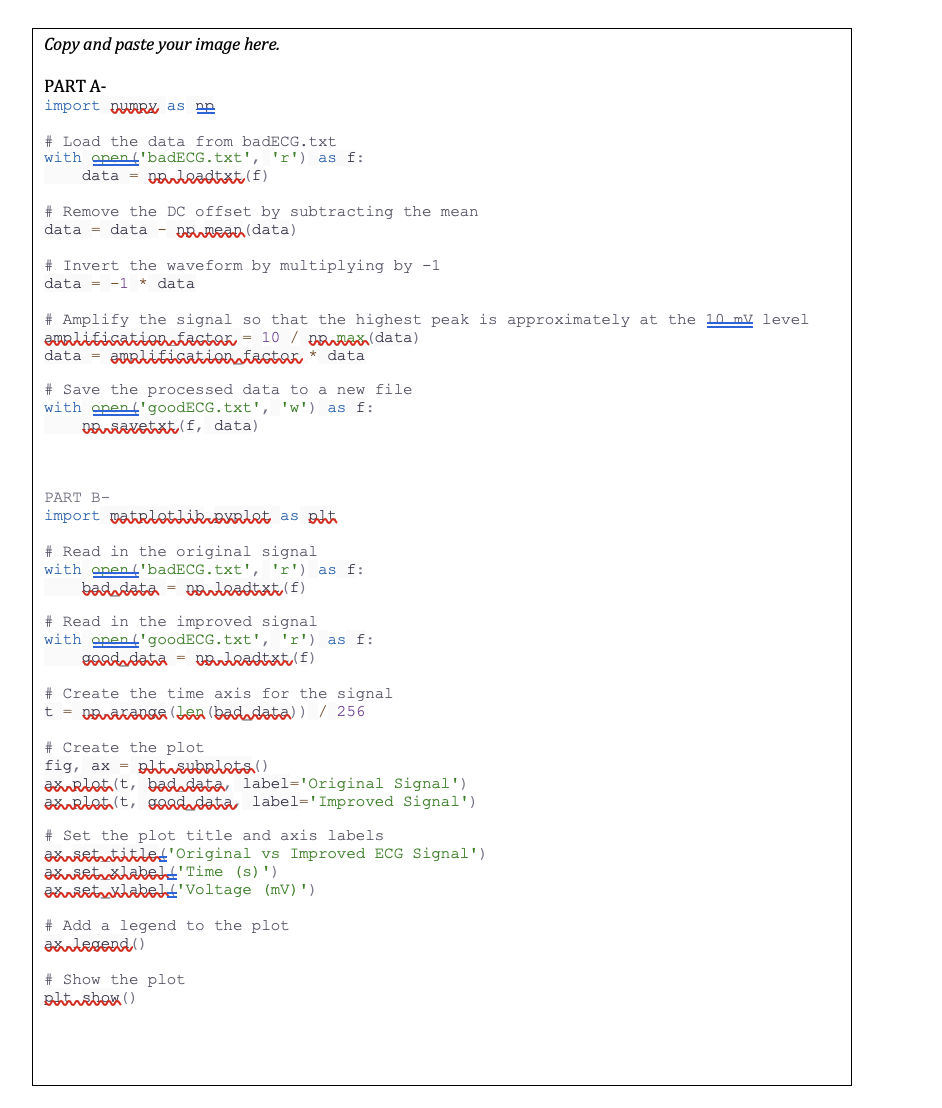
PART A
import numRa as na
# Load the data from badECG.txt
with pen badECGtxtr as :
data nouleadtxte f
# Remove the DC offset by subtracting the mean
data data naneara data
# Invert the waveform by multiplying by
data data
# Amplify the signal so that the highest peak is approximately at the level
amalificationfactor nawas data
data analificationafatar data
# Save the processed data to a new file
with pen goodECGtxtw as :
naviatetrat f data
PART B
# Read in the original signal
with pen badECGtxtr as :
badndata neuleadtxti
# Read in the improved signal
with pen goodECGtxtr as :
gardata narleadtxtu
# Create the time axis for the signal
parana ban badndata
# Create the plot
fig, ax btusubalats
axrrlatt badndata, label'Original Signal'
axrilotit gaoddata label'Improved Signal'
# Set the plot title and axis labels
axvietutitulet'Original vs Improved ECG Signal'
axvietuxlabelt'Time s
axurituklabelt' Voltage mV
# Add a legend to the plot
axulegend
# Show the plot
adinsbaw
Step by Step Solution
There are 3 Steps involved in it
Step: 1

Get Instant Access to Expert-Tailored Solutions
See step-by-step solutions with expert insights and AI powered tools for academic success
Step: 2

Step: 3
Ace Your Homework with AI
Get the answers you need in no time with our AI-driven, step-by-step assistance
Get Started
Statistical And Scientific Database Management Fifth International Conference V Ssdbm Charlotte N C Usa April 3 5 1990 Proceedings Lncs 420
Authors: Zbigniew Michalewicz
1st Edition
3540523421, 978-3540523420