Question: I have python homework. Please help me to solve it and can you share also code text please.(only File IO,string formatting,numpy and numpy functions, engineering
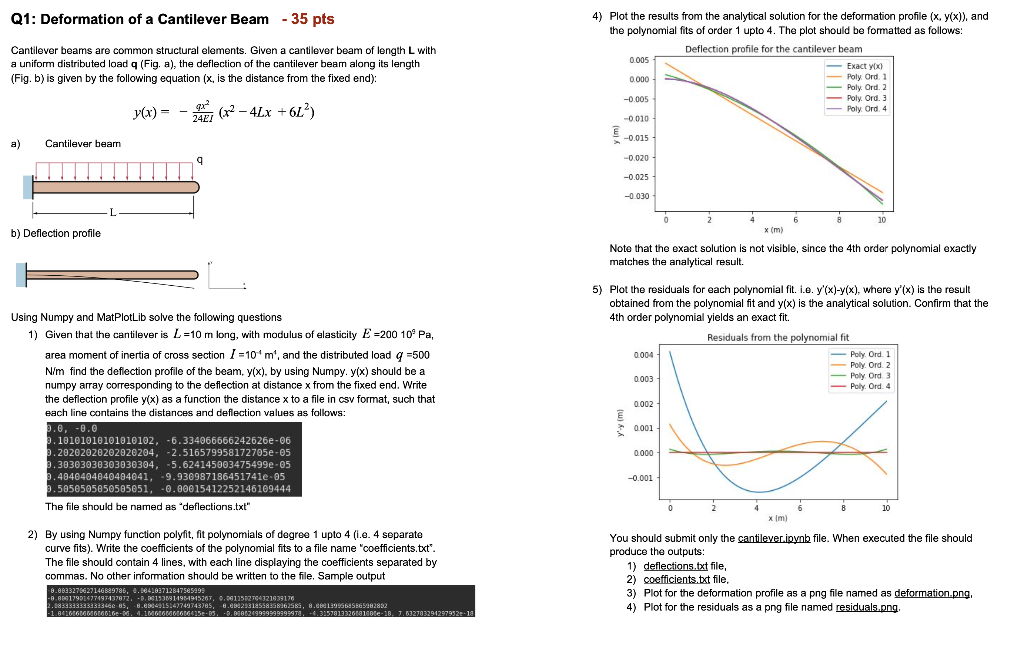
I have python homework. Please help me to solve it and can you share also code text please.(only File IO,string formatting,numpy and numpy functions, engineering applications of numpy, basic matplot are allowed ).

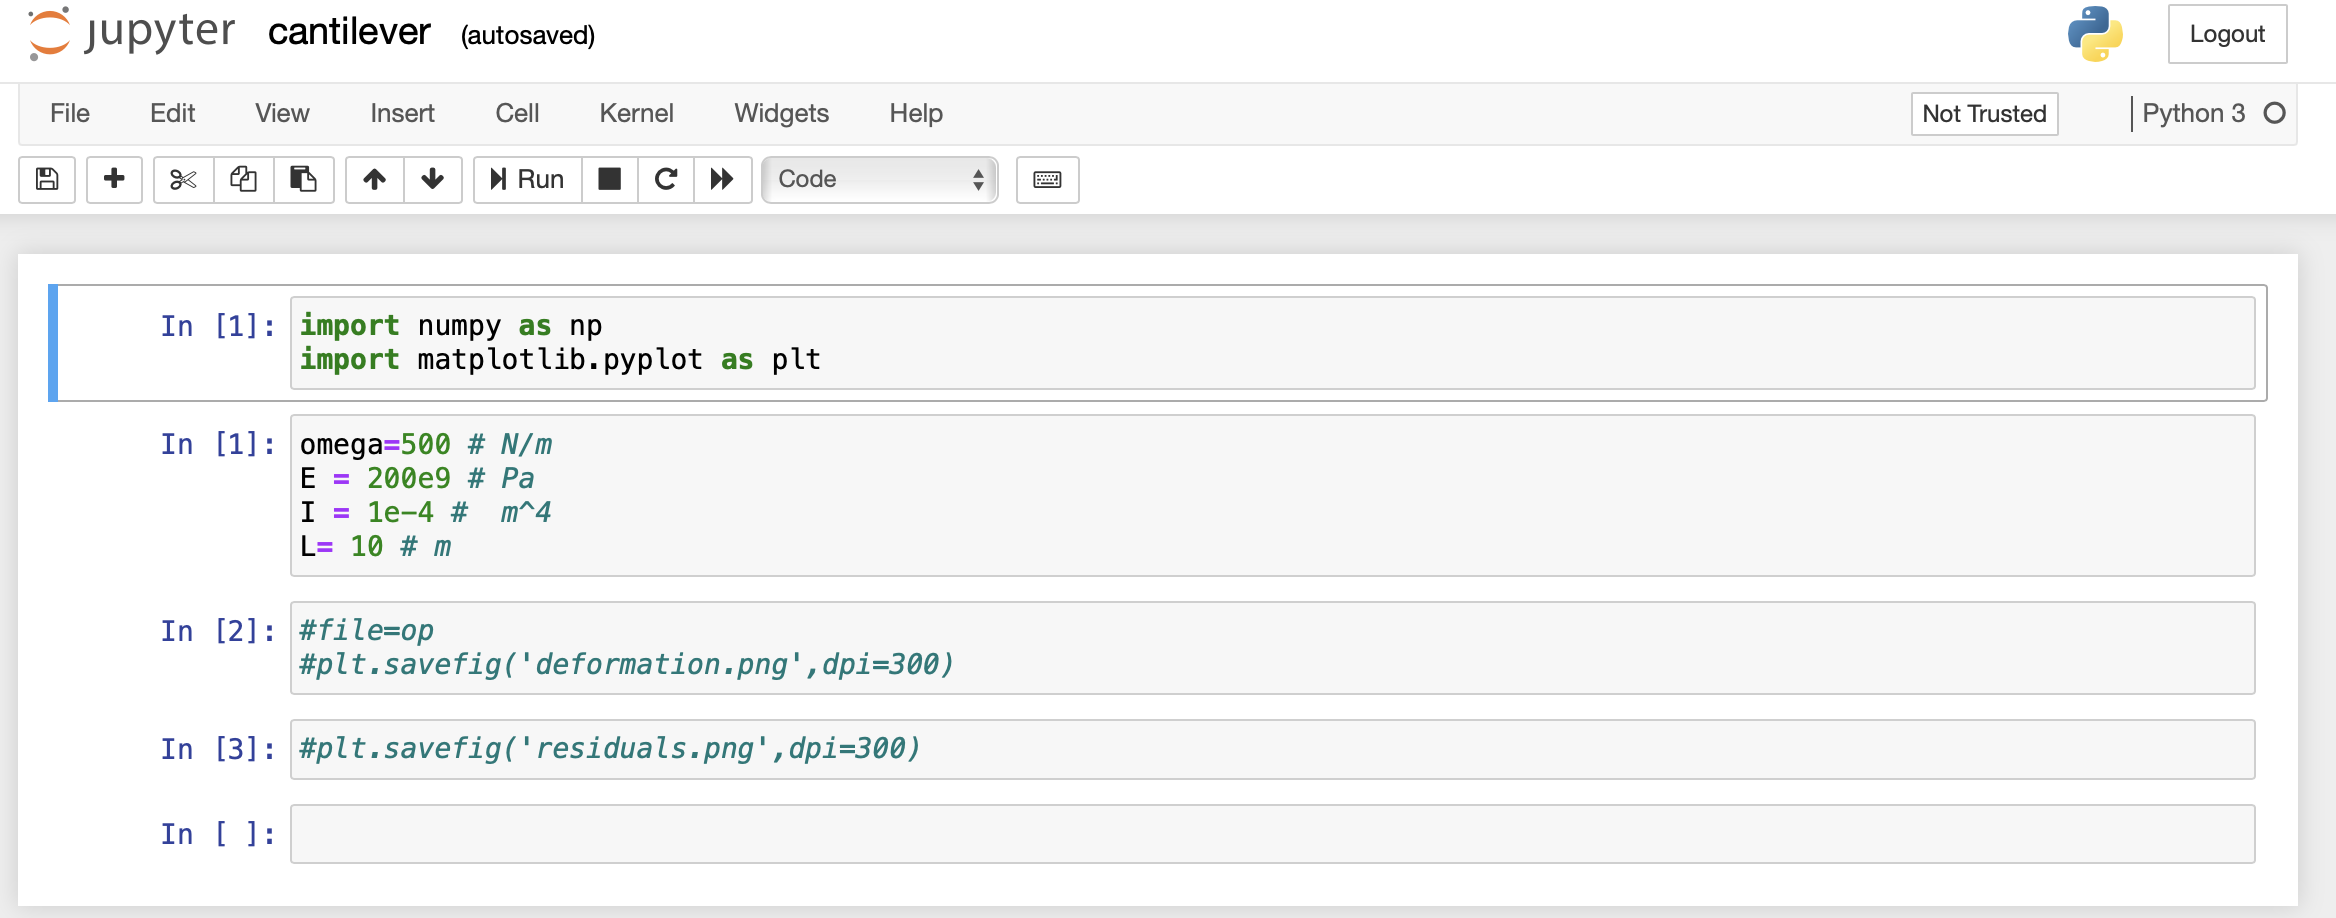
Q1: Deformation of a Cantilever Beam - 35 pts Cantilever beams are common structural elements. Given a cantilever beam of length L with a uniform distributed load q (Fig. a), the deflection of the cantilever beam along its length (Fig. b) is given by the following equation (x, is the distance from the fixed end): 4) Plot the results from the analytical solution for the deformation profile (X. y(x)), and the polynomial fits of order 1 upto 4. The plot should be formatted as follows: Deflection profile for the cantilever beam 0.005 Exact yox) 0.000 Poly Ord. 1 Poly. Ord. 2 -0.005 Poly. Ord. 3 Poly Ord. 4 -0010 (x) = 9x (x2 - 4Lx +62) 2421 -0.015 a) Cantilever bearn 9 -0.020 -0.025 -0.030 20 b) Deflection profile O 4 6 8 x (m) Note that the exact solution is not visible, since the 4th order polynomial exactly matches the analytical result. 5) Plot the residuals for each polynomial fit. i.e. y'(x)-y(x), where y'(x) is the result obtained from the polynomial fit and y(x) is the analytical solution. Confirm that the 4th order polynomial yields an exact fit. Residuals from the polynomial fit 0.004 Poly Ord. 1 Poly Ord. 2 0.003 Poly Ord 3 Poly Ord. 4 0002 Using Numpy and MatPlotLib solve the following questions 1) Given that the cantilever is L=10 m long, with modulus of elasticity E =200 109 Pa, area moment of inertia of cross section 1 =10m, and the distributed load g =500 Nim find the deflection profile of the beam y(x). by using Numpy. y(x) should be a numpy array corresponding to the deflection at distance x from the fixed end. Write the deflection profile y(x) as a function the distance x to a file in csv format, such that each line contains the distances and deflection values as follows: 9.0, -0.0 9.10101010101010102, -6.334066666242626e-06 9.20202020202020204, -2.516579958172705e-05 9.30303030303030304, -5.624145003475499e-05 9.4840404040404041, -9.930987186451741e-05 9.5050505050505051, -0.00015412252146109444 The file should be named as "deflections.txt" 0.001 0.000 -0.001 0 2 4 8 10 xim) 2) By using Numpy function polyfit, fit polynomials of degree 1 upto 4 (.e. 4 separate curve fits). Write the coefficients of the polynomial fits to a file name "coefficients.txt". The file should contain 4 lines, with each line displaying the coefficients separated by commas. No other information should be written to the file. Sample output 8.6833275627146829786, 0.04182712847585999 -0.00017991477497437872, -5,001530914904915267, 0.0011502754321939176 2.0833333333333346c-85, -8.6824915242749343785, -6.8902931855835836258, d.ee 12996625865982832 -1.641666666616-06. LIVE66666625e-85. -0.0001249999999999978. -4.31578133260188e-18. 7.632783294297952-18 You should submit only the cantilever.ipvnk file. When executed the file should produce the outputs: 1) deflections.txt file, 2) coefficients.txt file. 3) Plot for the deformation profile as a png file named as deformation.png 4) Plot for the residuals as a png file named residuals.png Jupyter cantilever (autosaved) Logout File Edit View Insert Cell Kernel Widgets Help Not Trusted Python 3 O Run C >> Code In [1] : import numpy as np import matplotlib.pyplot as plt In [1]: omega=500 # N/m E 200e9 # Pa I le-4 # m^4 L= 10 #m In [2]: #file=op #plt.savefig('deformation.png',dpi=300) In [3]: #plt.savefig('residuals.png', dpi=300) In [ ]: Q1: Deformation of a Cantilever Beam - 35 pts Cantilever beams are common structural elements. Given a cantilever beam of length L with a uniform distributed load q (Fig. a), the deflection of the cantilever beam along its length (Fig. b) is given by the following equation (x, is the distance from the fixed end): 4) Plot the results from the analytical solution for the deformation profile (X. y(x)), and the polynomial fits of order 1 upto 4. The plot should be formatted as follows: Deflection profile for the cantilever beam 0.005 Exact yox) 0.000 Poly Ord. 1 Poly. Ord. 2 -0.005 Poly. Ord. 3 Poly Ord. 4 -0010 (x) = 9x (x2 - 4Lx +62) 2421 -0.015 a) Cantilever bearn 9 -0.020 -0.025 -0.030 20 b) Deflection profile O 4 6 8 x (m) Note that the exact solution is not visible, since the 4th order polynomial exactly matches the analytical result. 5) Plot the residuals for each polynomial fit. i.e. y'(x)-y(x), where y'(x) is the result obtained from the polynomial fit and y(x) is the analytical solution. Confirm that the 4th order polynomial yields an exact fit. Residuals from the polynomial fit 0.004 Poly Ord. 1 Poly Ord. 2 0.003 Poly Ord 3 Poly Ord. 4 0002 Using Numpy and MatPlotLib solve the following questions 1) Given that the cantilever is L=10 m long, with modulus of elasticity E =200 109 Pa, area moment of inertia of cross section 1 =10m, and the distributed load g =500 Nim find the deflection profile of the beam y(x). by using Numpy. y(x) should be a numpy array corresponding to the deflection at distance x from the fixed end. Write the deflection profile y(x) as a function the distance x to a file in csv format, such that each line contains the distances and deflection values as follows: 9.0, -0.0 9.10101010101010102, -6.334066666242626e-06 9.20202020202020204, -2.516579958172705e-05 9.30303030303030304, -5.624145003475499e-05 9.4840404040404041, -9.930987186451741e-05 9.5050505050505051, -0.00015412252146109444 The file should be named as "deflections.txt" 0.001 0.000 -0.001 0 2 4 8 10 xim) 2) By using Numpy function polyfit, fit polynomials of degree 1 upto 4 (.e. 4 separate curve fits). Write the coefficients of the polynomial fits to a file name "coefficients.txt". The file should contain 4 lines, with each line displaying the coefficients separated by commas. No other information should be written to the file. Sample output 8.6833275627146829786, 0.04182712847585999 -0.00017991477497437872, -5,001530914904915267, 0.0011502754321939176 2.0833333333333346c-85, -8.6824915242749343785, -6.8902931855835836258, d.ee 12996625865982832 -1.641666666616-06. LIVE66666625e-85. -0.0001249999999999978. -4.31578133260188e-18. 7.632783294297952-18 You should submit only the cantilever.ipvnk file. When executed the file should produce the outputs: 1) deflections.txt file, 2) coefficients.txt file. 3) Plot for the deformation profile as a png file named as deformation.png 4) Plot for the residuals as a png file named residuals.png Jupyter cantilever (autosaved) Logout File Edit View Insert Cell Kernel Widgets Help Not Trusted Python 3 O Run C >> Code In [1] : import numpy as np import matplotlib.pyplot as plt In [1]: omega=500 # N/m E 200e9 # Pa I le-4 # m^4 L= 10 #m In [2]: #file=op #plt.savefig('deformation.png',dpi=300) In [3]: #plt.savefig('residuals.png', dpi=300) In [ ]
Step by Step Solution
There are 3 Steps involved in it

Get step-by-step solutions from verified subject matter experts


