Answered step by step
Verified Expert Solution
Link Copied!

Question

1 Approved Answer

I have some problems in the lesson The idea of significance test that I don't know. Please help me, thank you so much. Question 1:

I have some problems in the lesson "The idea of significance test" that I don't know. Please help me, thank you so much.

Question 1:

image text in transcribedimage text in transcribedimage text in transcribedimage text in transcribedimage text in transcribedimage text in transcribedimage text in transcribedimage text in transcribedimage text in transcribedimage text in transcribedimage text in transcribed
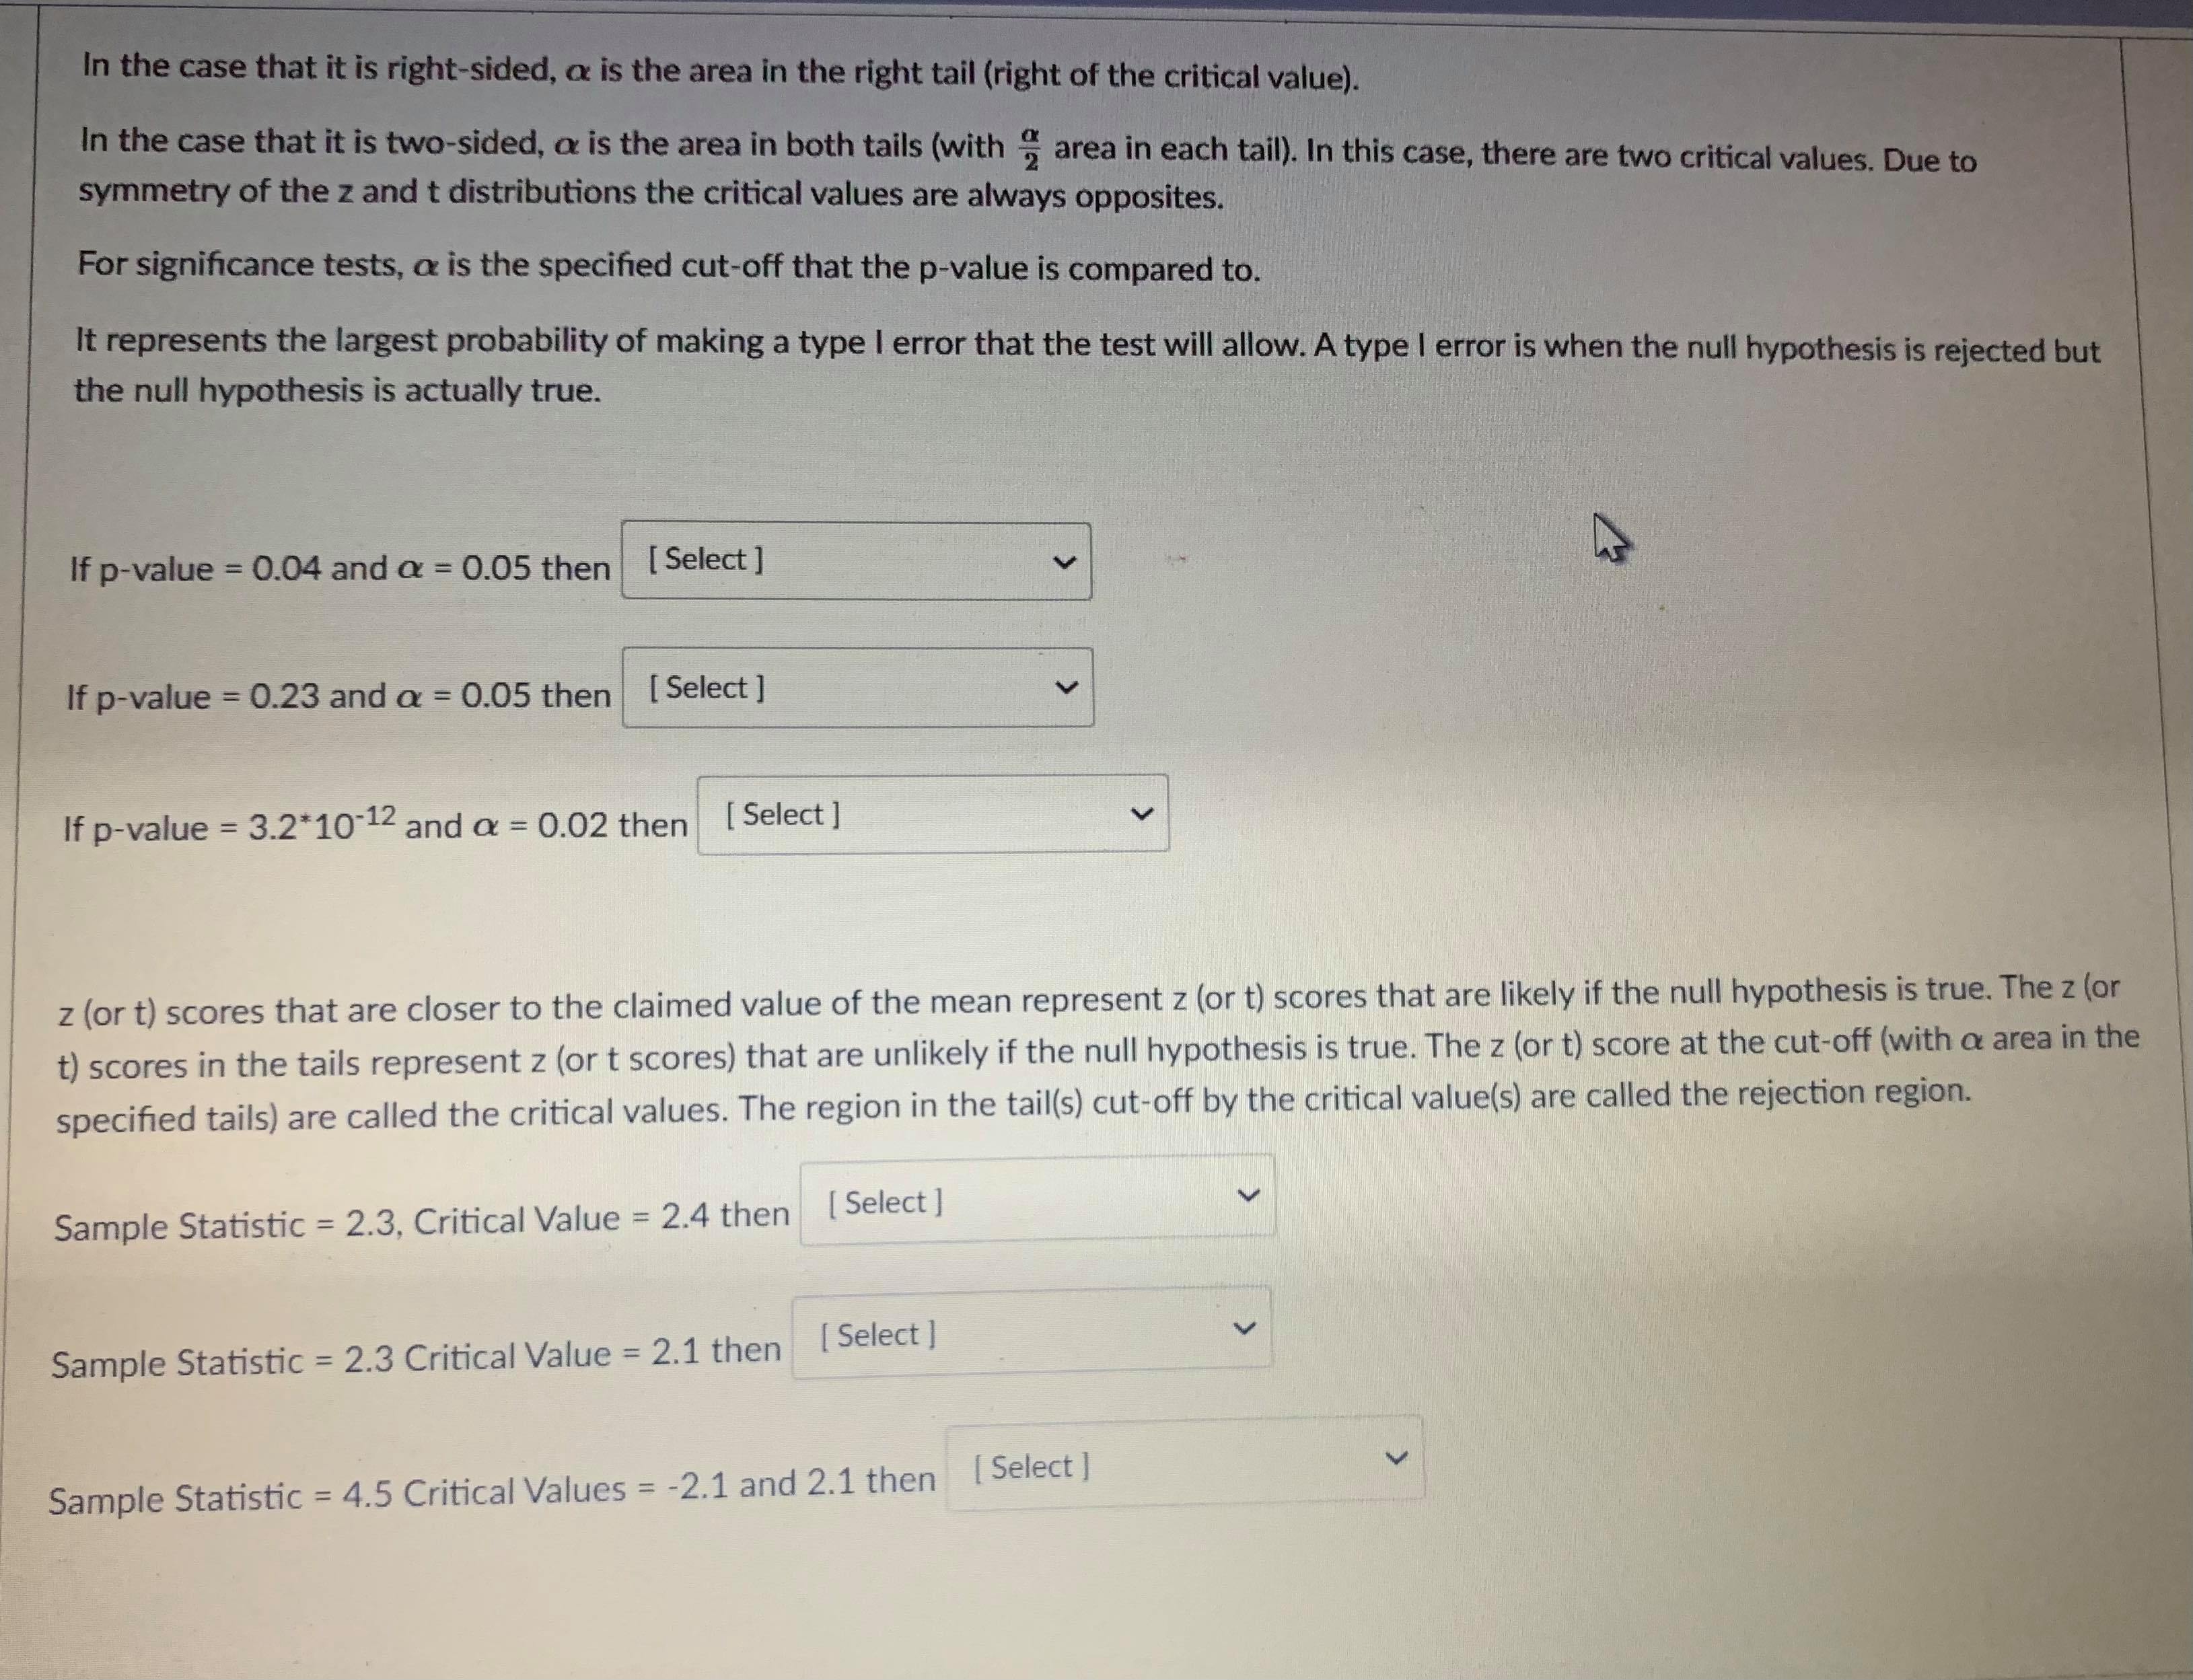
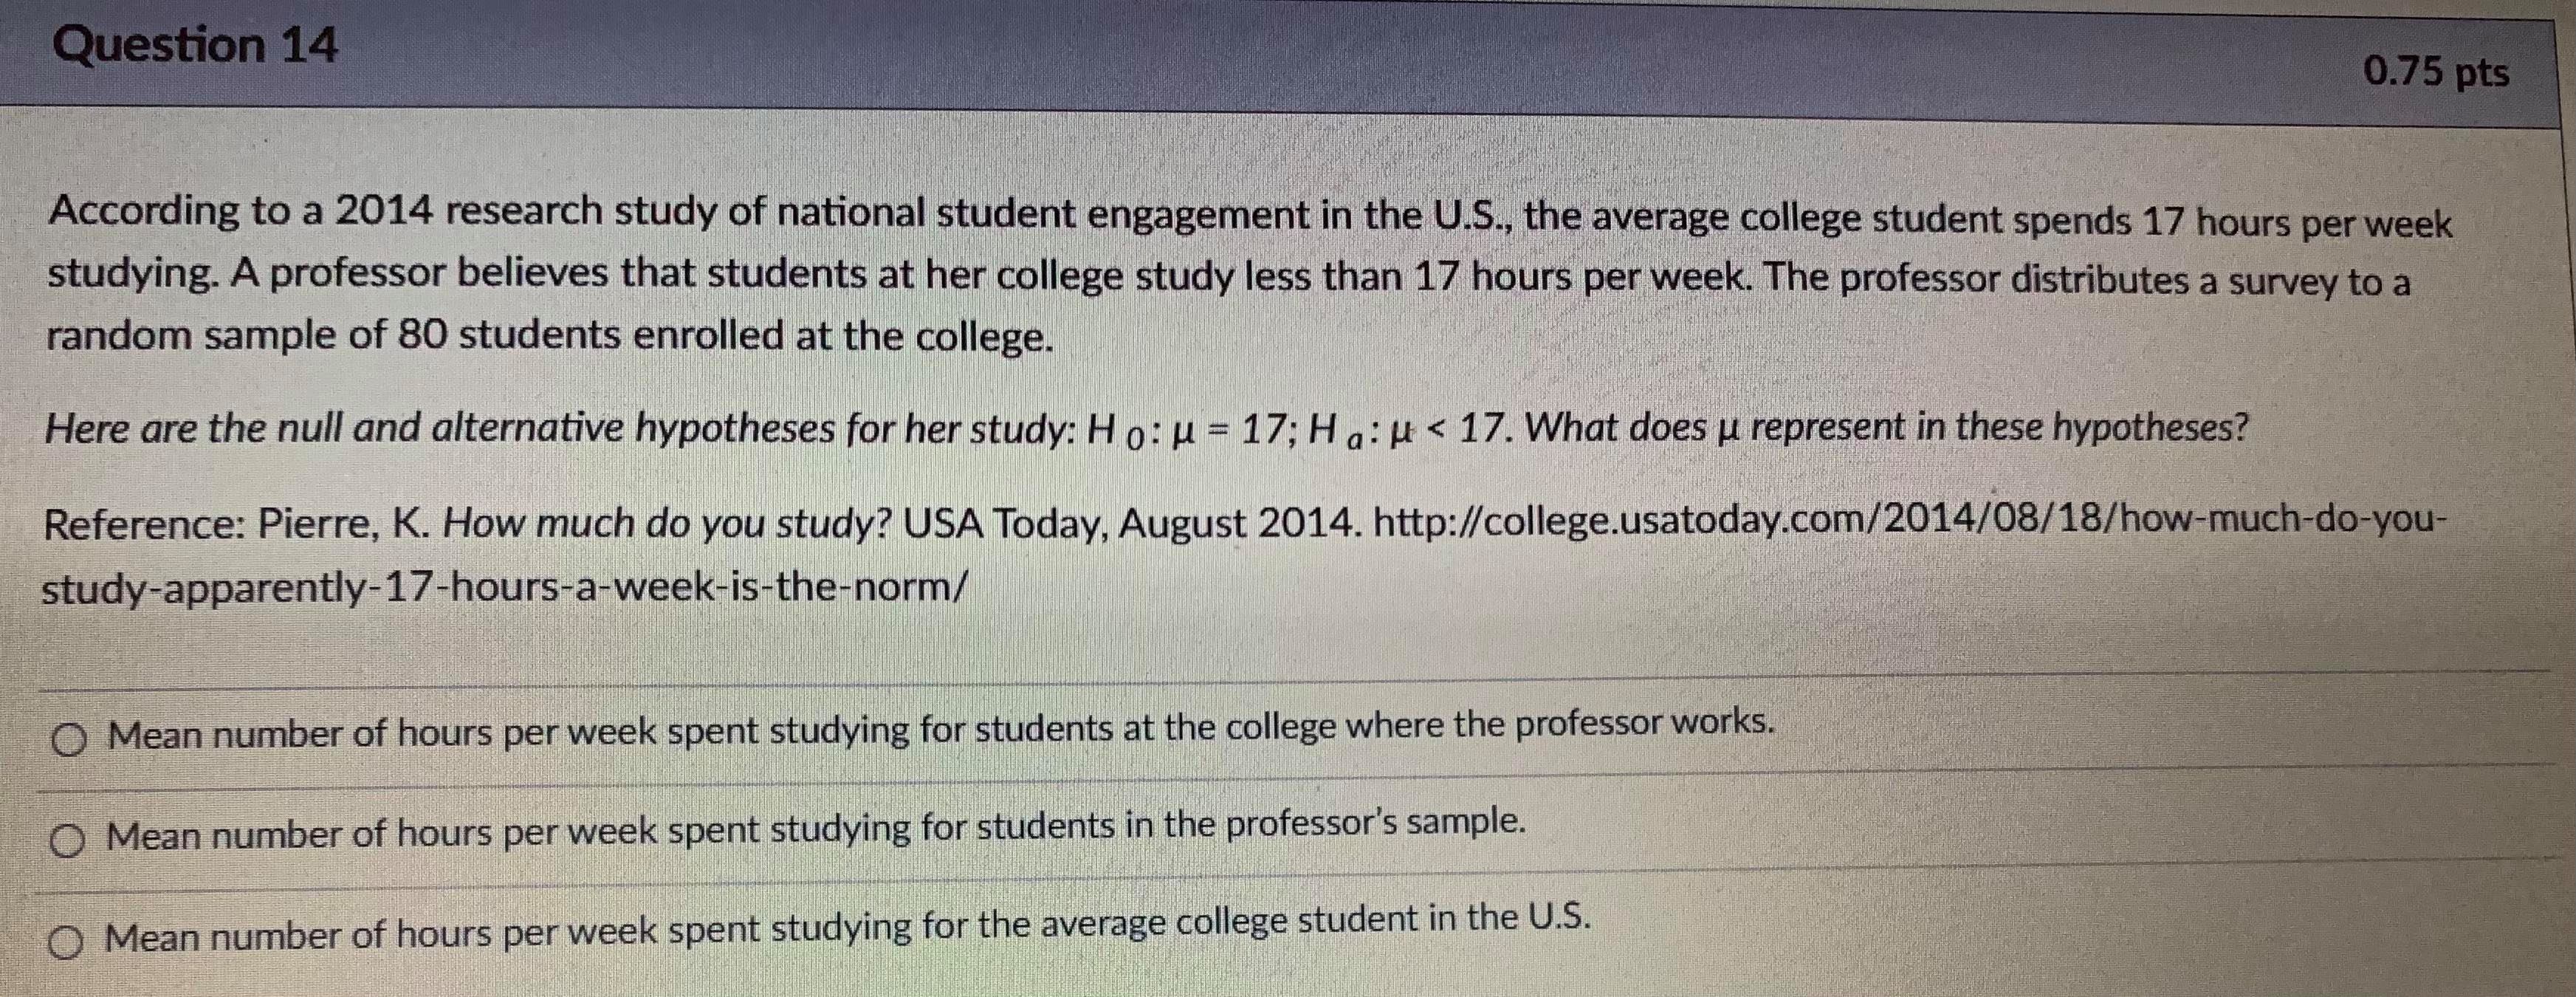
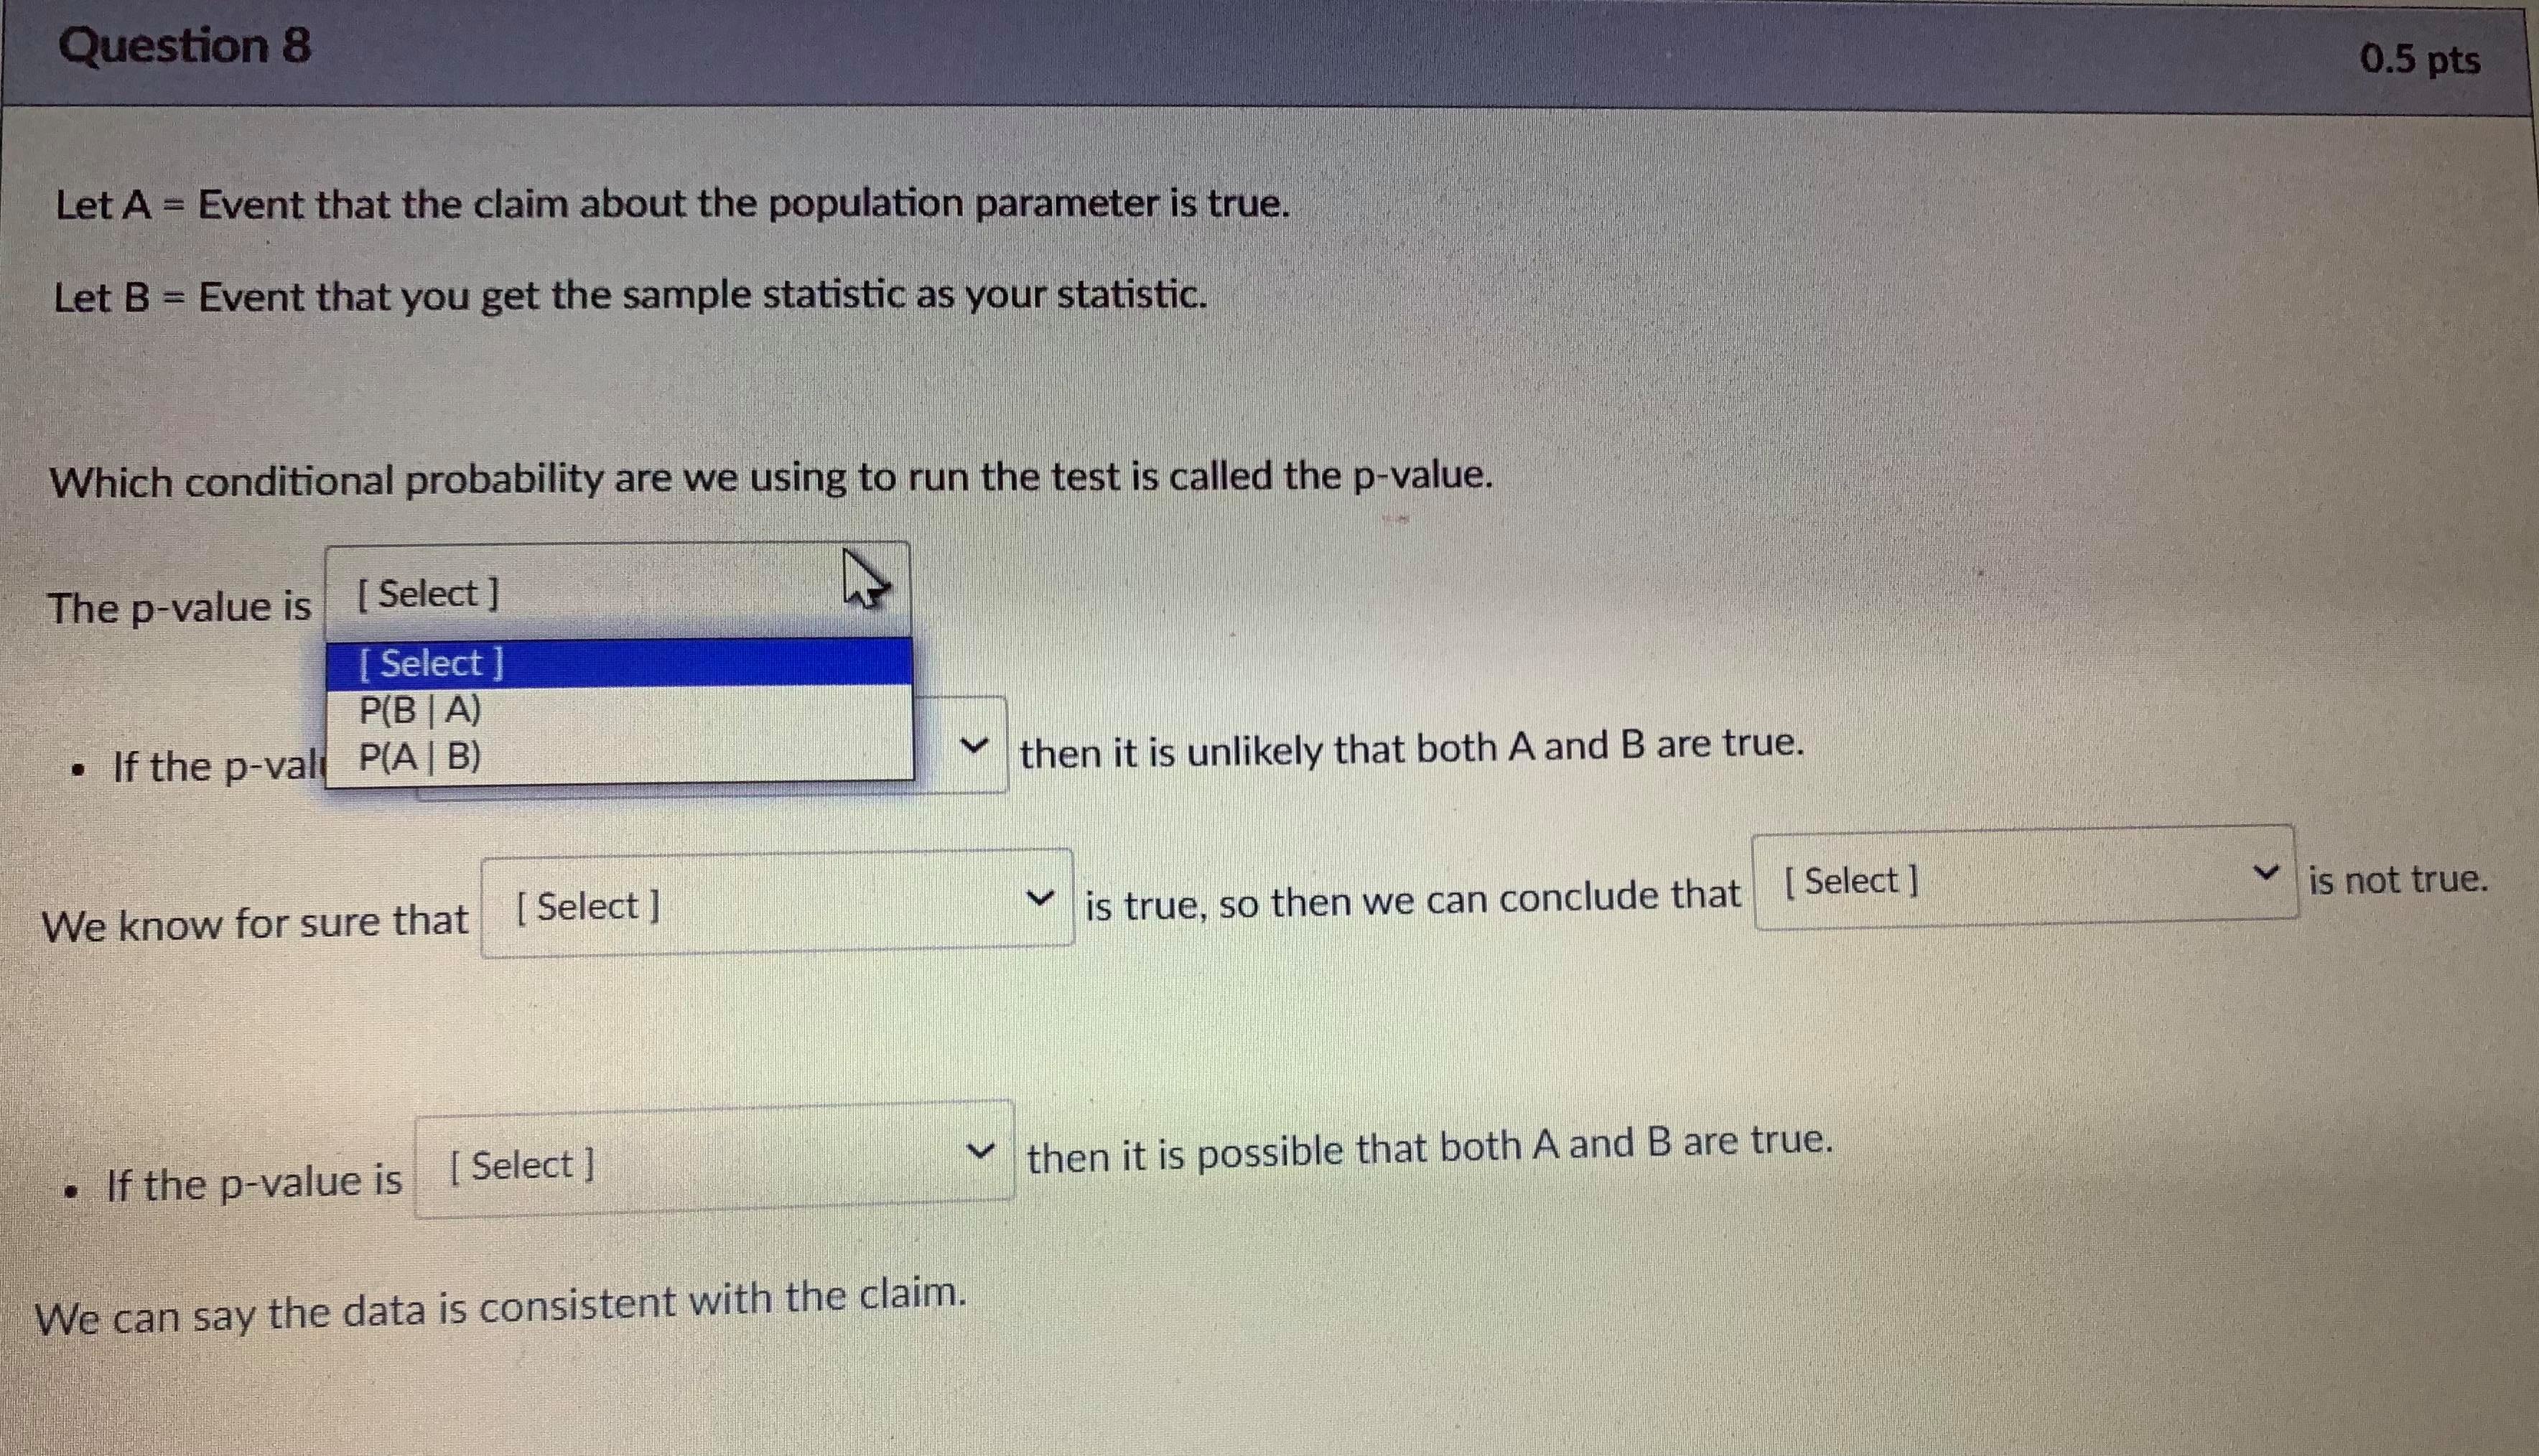
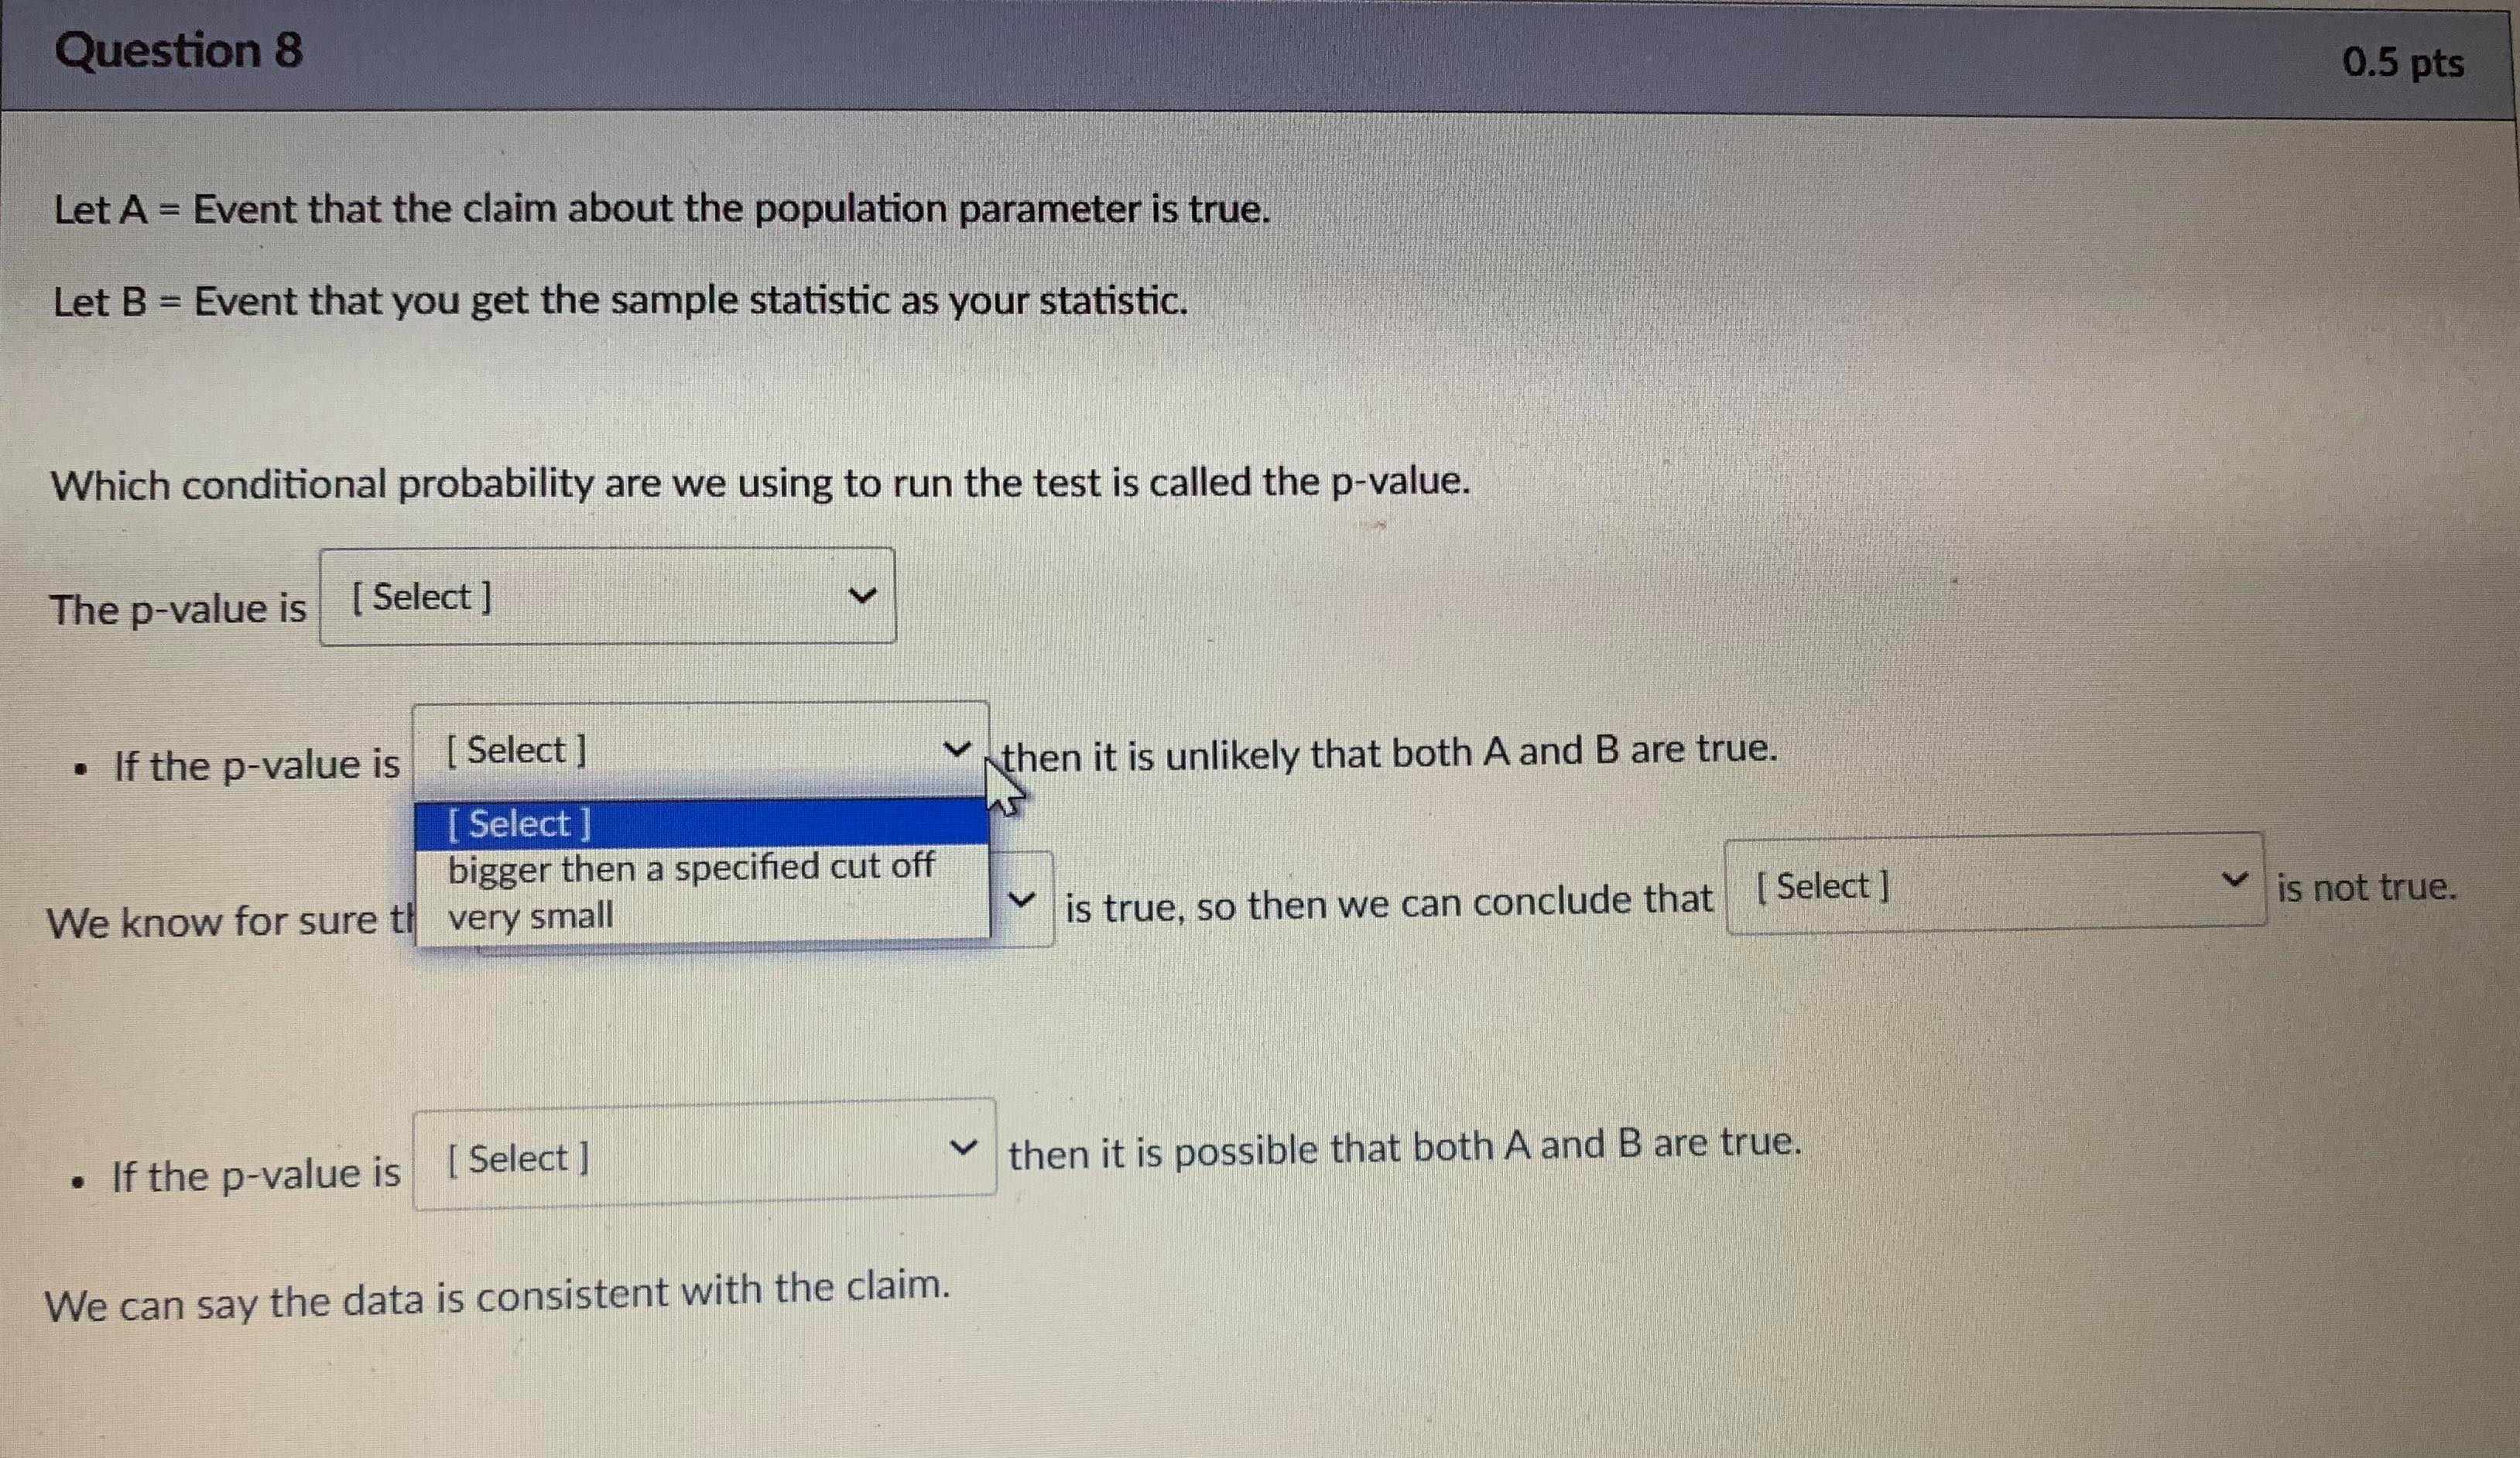
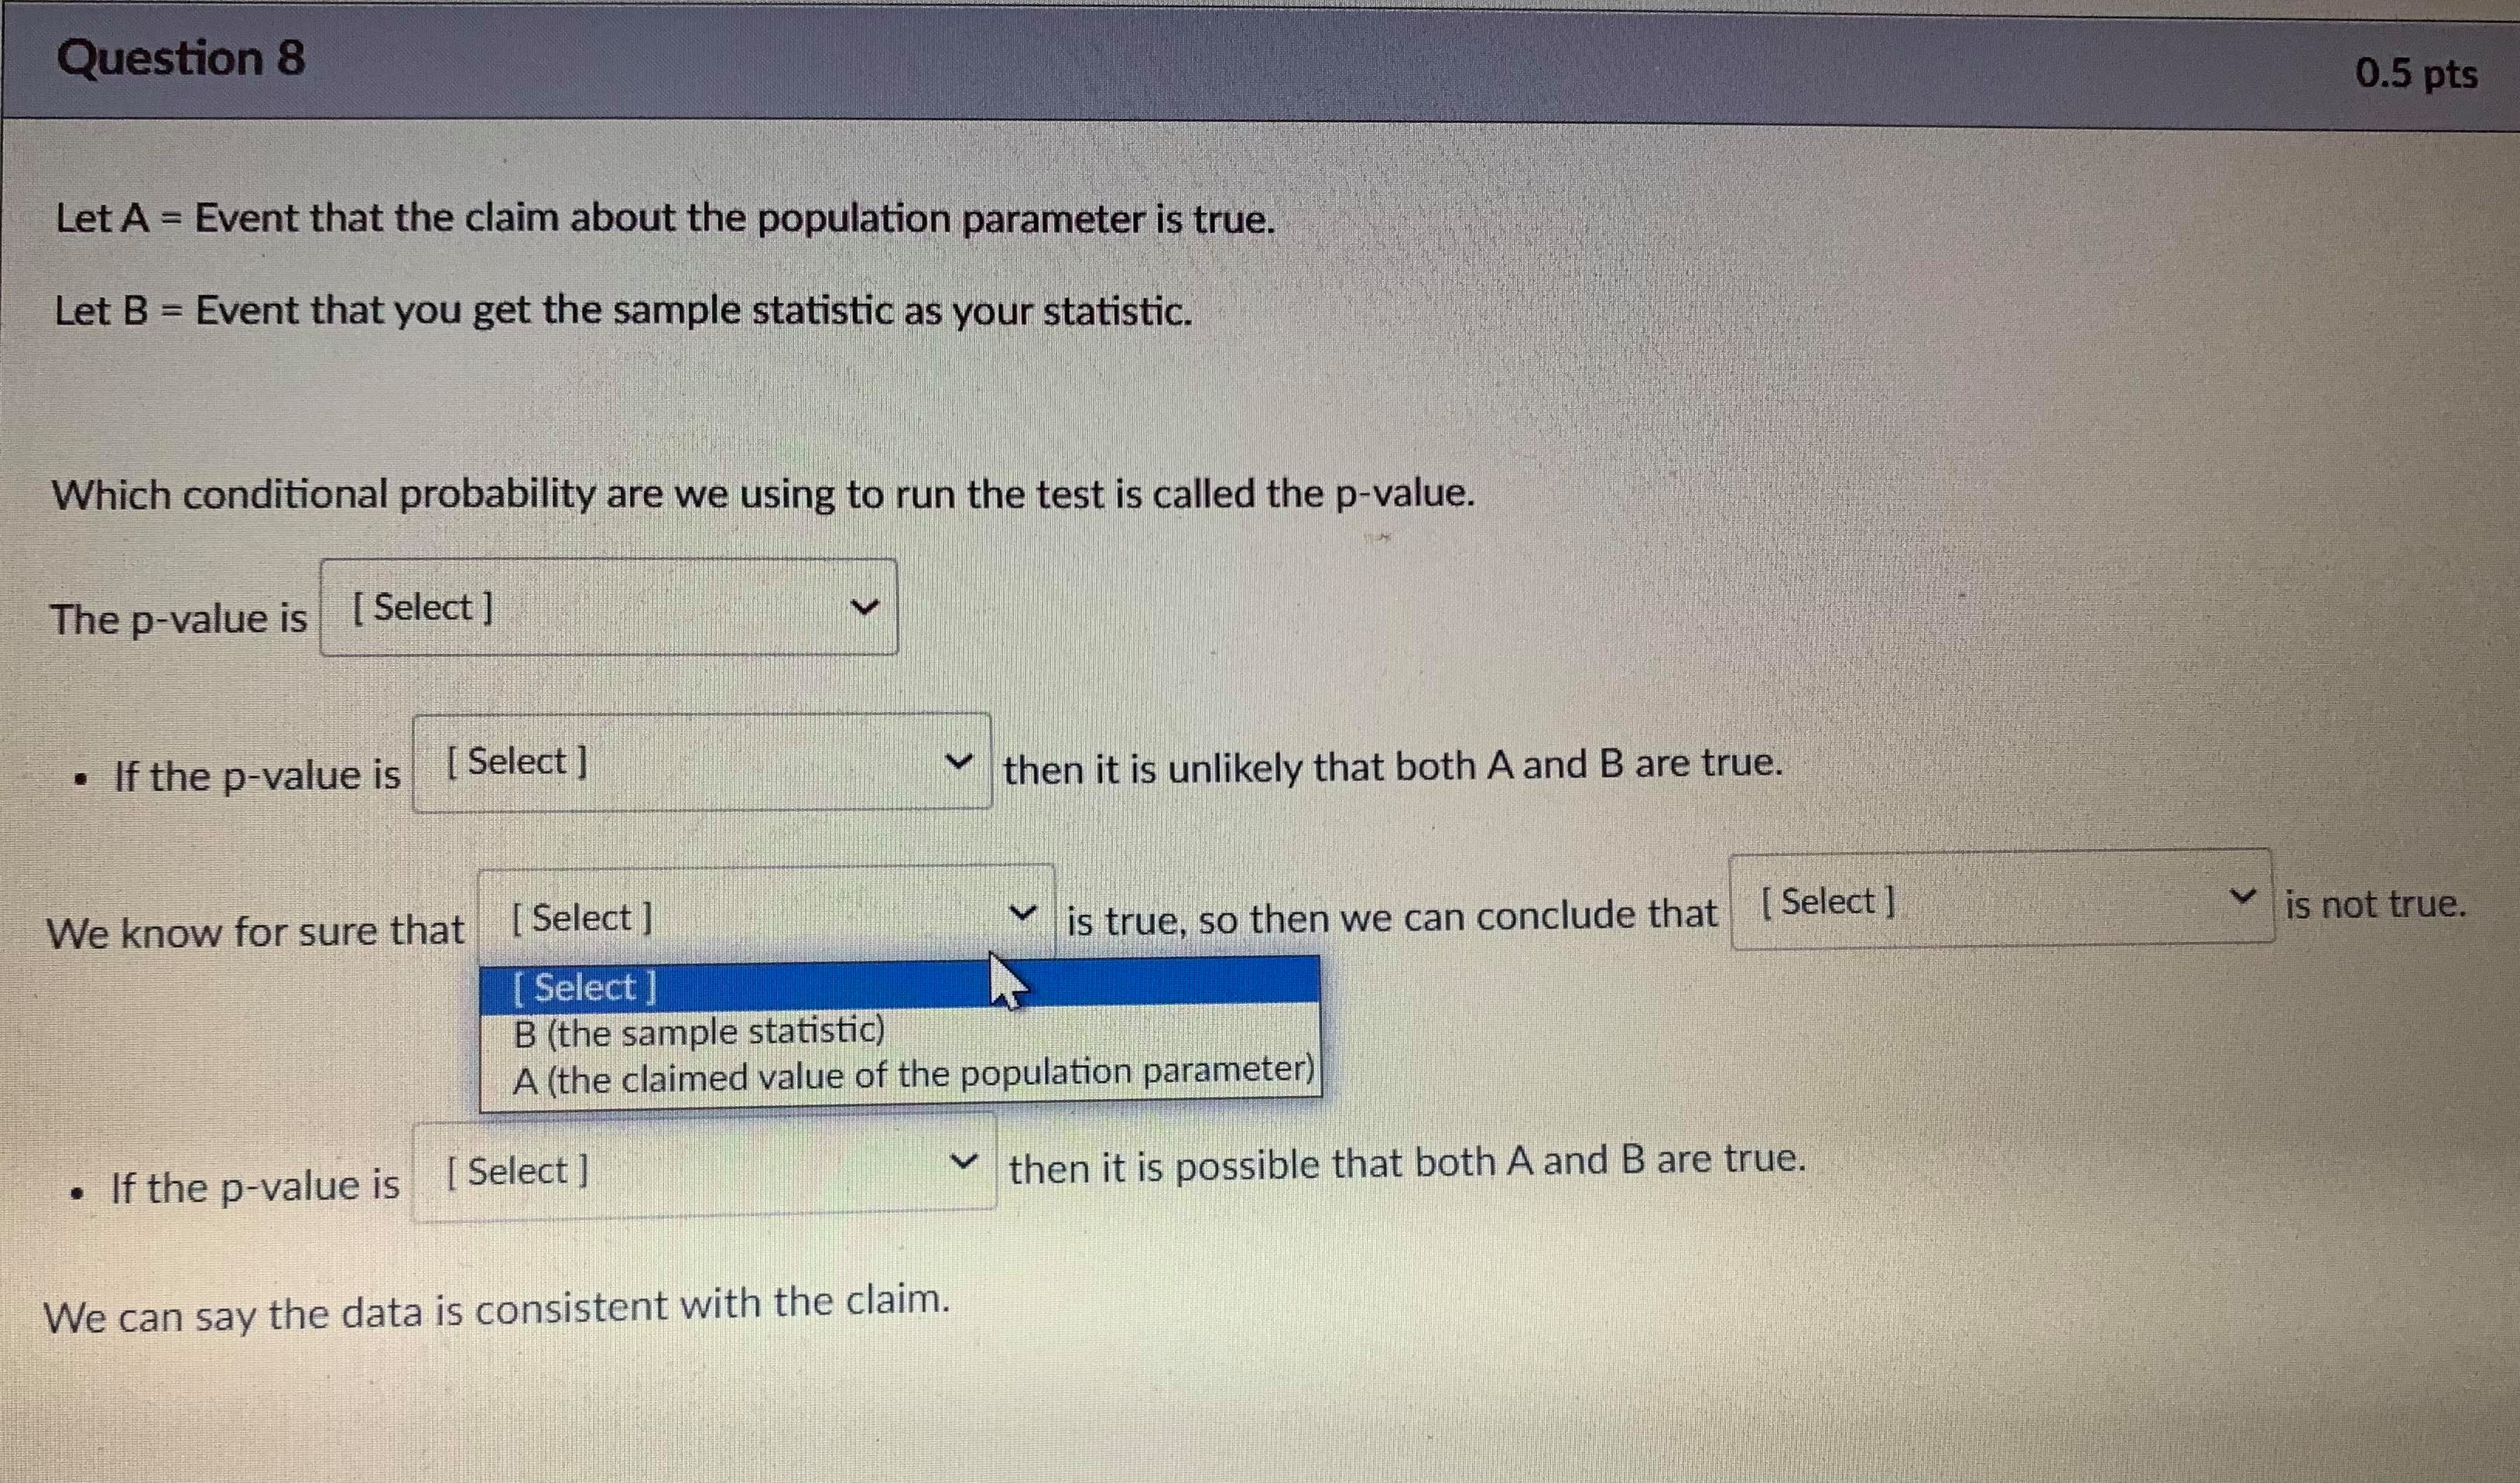
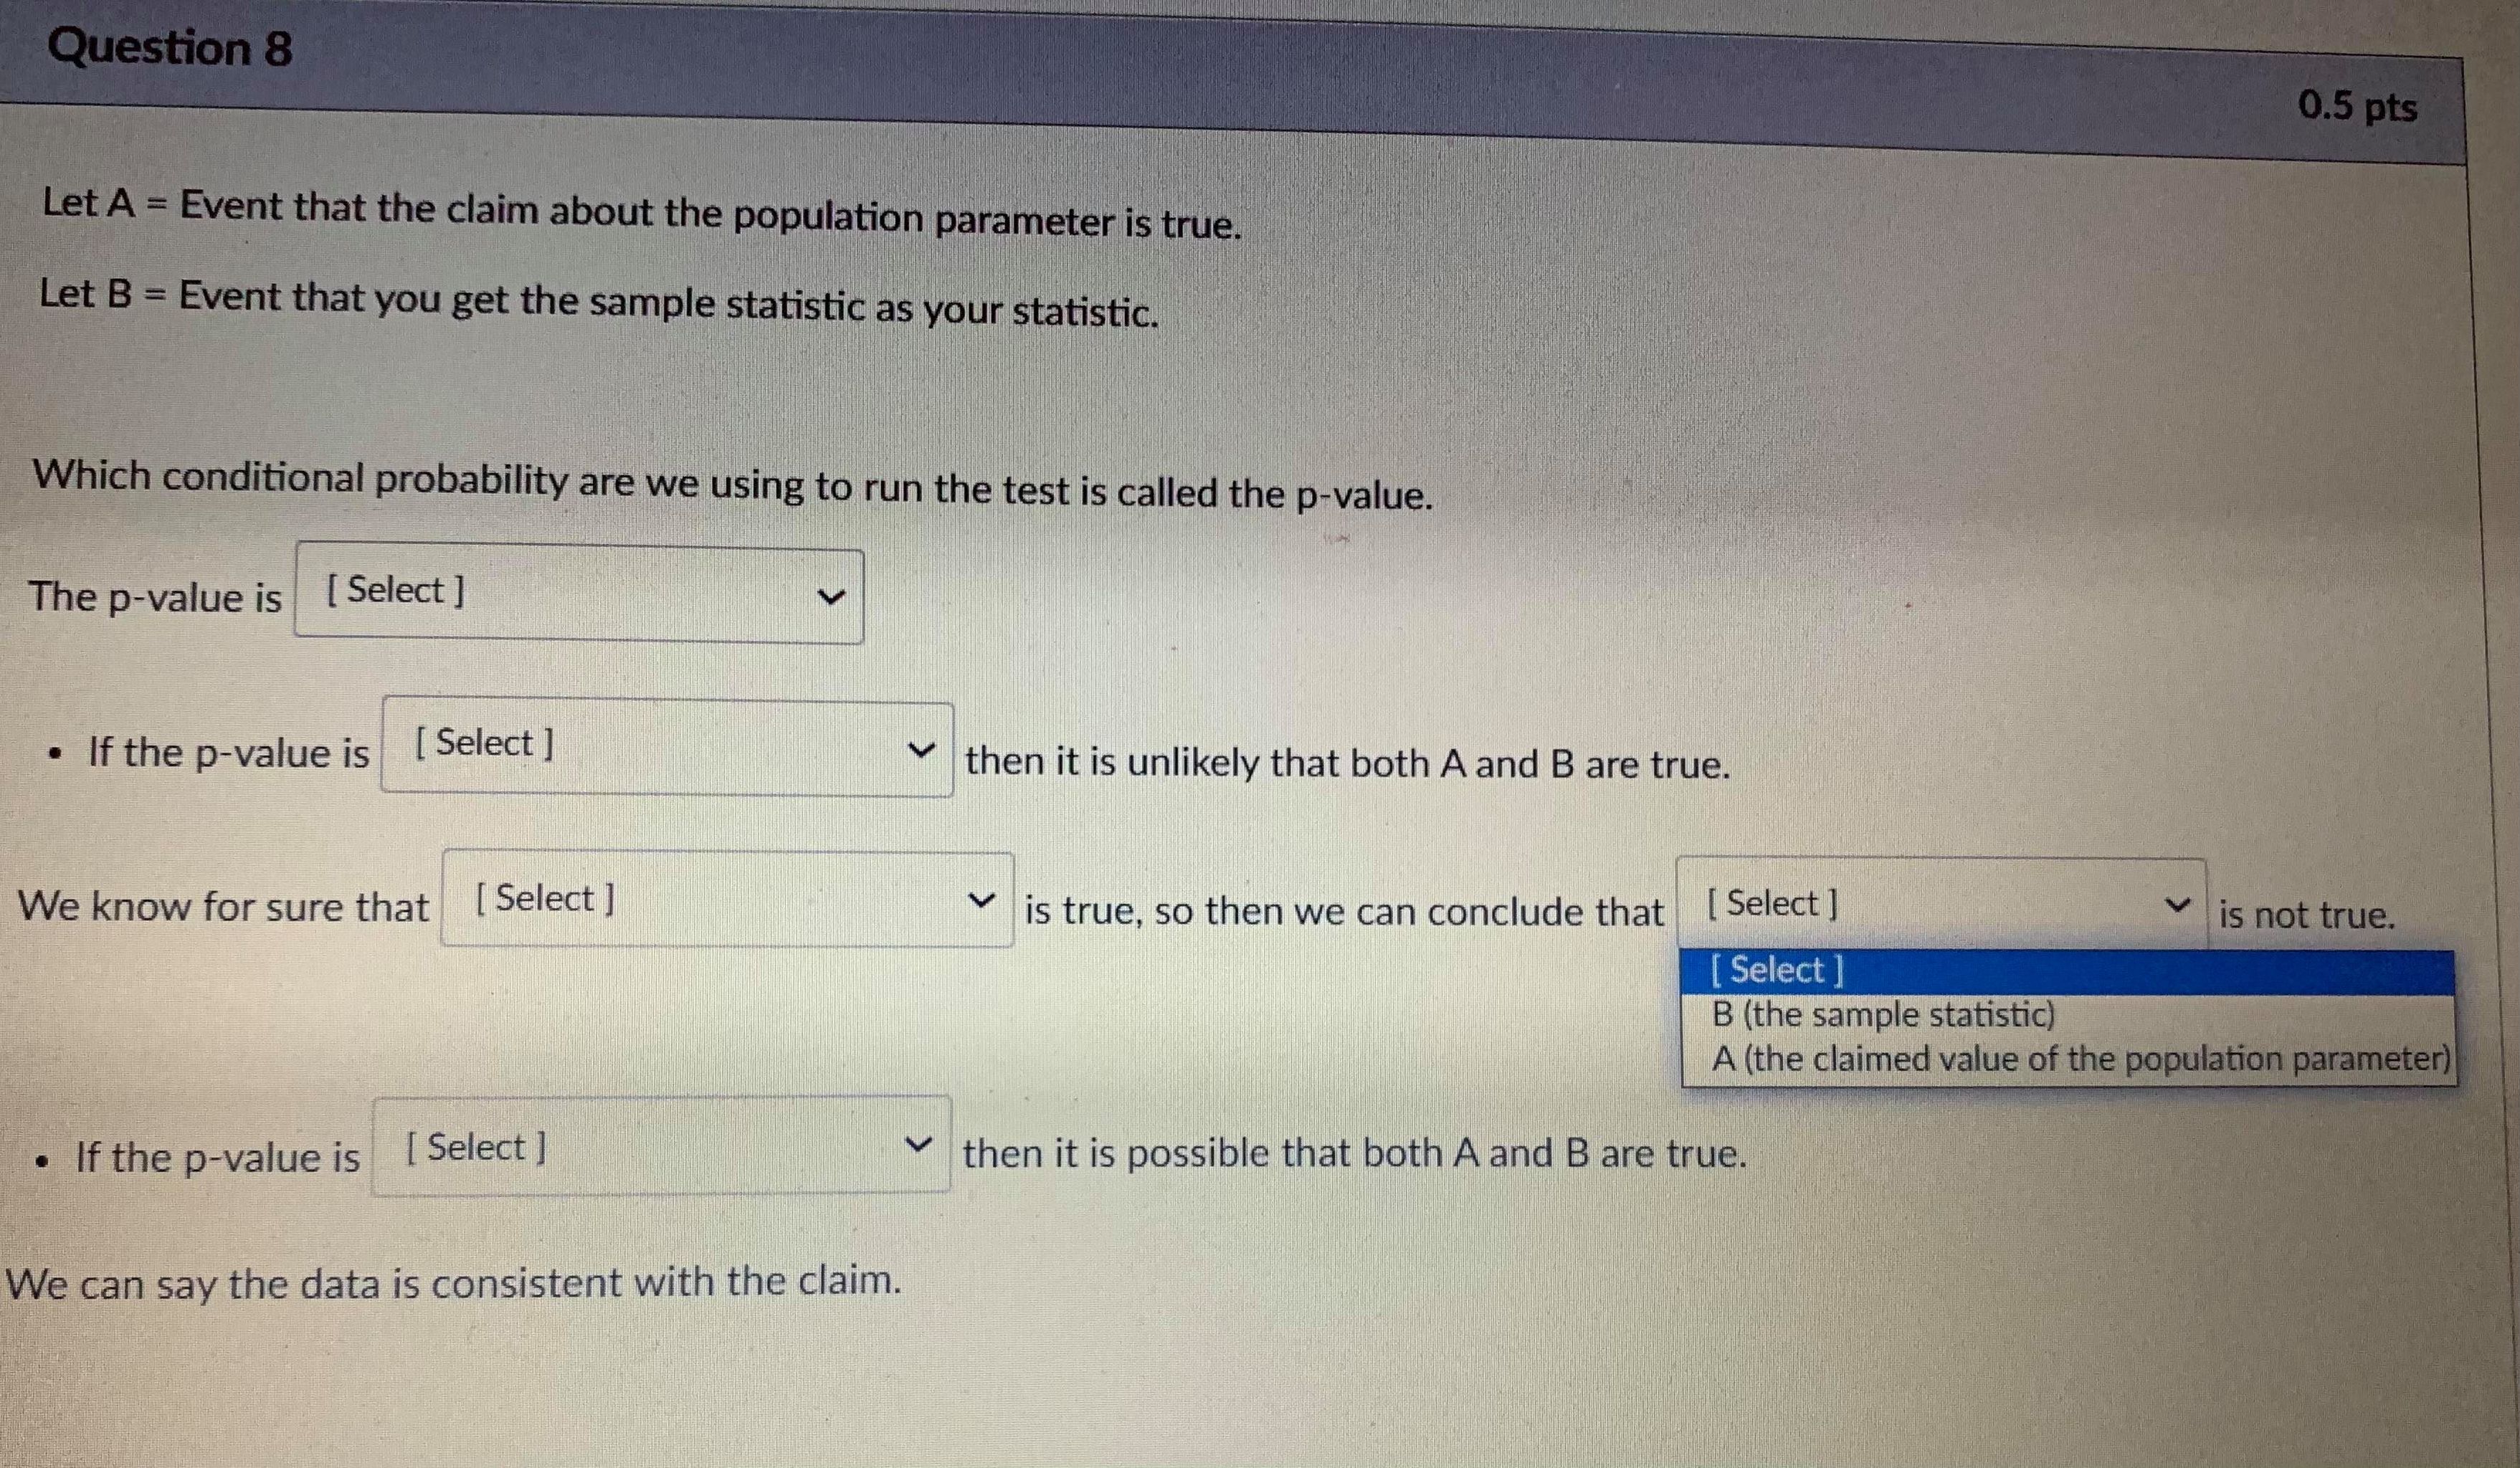
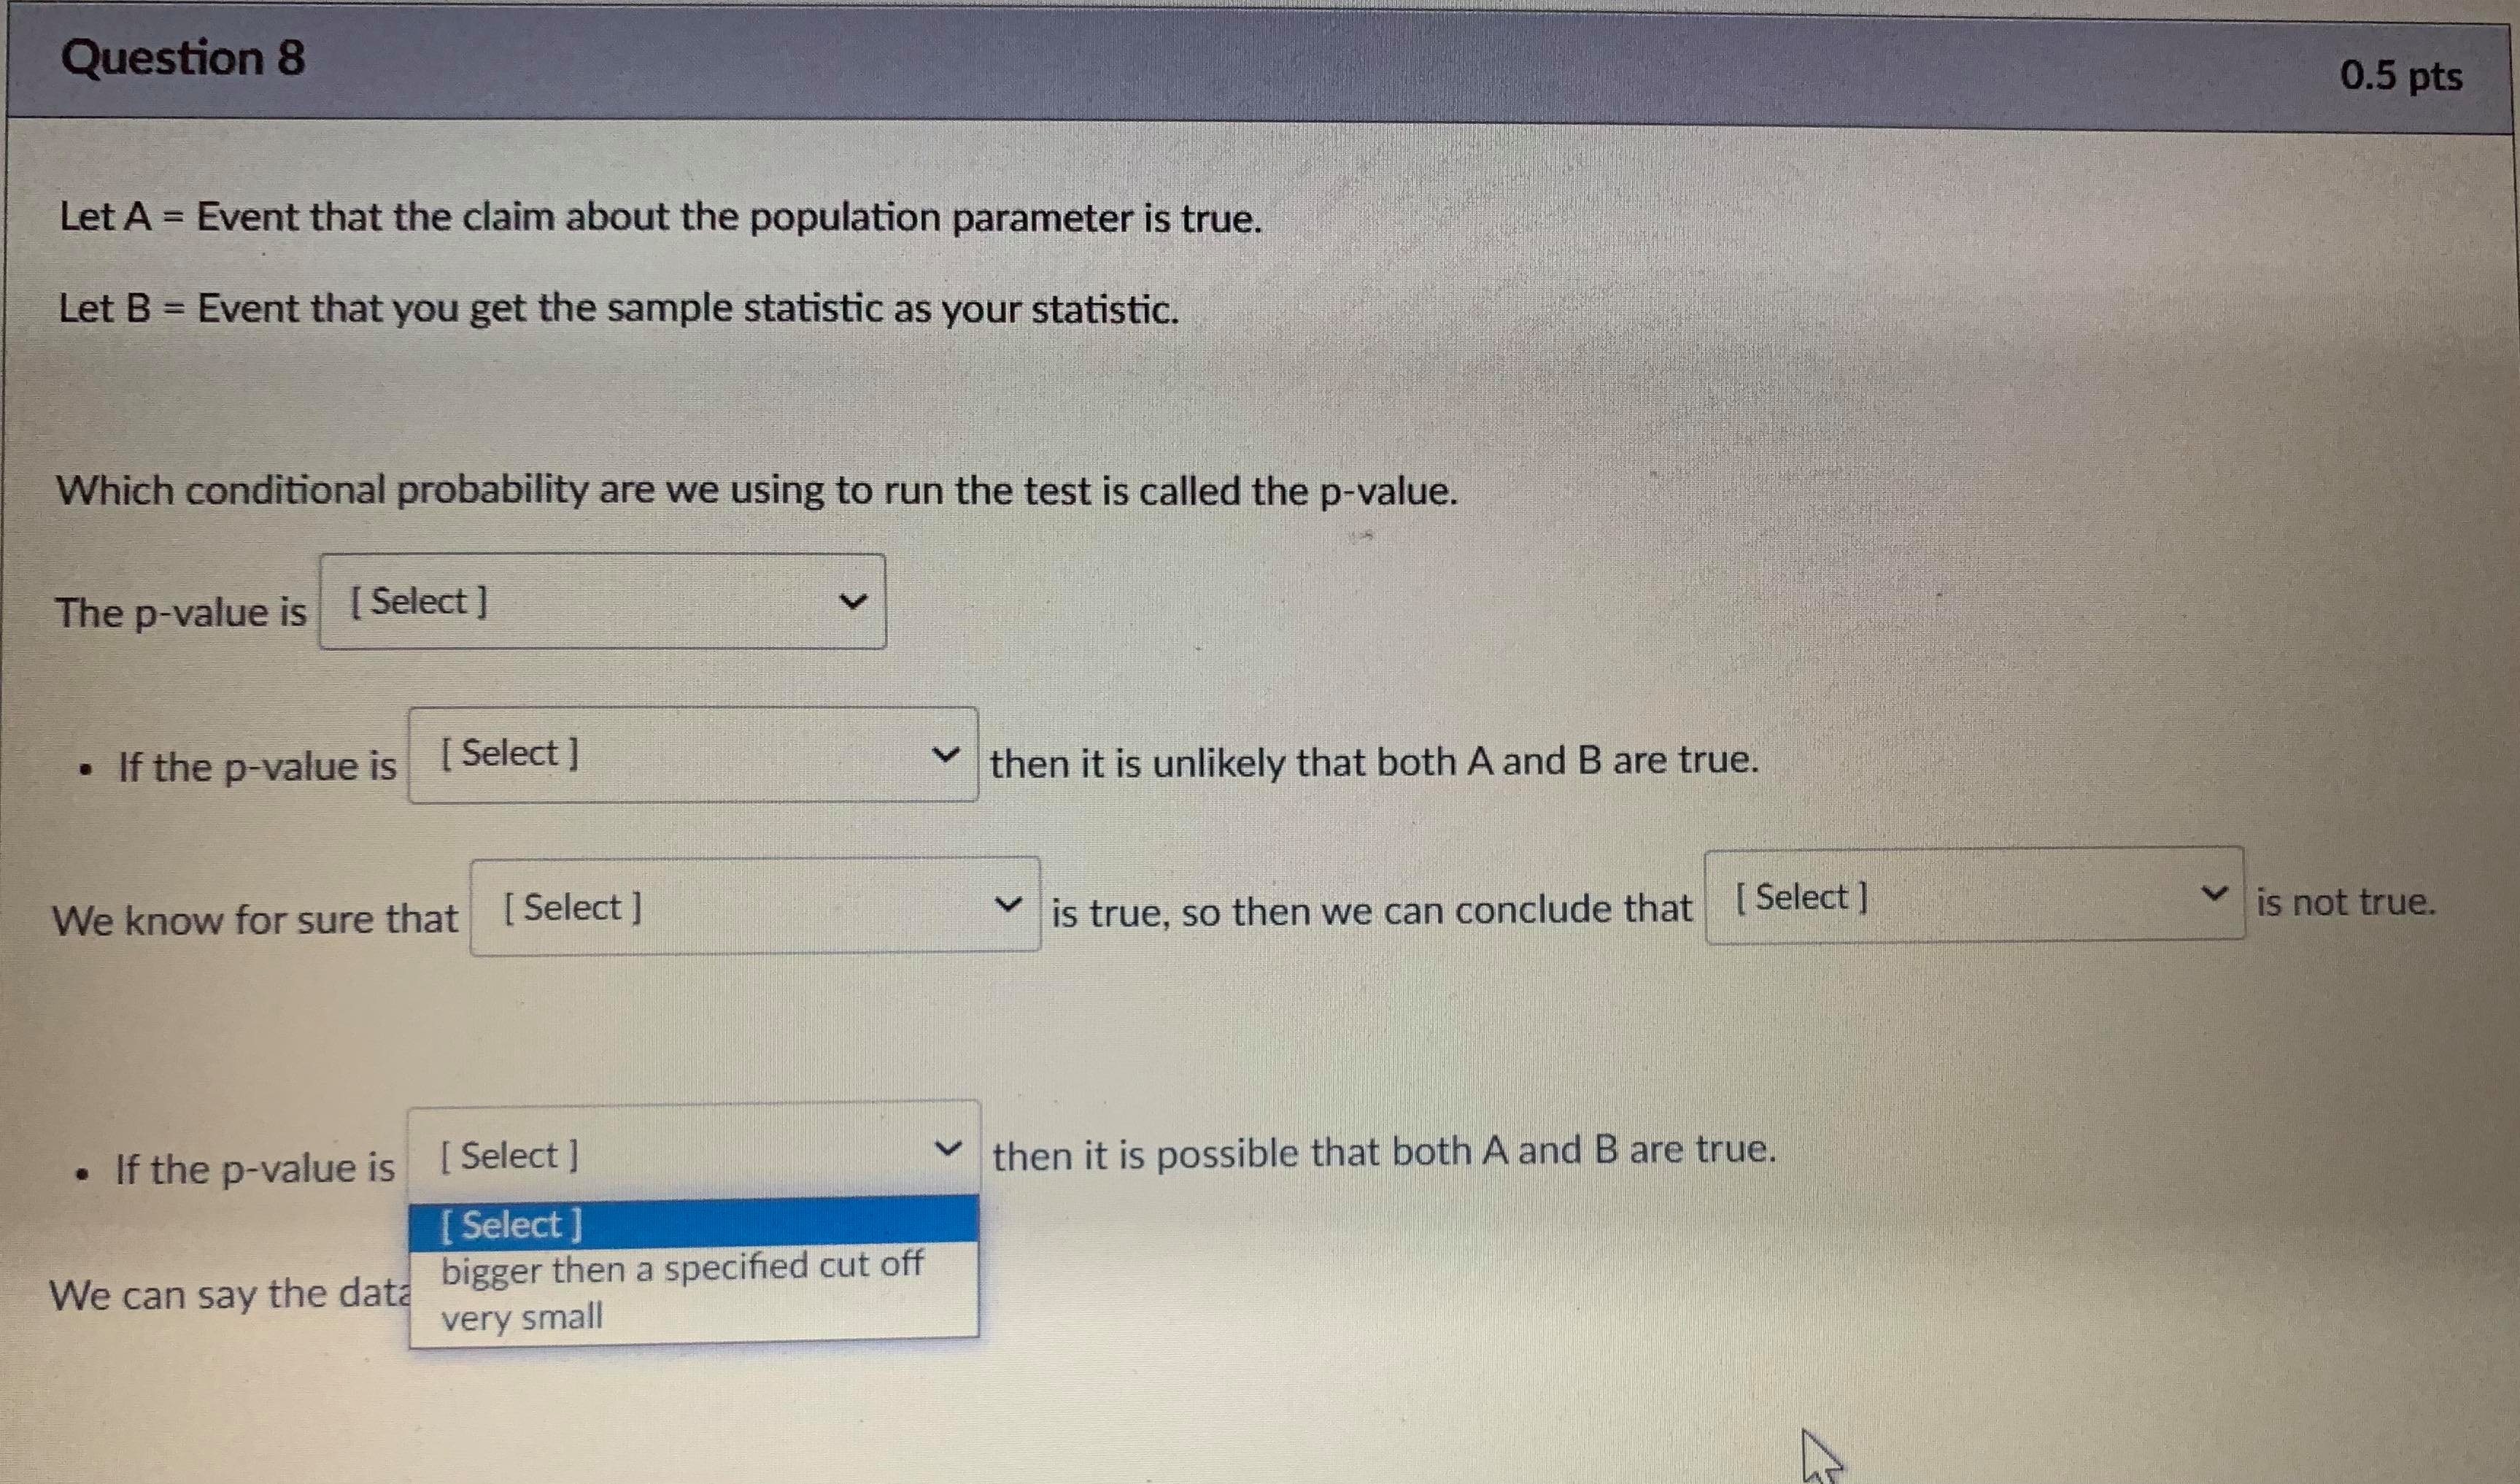
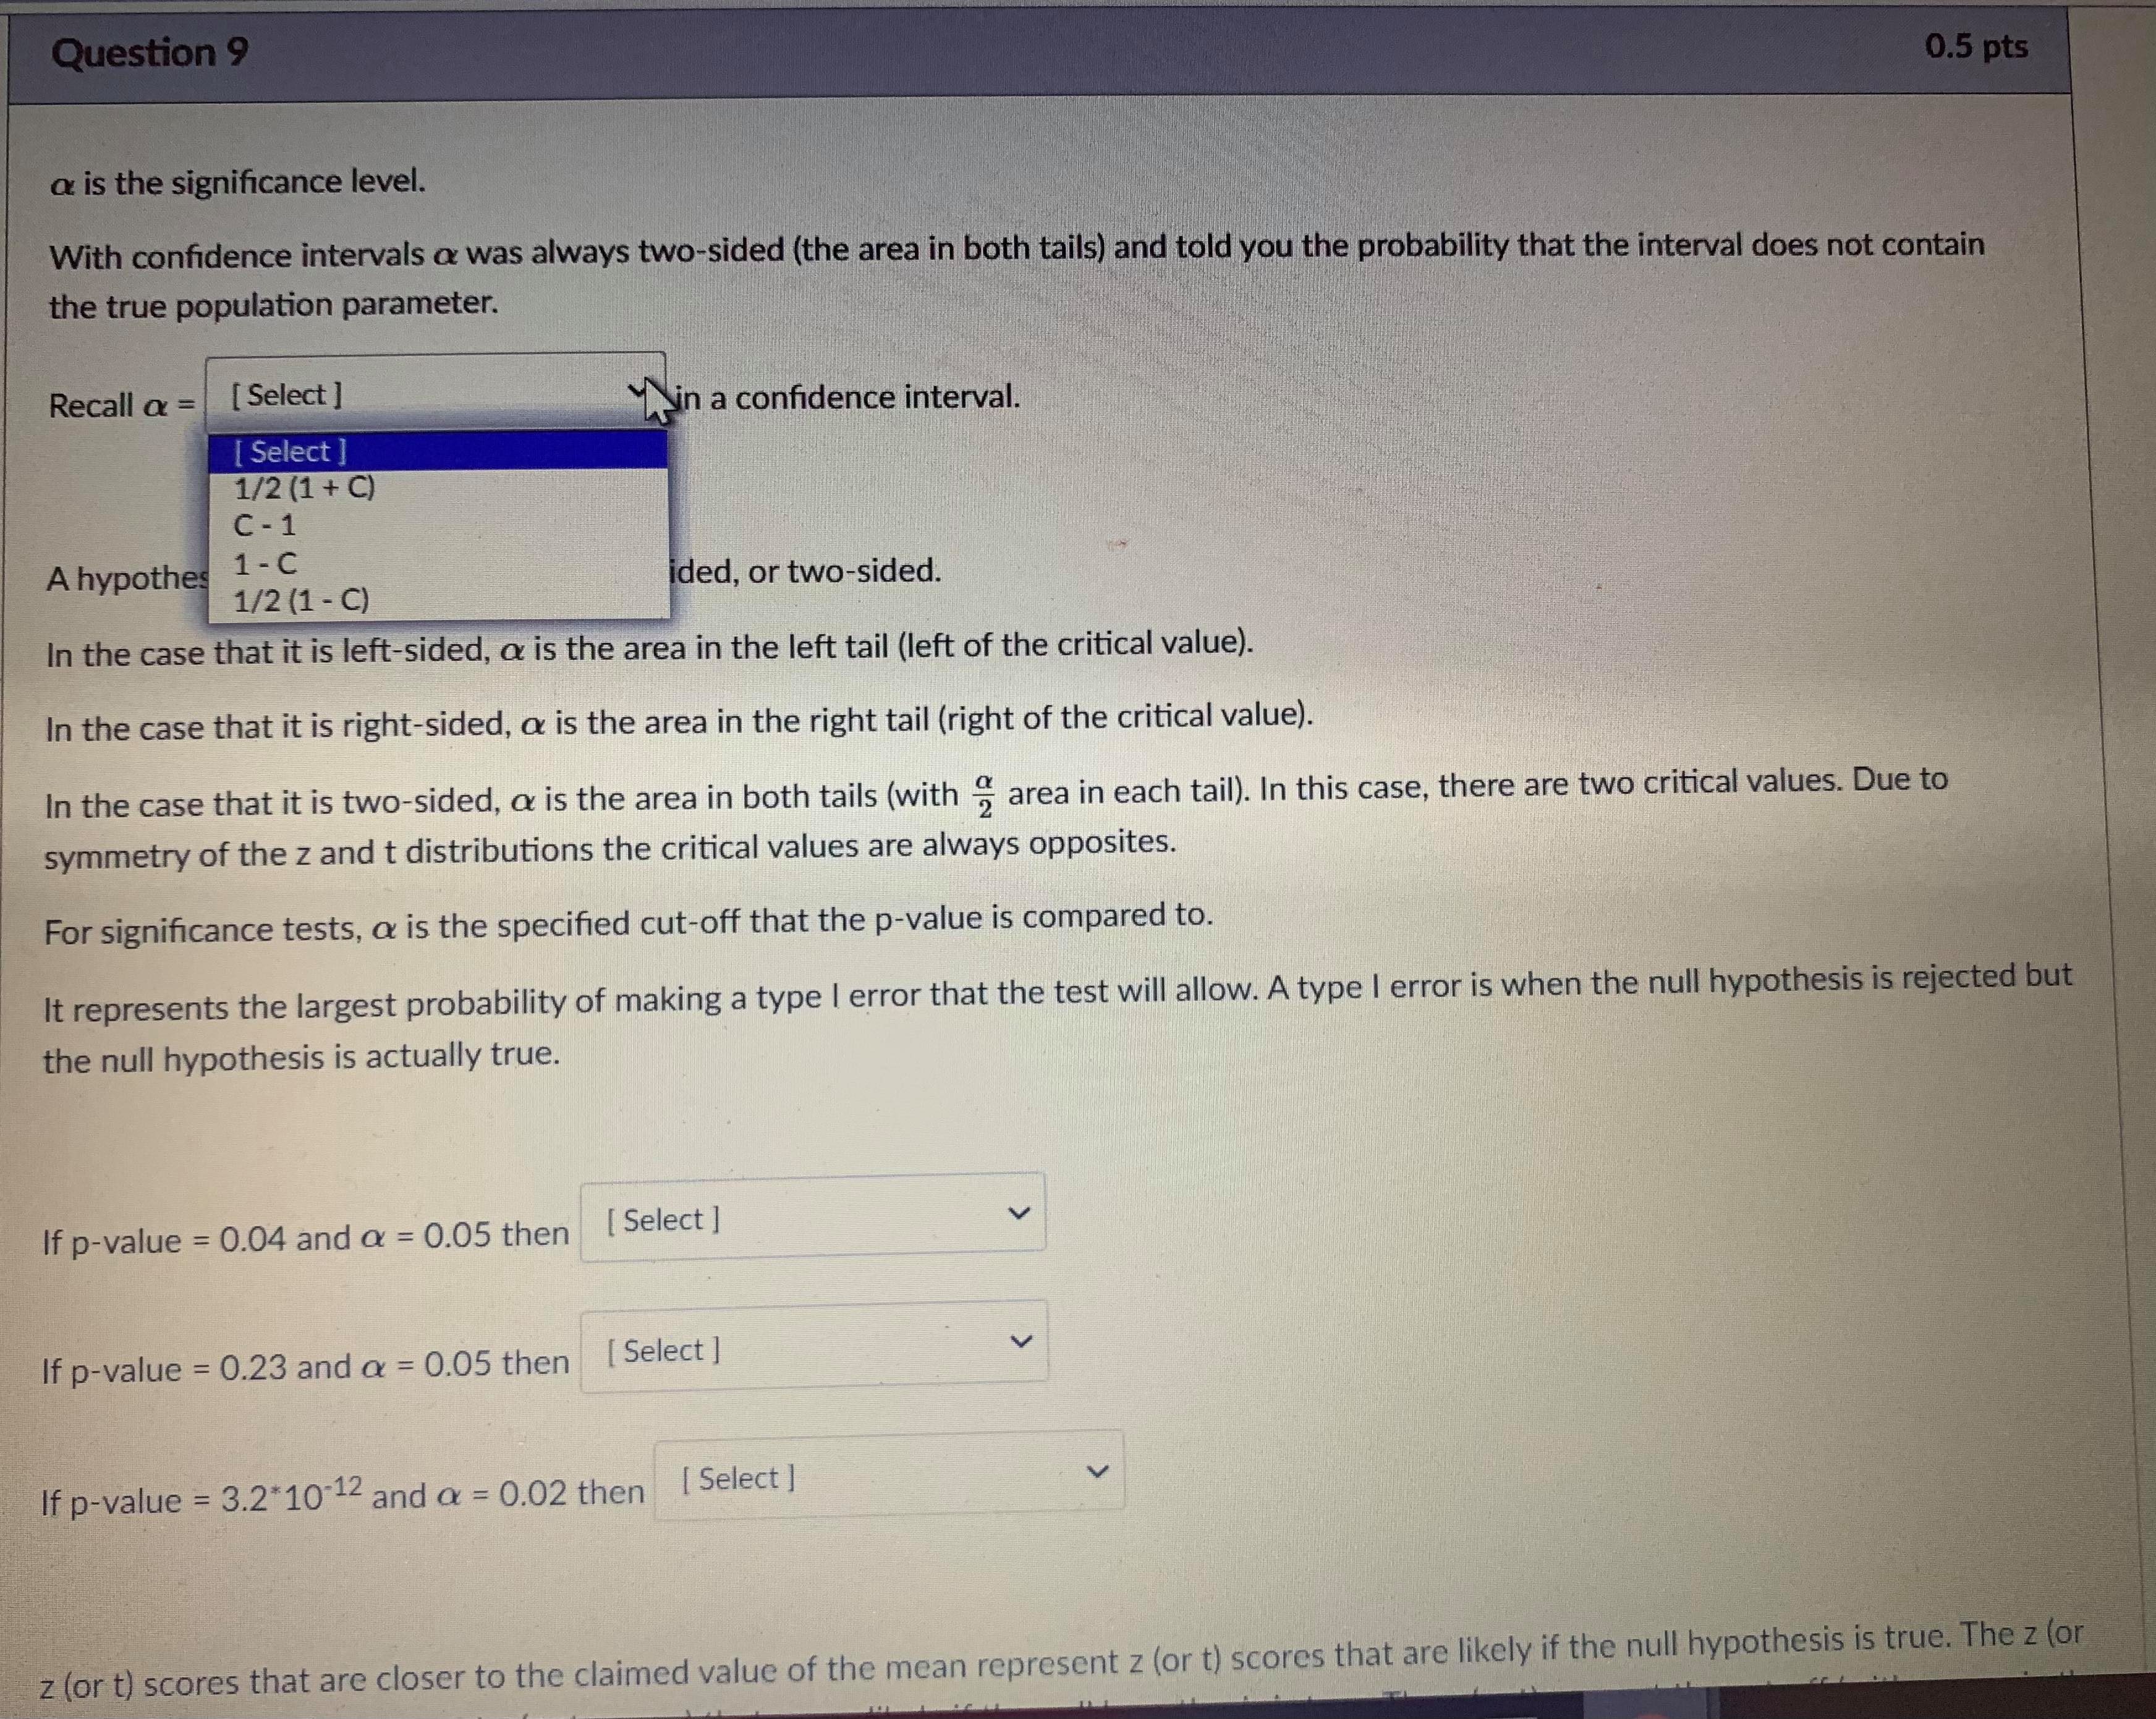
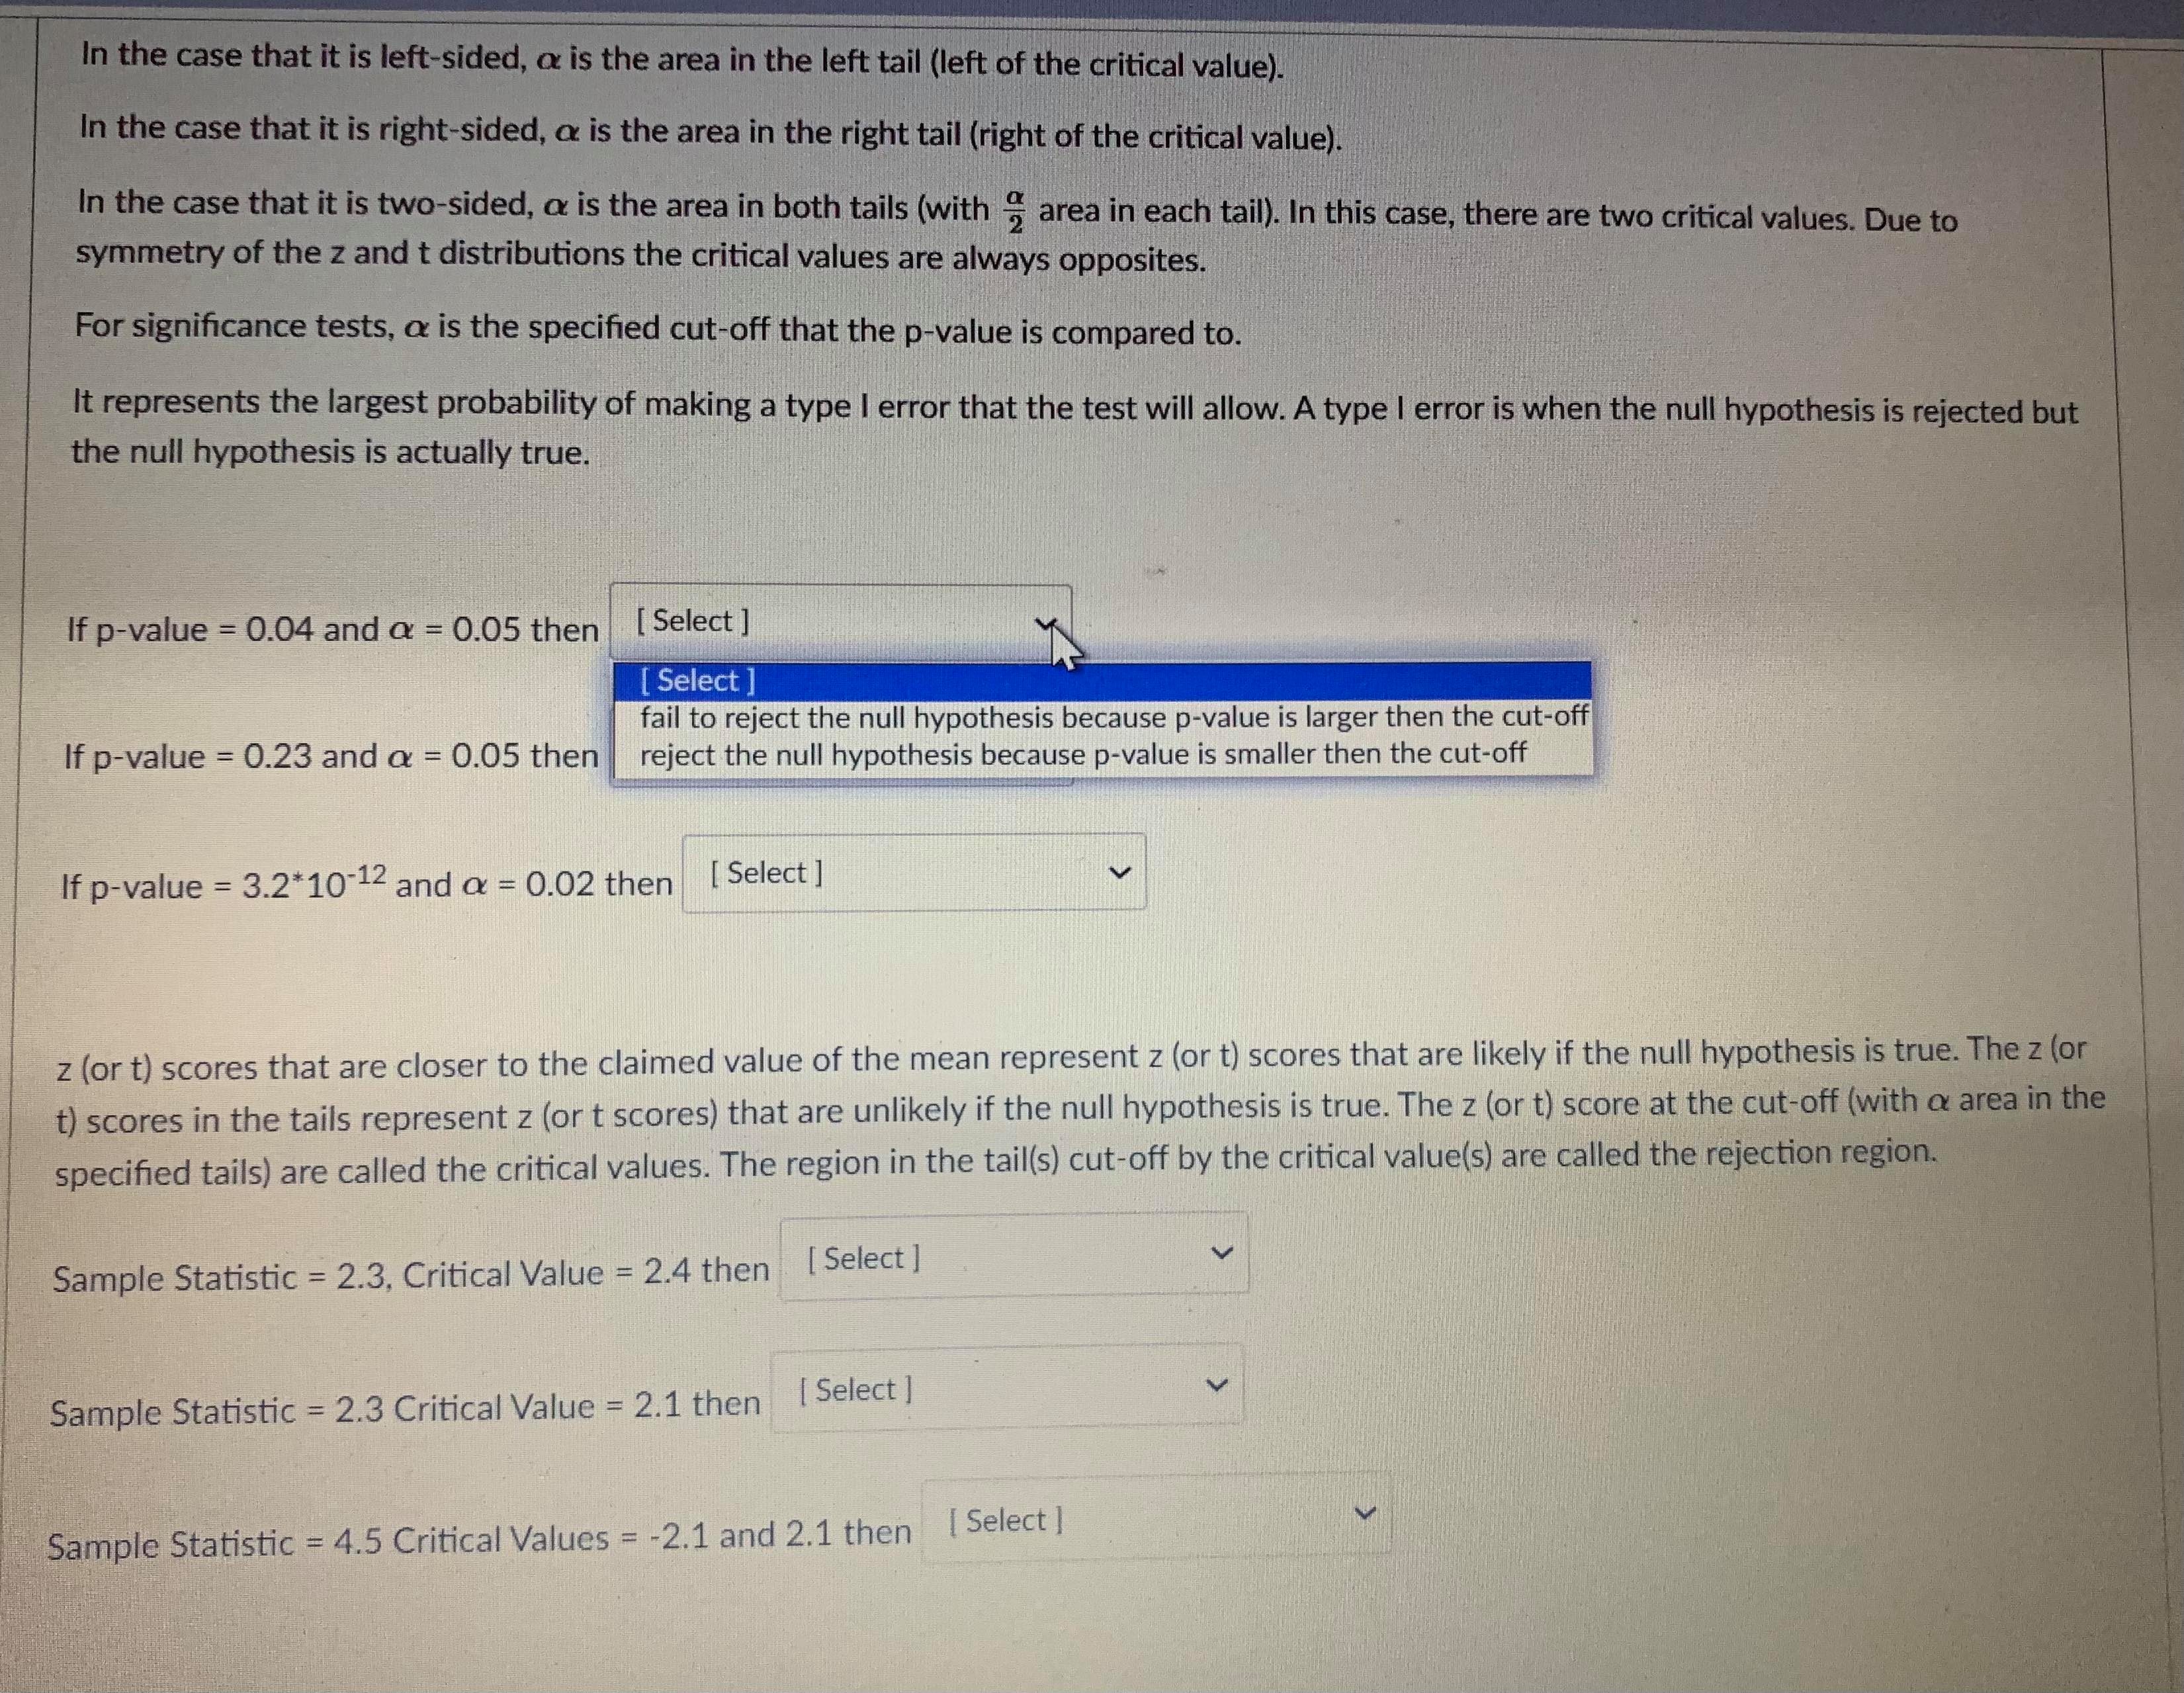
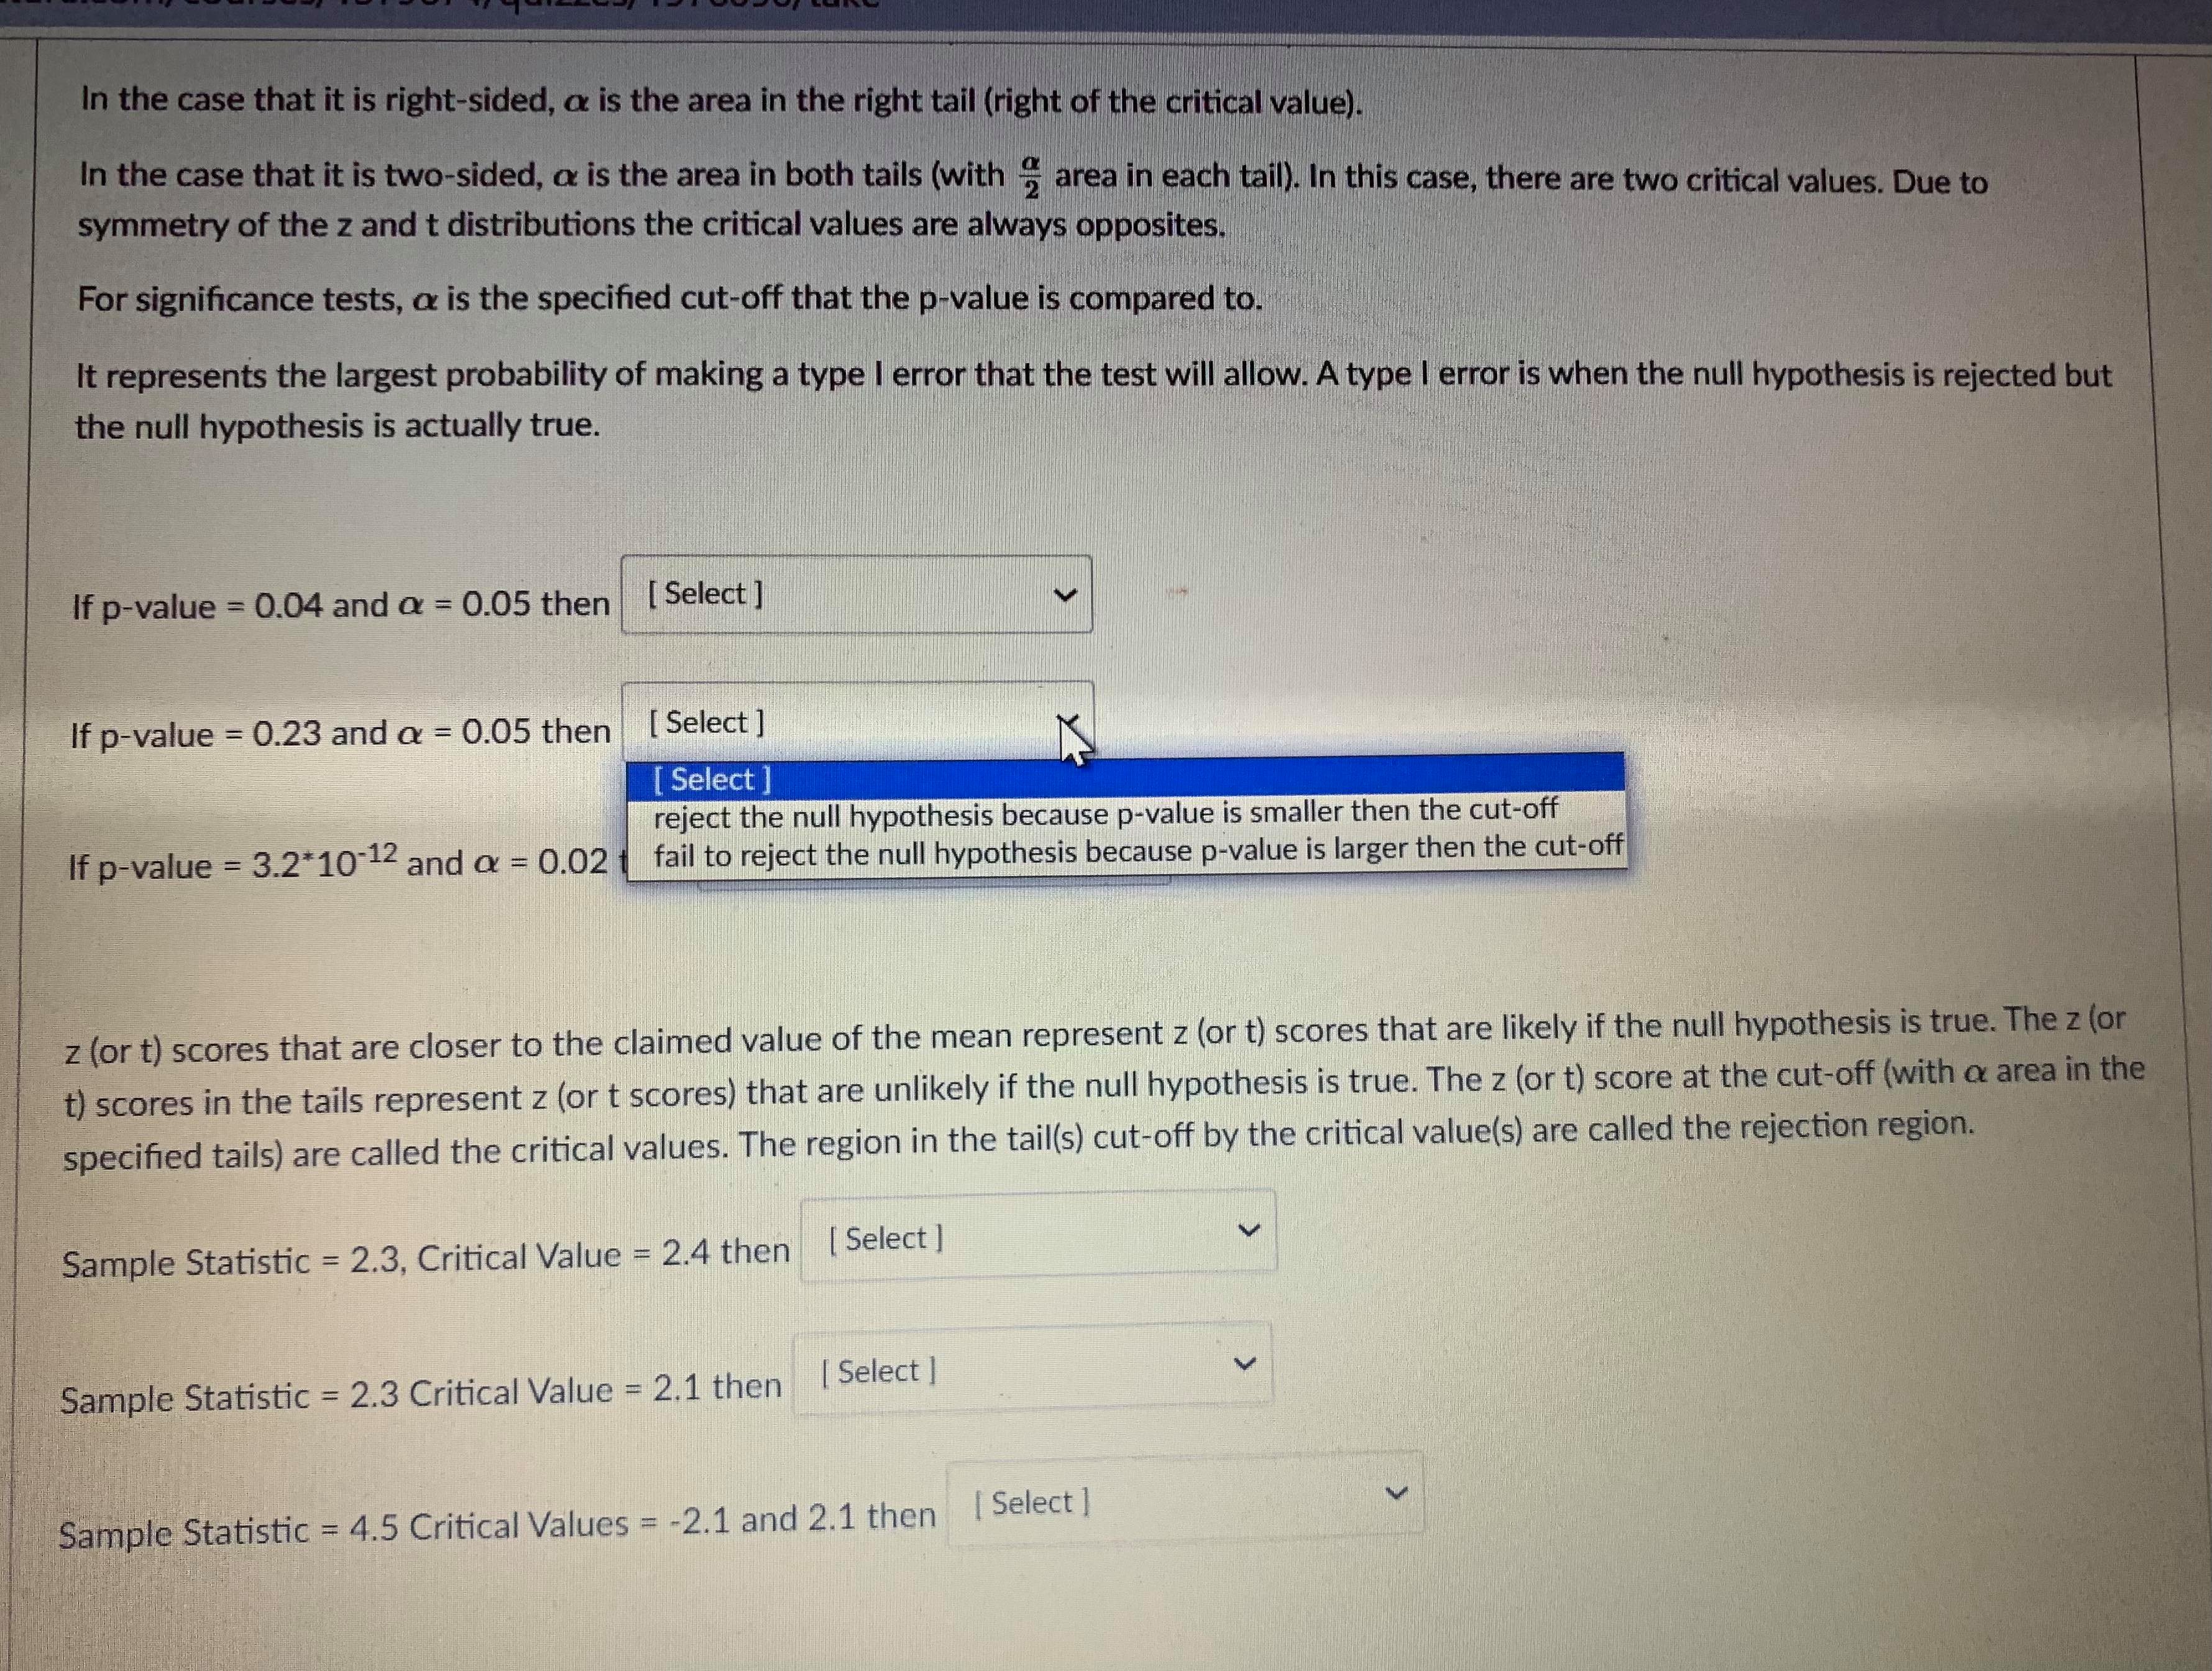
For the significance test you assume that the null hypothesis is a claimed value. O greater than O less than O not equal to O equal toIn the case that it is right-sided, o is the area in the right tail (right of the critical value). In the case that it is two-sided, o is the area in both tails (with , area in each tail). In this case, there are two critical values. Due to symmetry of the z and t distributions the critical values are always opposites. For significance tests, a is the specified cut-off that the p-value is compared to. It represents the largest probability of making a type I error that the test will allow. A type I error is when the null hypothesis is rejected but the null hypothesis is actually true. If p-value = 0.04 and a = 0.05 then [ Select ] If p-value = 0.23 and a = 0.05 then [ Select ] If p-value = 3.2*10-12 and a = 0.02 then [ Select ] z (or t) scores that are closer to the claimed value of the mean represent z (or t) scores that are likely if the null hypothesis is true. The z (or t) scores in the tails represent z (or t scores) that are unlikely if the null hypothesis is true. The z (or t) score at the cut-off (with a area in the specified tails) are called the critical values. The region in the tail(s) cut-off by the critical value(s) are called the rejection region. Sample Statistic = 2.3, Critical Value = 2.4 then [ Select ] Sample Statistic = 2.3 Critical Value = 2.1 then [ Select ] Sample Statistic = 4.5 Critical Values = -2.1 and 2.1 then [ Select ]Question 14 0.75 pts According to a 2014 research study of national student engagement in the U.S., the average college student spends 17 hours per week studying. A professor believes that students at her college study less than 17 hours per week. The professor distributes a survey to a random sample of 80 students enrolled at the college. Here are the null and alternative hypotheses for her study: H o: u = 17; Ha: u

Step by Step Solution

There are 3 Steps involved in it

Step: 1

blur-text-image

Get Instant Access to Expert-Tailored Solutions

See step-by-step solutions with expert insights and AI powered tools for academic success

Step: 2

blur-text-image

Step: 3

blur-text-image

Ace Your Homework with AI

Get the answers you need in no time with our AI-driven, step-by-step assistance

Get Started

Recommended Textbook for

A Short Course In Automorphic Functions

Authors: Joseph Lehner

1st Edition

0486799921, 9780486799926

More Books

Students also viewed these Mathematics questions

Question

How are the federal and state unemployment taxes related?

Answered: 1 week ago