I have some questions from topic "Confidence intervals for one sample proportions". Please help me figure it out. Thank you so much!
Question 1:
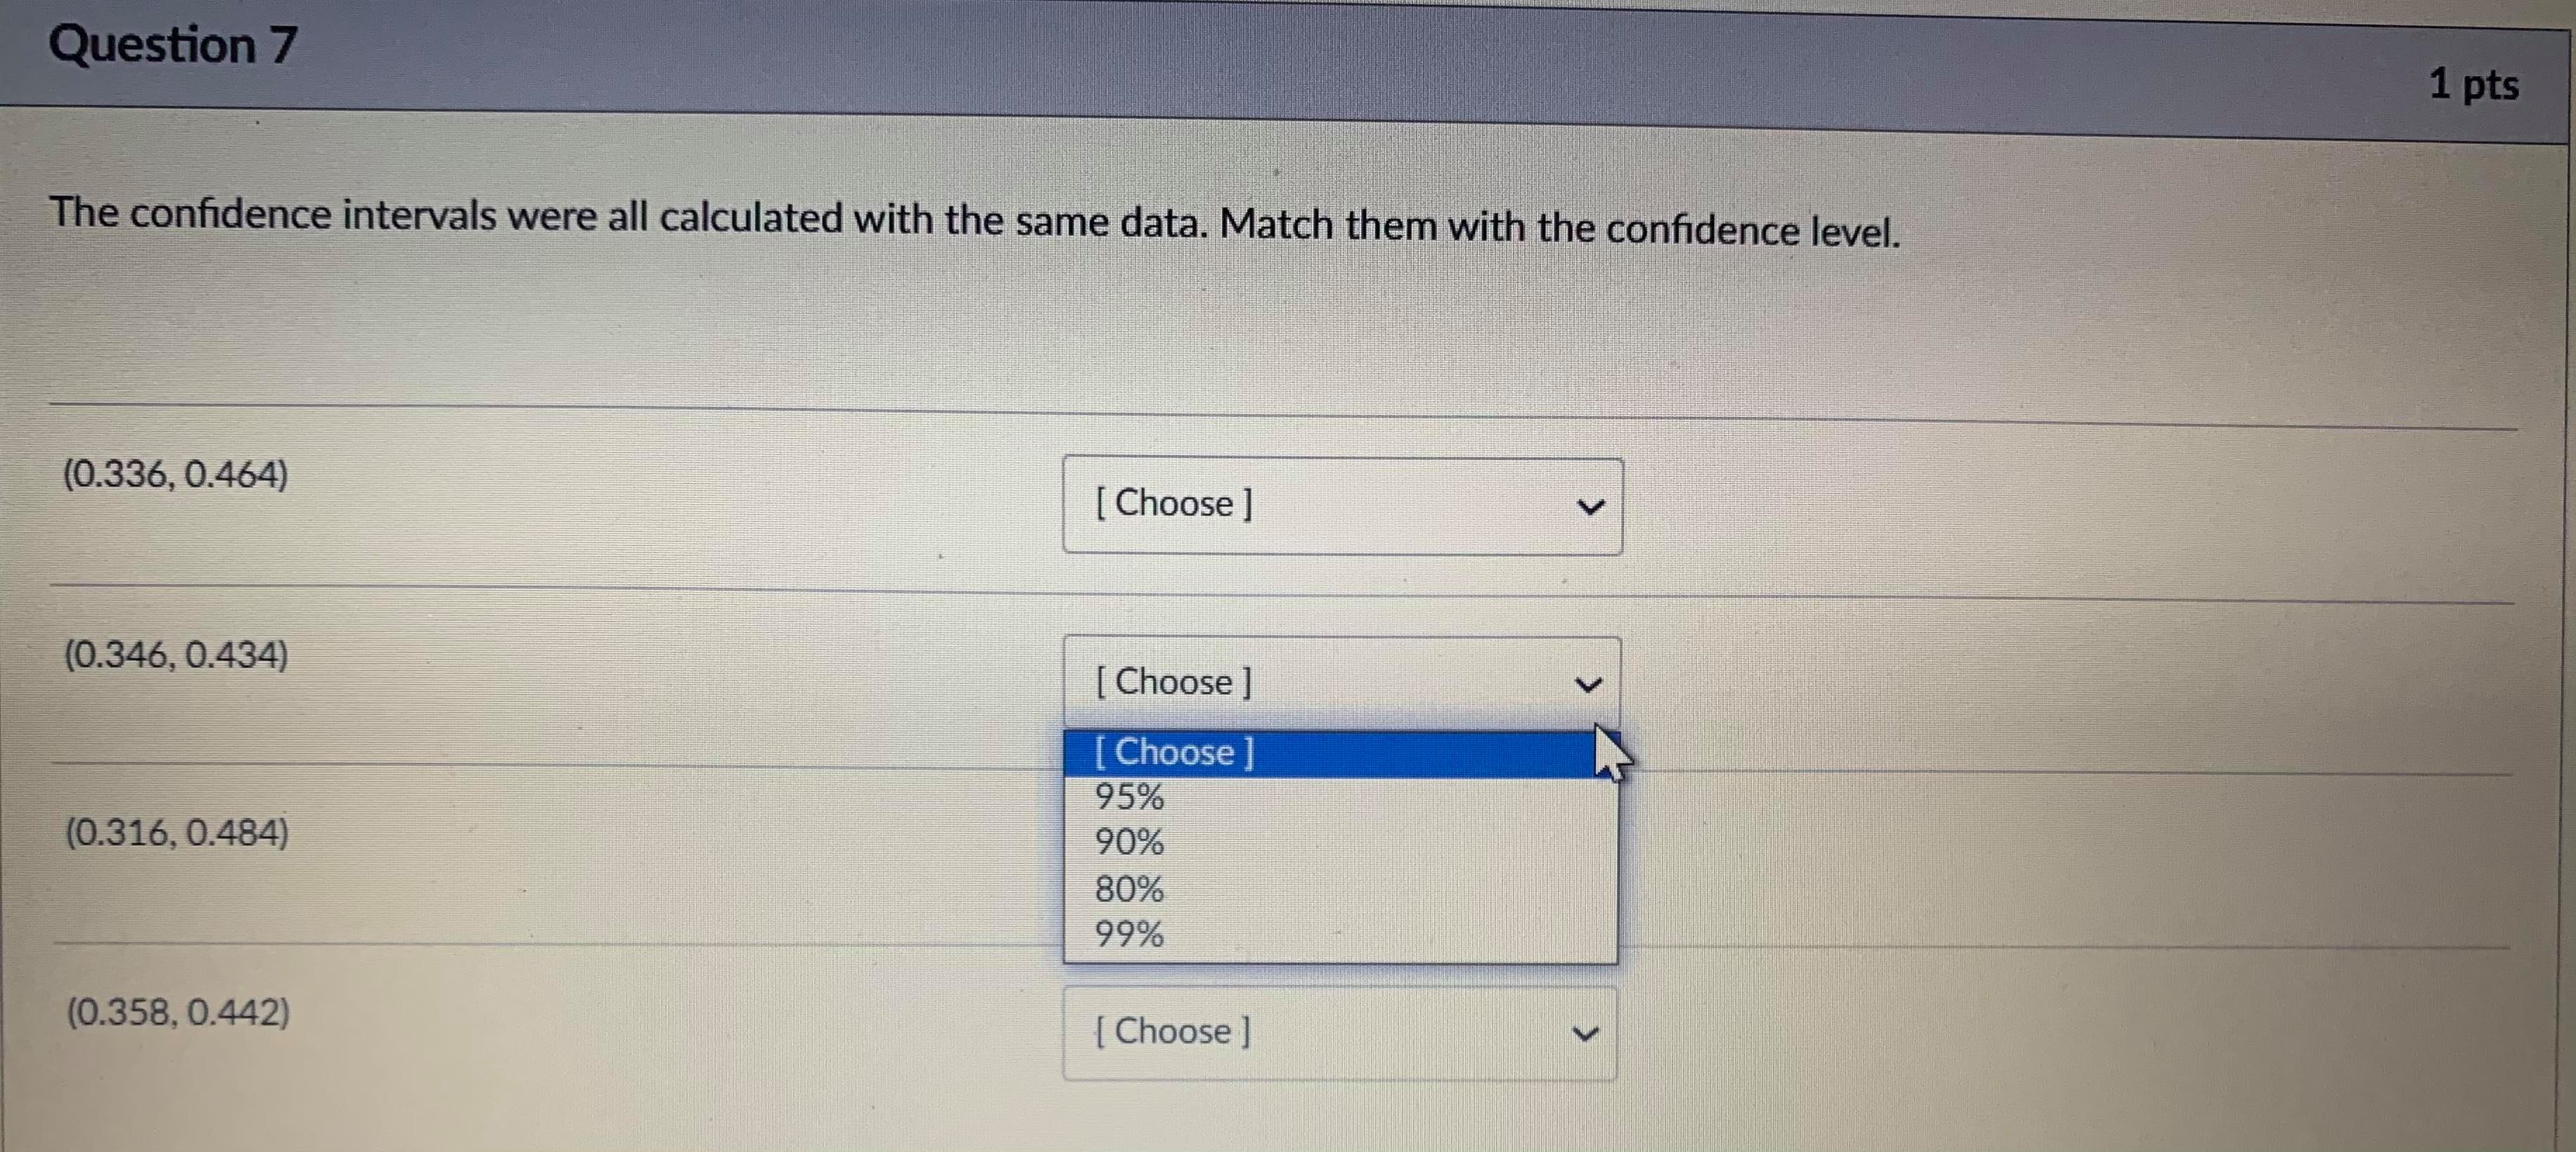
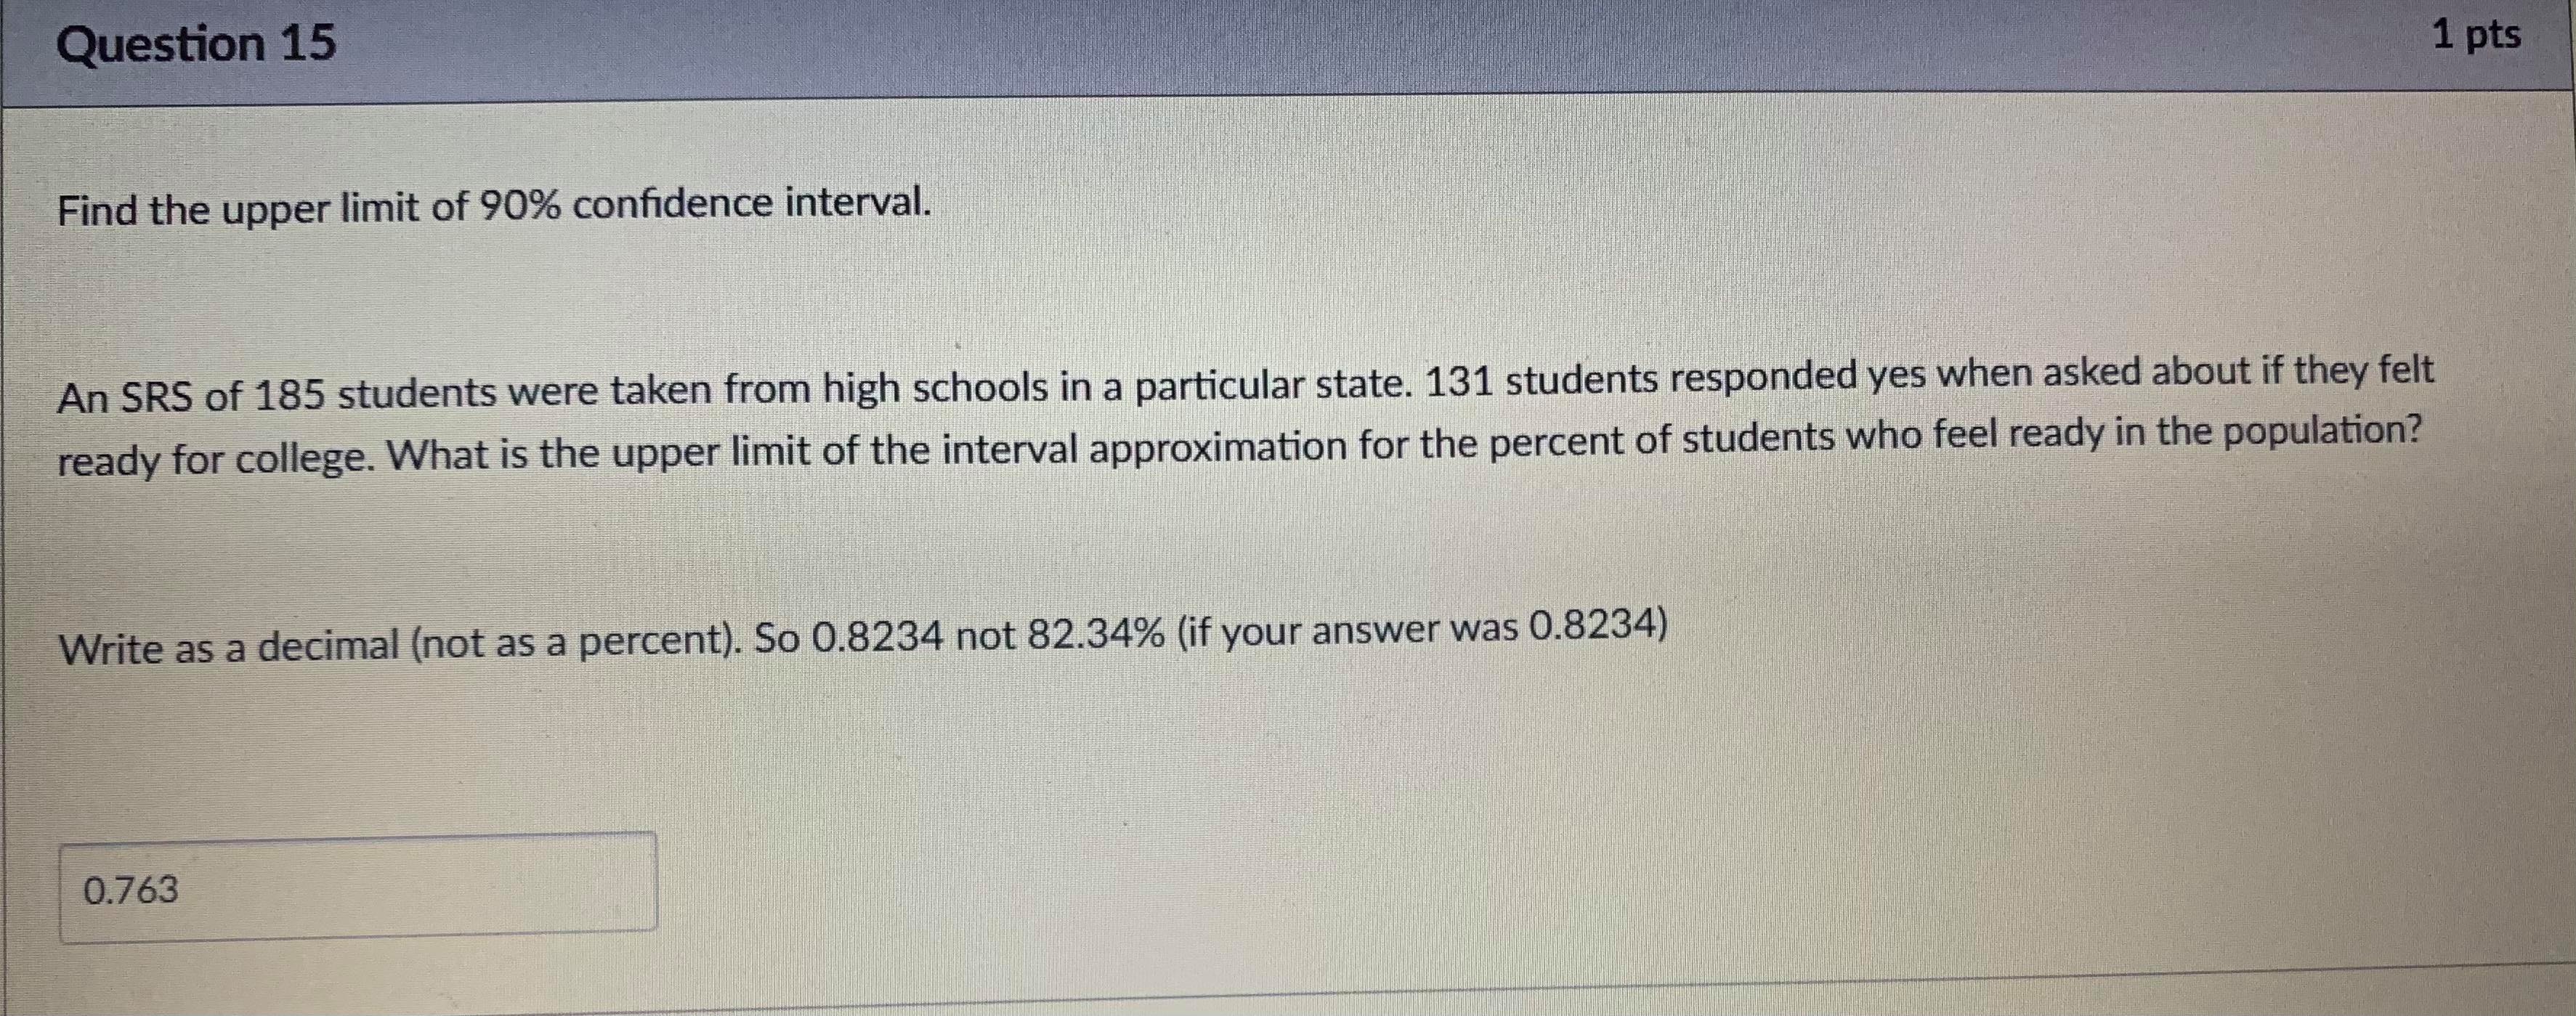
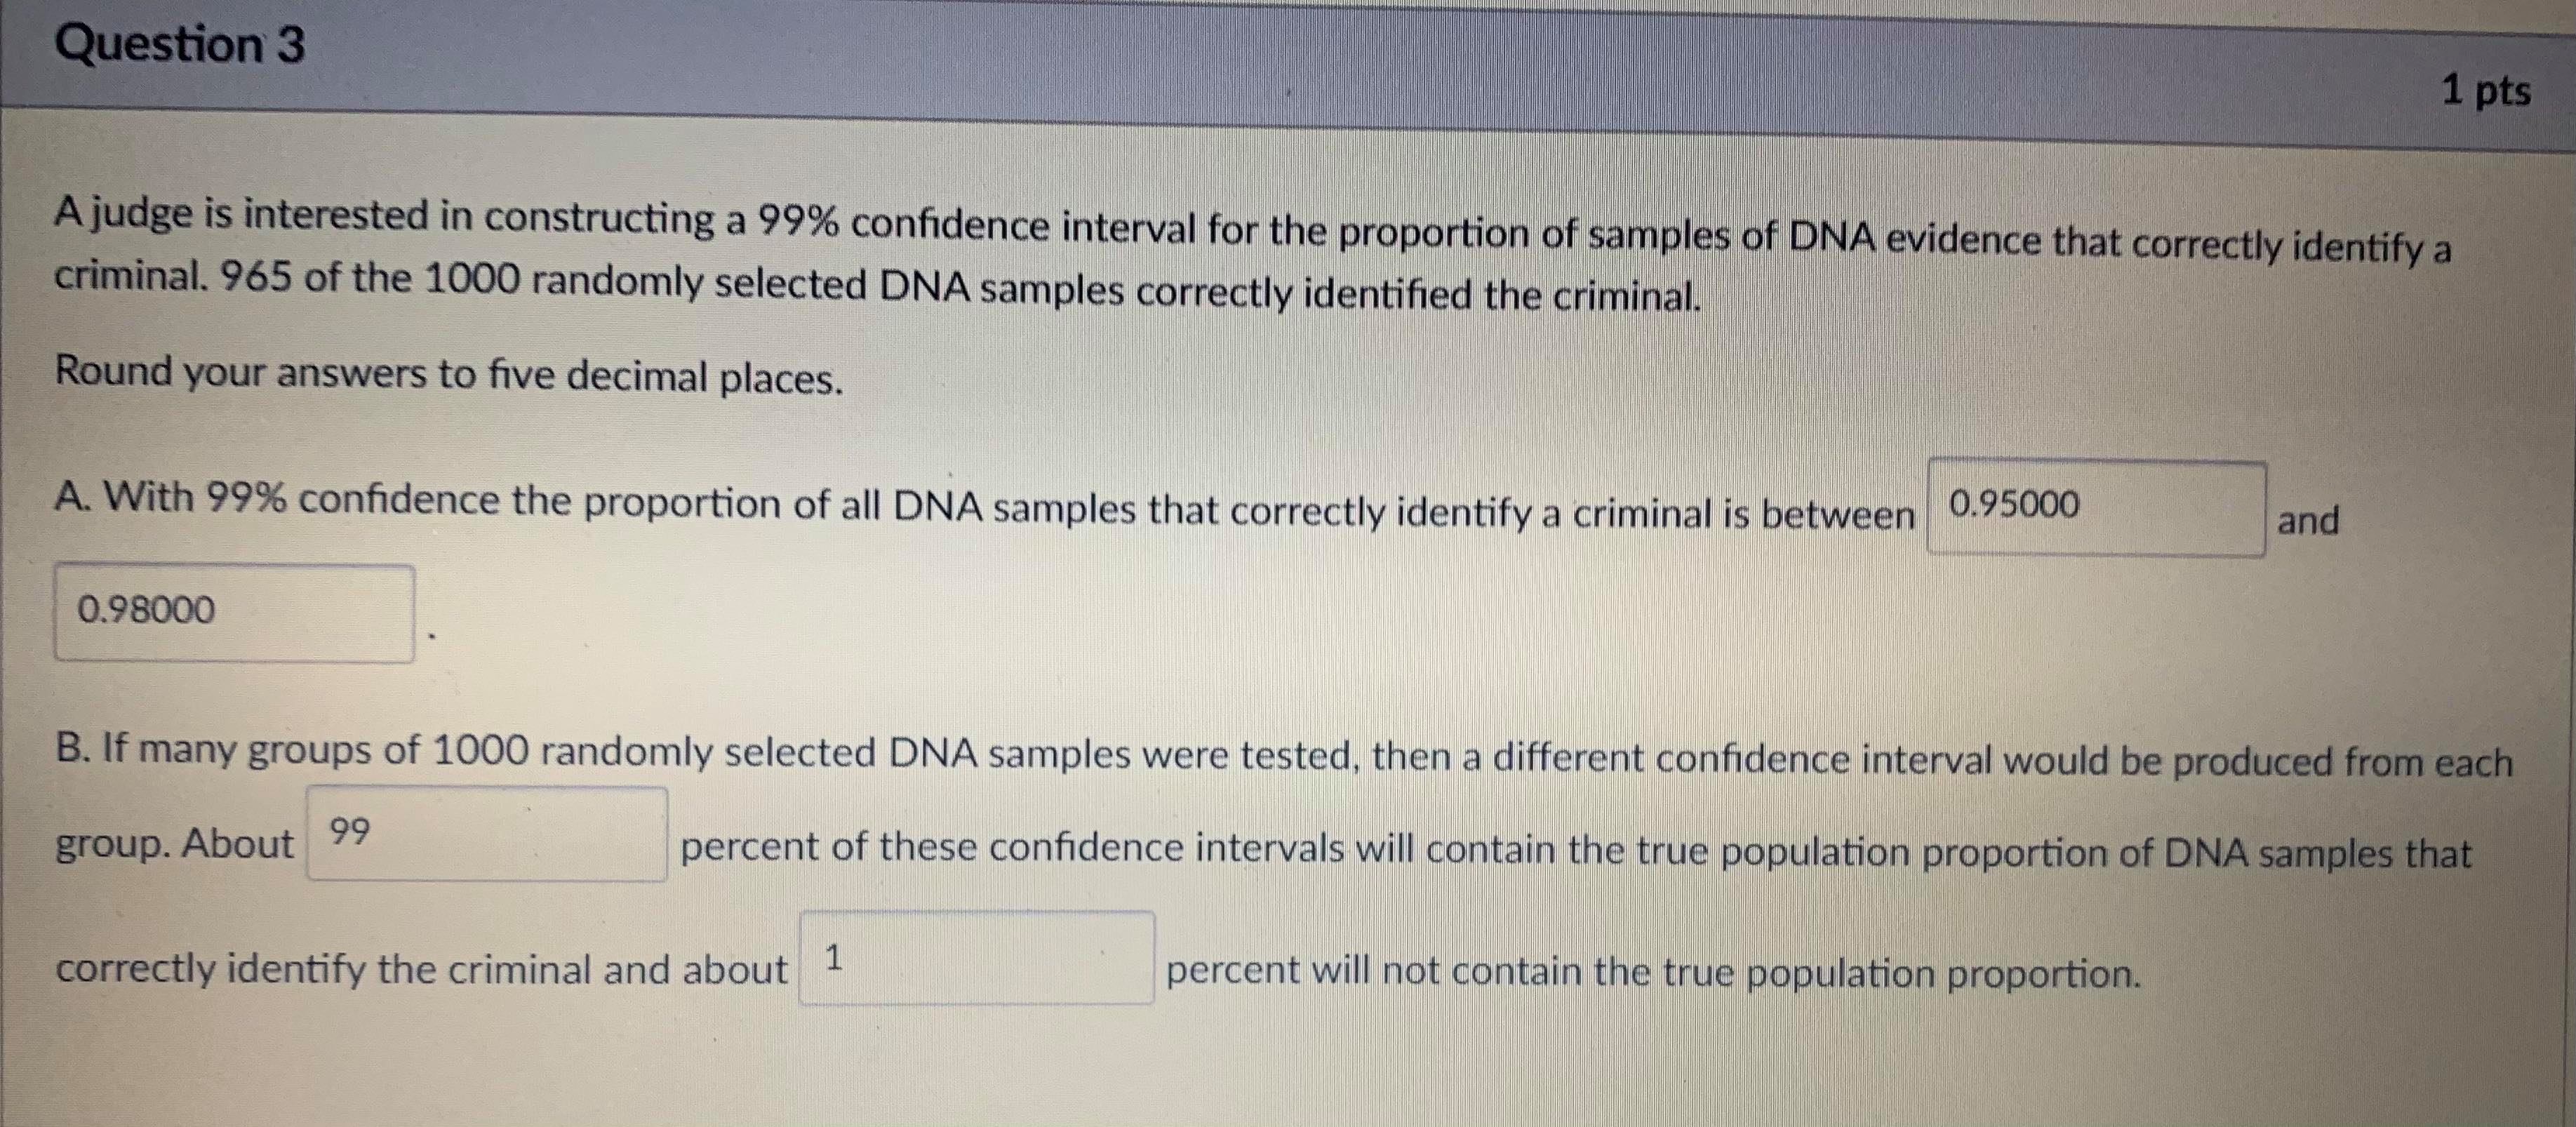
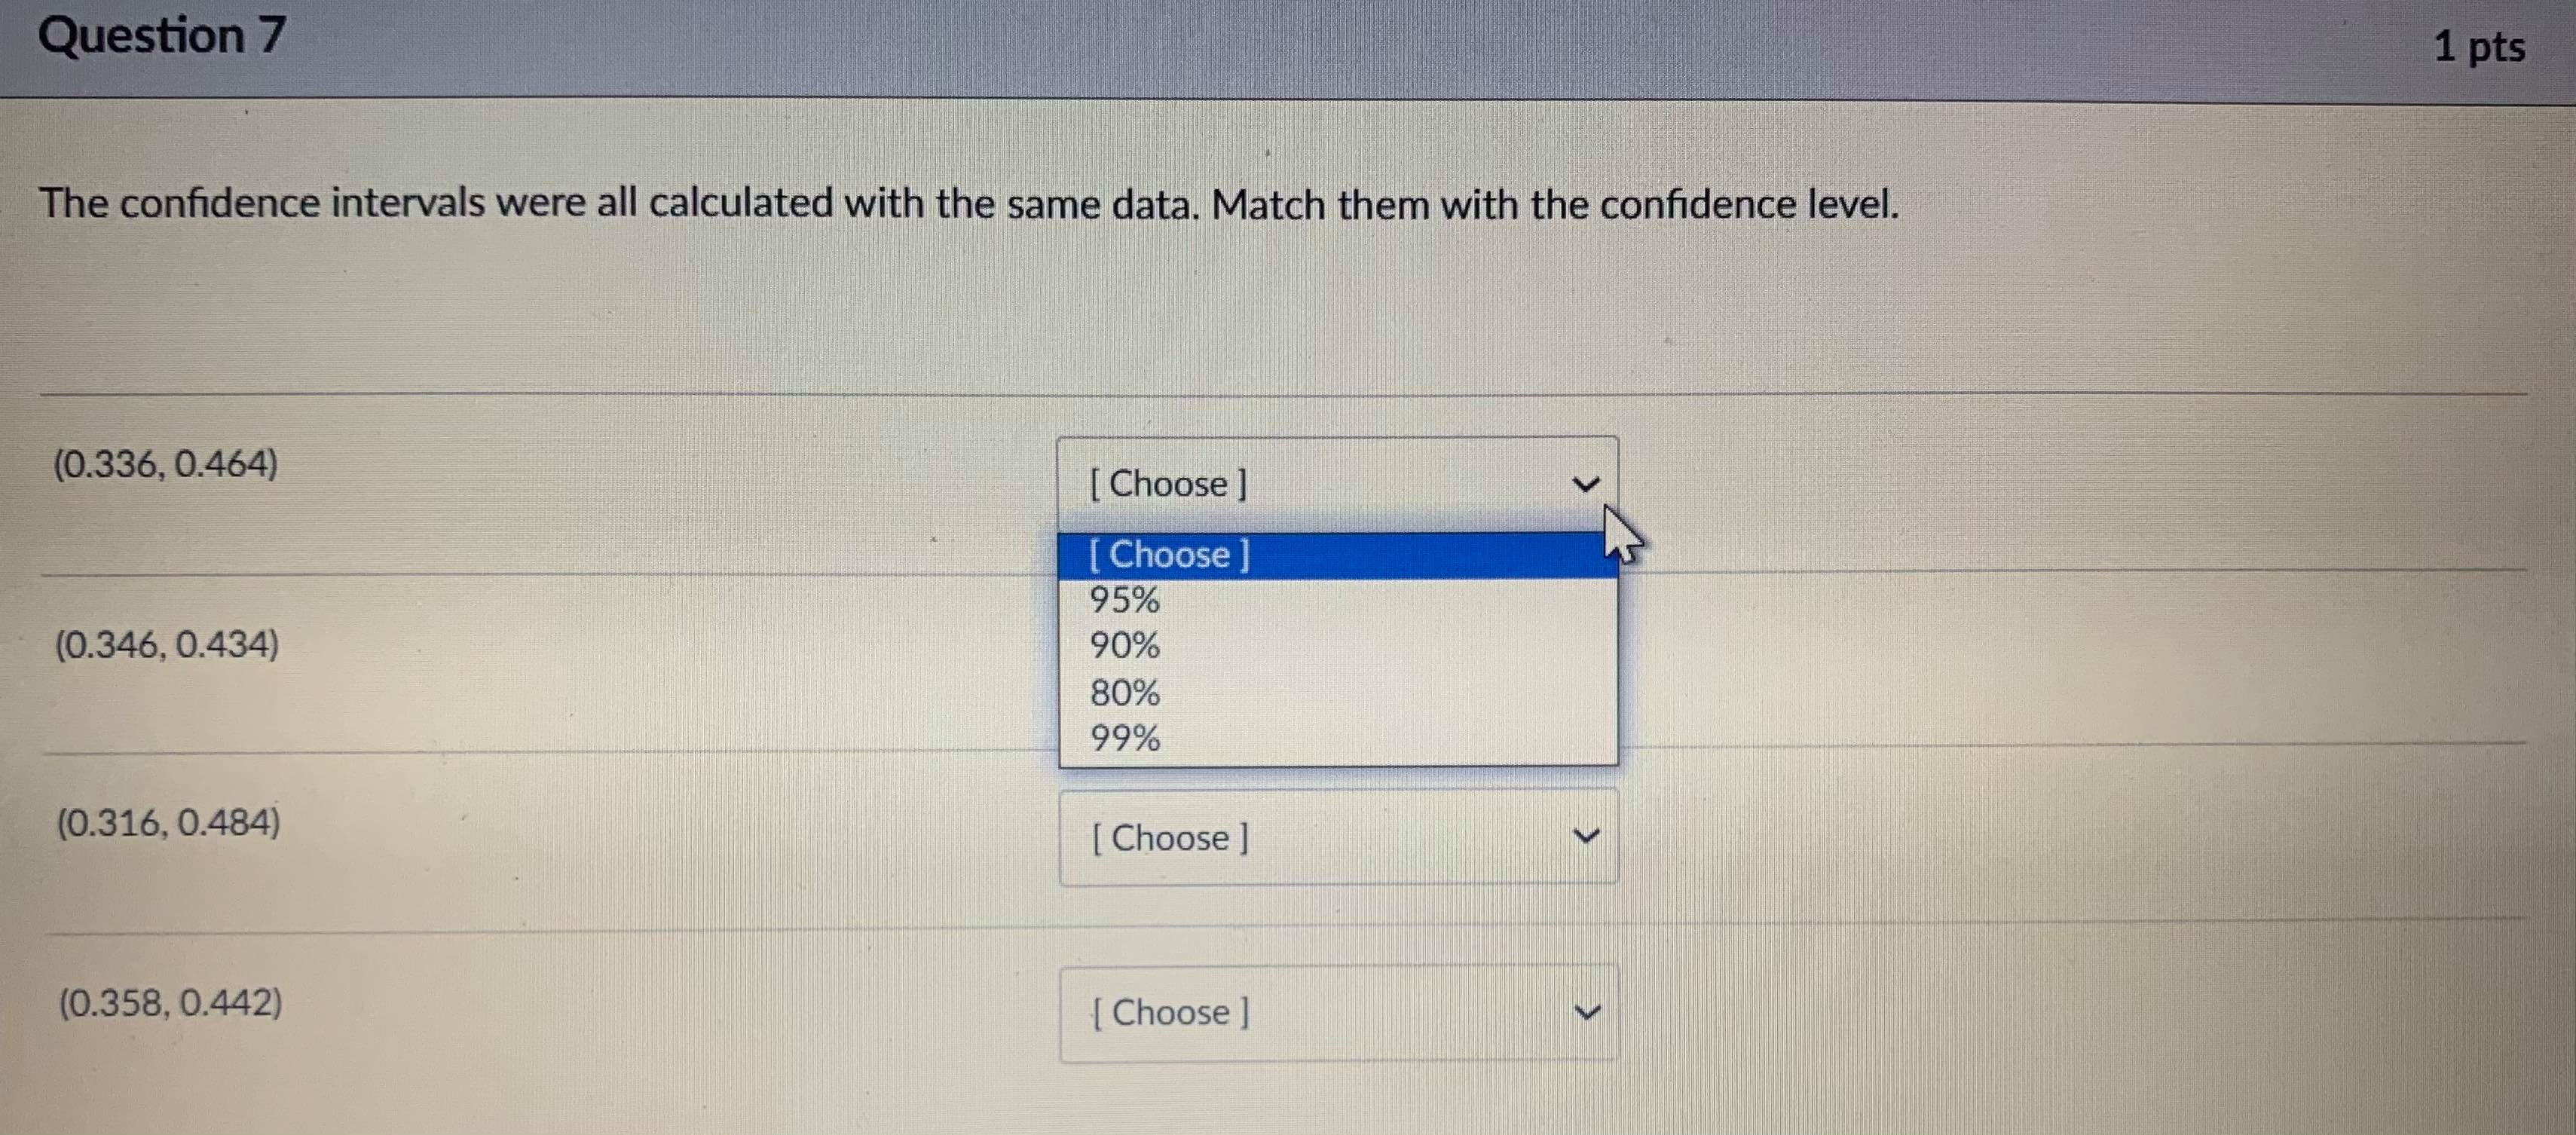
Confidence intervals for population proportions are for [ Select ] data, which satisfies all the requirements for the [ Select [ Select ] distribution. quantitative categoricalQuestion 7 1 pts The confidence intervals were all calculated with the same data. Match them with the confidence level. (0.336, 0.464) [ Choose ] v (0.346, 0.434) [ Choose ] [ Choose ] 95% (0.316, 0.484) 90% 80% 99% (0.358, 0.442) [ Choose ]Question 15 1 pts Find the upper limit of 90% confidence interval. An SRS of 185 students were taken from high schools in a particular state. 131 students responded yes when asked about if they felt ready for college. What is the upper limit of the interval approximation for the percent of students who feel ready in the population? Write as a decimal (not as a percent). So 0.8234 not 82.34% (if your answer was 0.8234) 0.763Confidence intervals for population proportions are for [ Select ] data, which satisfies all the requirements for the [ Select ] distribution. Select uniform binomial normalQuestion 3 1 pts A judge is interested in constructing a 99% confidence interval for the proportion of samples of DNA evidence that correctly identify a criminal. 965 of the 1000 randomly selected DNA samples correctly identified the criminal. Round your answers to five decimal places. A. With 99% confidence the proportion of all DNA samples that correctly identify a criminal is between 0.95000 and 0.98000 B. If many groups of 1000 randomly selected DNA samples were tested, then a different confidence interval would be produced from each group. About 99 percent of these confidence intervals will contain the true population proportion of DNA samples that correctly identify the criminal and about 1 percent will not contain the true population proportion.Question 4 1 pts The best single value estimate of the population parameter is the sample statistic [ Select ] sample size [ Select ] V are used to create an estimate for sample statistic that corrects for bias due to population parameter [ Select ]Question 4 1 pts The best single value estimate of the population parameter is the sample statistic [ Select ] are used to create an estimate for [ Select ] that corrects for bias due to [ Select ] Confidence intervals Hypothesis tests Statistical graphsQuestion 4 1 pts The best single value estimate of the population parameter is the sample statistic [ Select ] are used to create an estimate for [ Select ] that corrects for bias due to [Select ] [ Select ] the sample size the population parameter the sample statisticQuestion 4 1 pts The best single value estimate of the population parameter is the sample statistic [ Select ] are used to create an estimate for [ Select ] V that corrects for bias due to [ Select ] Select ] sampling bias due to not being a random sample. sampling bias such as loaded questions. natural variation in the population.Question 7 1 pts The confidence intervals were all calculated with the same data. Match them with the confidence level. (0.336, 0.464) [ Choose ] [ Choose 95% (0.346, 0.434) 90% 80% 99% (0.316, 0.484) [ Choose ] (0.358, 0.442) [ Choose ]


