Answered step by step
Verified Expert Solution
Question
1 Approved Answer
I have started the ratios but unsure of accuracy. need help with the remainder please. 1 Ratios 2019 2021 2022 0.578 0.19 1% 10% 95%
I have started the ratios but unsure of accuracy. need help with the remainder please. 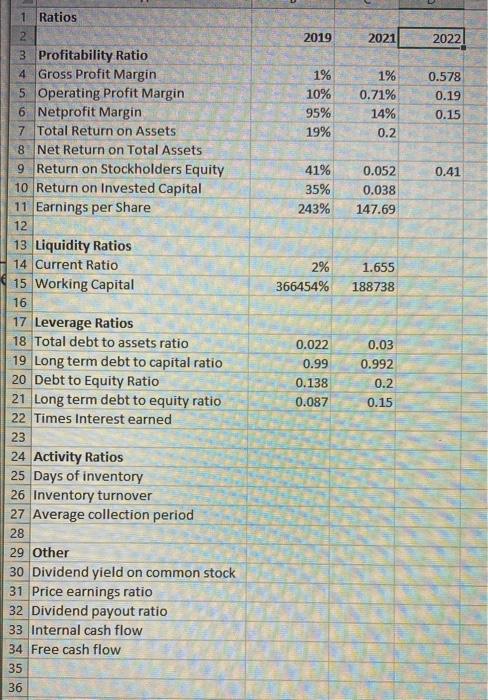
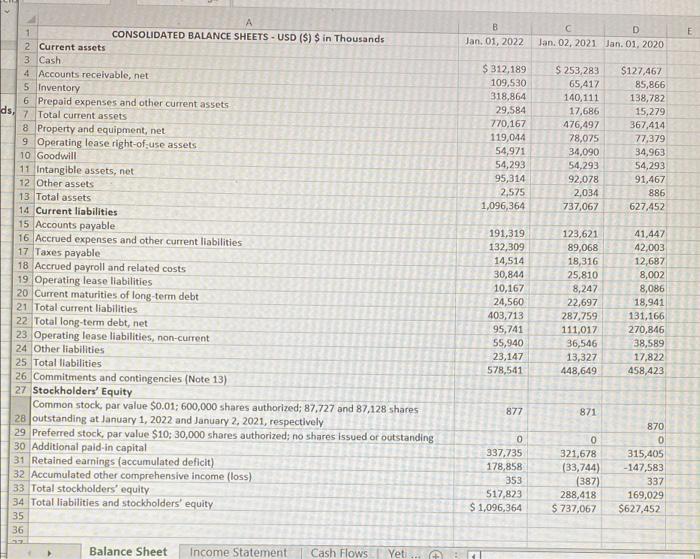
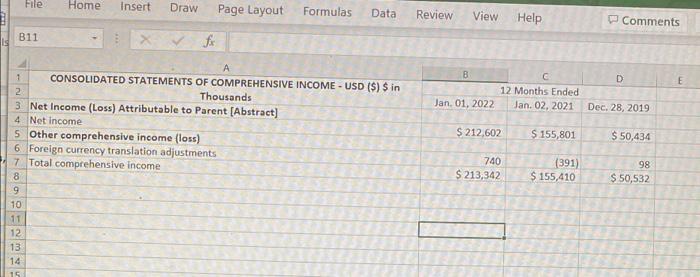
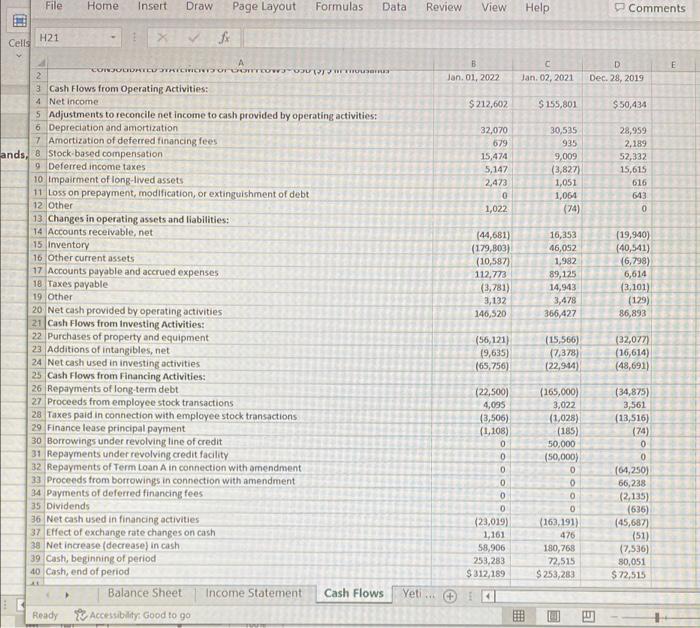
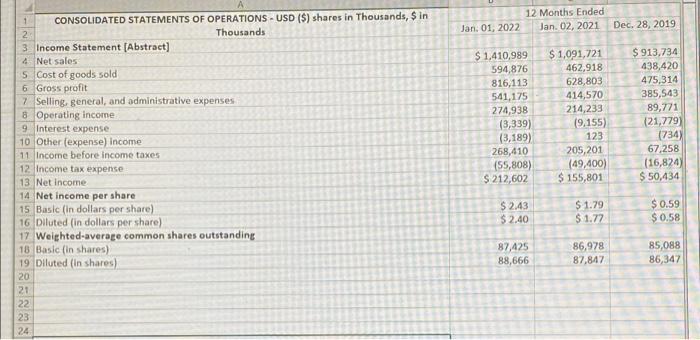
1 Ratios 2019 2021 2022 0.578 0.19 1% 10% 95% 19% 1% 0.71% 14% 0.2 0.15 0.41 41% 35% 243% 0.052 0.038 147.69 1.655 2% 366454% 188738 2 3 Profitability Ratio 4 Gross Profit Margin 5 Operating Profit Margin 6 Netprofit Margin 7 Total Return on Assets 8 Net Return on Total Assets 9 Return on Stockholders Equity 10 Return on invested Capital 11 Earnings per Share 12 13 Liquidity Ratios 14 Current Ratio 15 Working Capital 16 17 Leverage Ratios 18 Total debt to assets ratio 19 Long term debt to capital ratio 20 Debt to Equity Ratio 21 Long term debt to equity ratio 22 Times Interest earned 23 24 Activity Ratios 25 Days of inventory 26 Inventory turnover 27 Average collection period 28 29 Other 30 Dividend yield on common stock 31 Price earnings ratio 32 Dividend payout ratio 33 Internal cash flow 34 Free cash flow 35 0.022 0.99 0.03 0.992 0.2 0.15 0.138 0.087 36 B Jan. 01, 2022 E D Jan. 02, 2021 Jan. 01, 2020 $ 312,189 109.530 318,864 29,584 770,167 119,044 54,971 54,293 95,314 2,575 1,096,364 S 253,283 65,417 140, 111 17,686 476,497 78,075 34,090 54,293 92,078 2,034 737,067 $127,467 85,866 138,782 15,279 367,414 77,379 34,963 54,293 91,467 886 627,452 1 CONSOLIDATED BALANCE SHEETS - USD ($) $ in Thousands 2 Current assets 3 Cash 4. Accounts receivable, net 5 Inventory 6 Prepaid expenses and other current assets ds, 7 Total current assets 8 Property and equipment, net 9 Operating lease right-of-use assets 10 Goodwill 11 Intangible assets, net 12 Other assets 13 Total assets 14 Current liabilities 15 Accounts payable 16 Accrued expenses and other current liabilities 17 Taxes payable 18 Accrued payroll and related costs 19 Operating lease liabilities 20 Current maturities of long-term debt 21 Total current liabilities 22 Total long-term debt, net 23 Operating lease liabilities, non-current 24 Other liabilities 25 Total liabilities 26 Commitments and contingencies (Note 13) 27 Stockholders' Equity Common stock, par value $0.01; 600,000 shares authorized: 87.727 and 87,128 shares 28 outstanding at January 1, 2022 and January 2, 2021, respectively 29 Preferred stock, par value $10:30,000 shares authorized; no shares issued or outstanding 30 Additional paid in capital 31 Retained earnings (accumulated deficit) 32 Accumulated other comprehensive Income (loss) 33 Total stockholders' equity 34 Total liabilities and stockholders' equity 35 36 Balance Sheet Income Statement Cash Flows Yeti... 191,319 132,309 14,514 30,844 10,167 24,560 403,713 95,741 55,940 23,147 578,541 123,621 89,068 18,316 25,810 8,247 22,697 287,759 111,017 36,546 13,327 448,649 41,447 42,003 12,687 8,002 8,086 18,941 131,166 270,846 38,589 17,822 458,423 877 871 0 337,735 178,858 353 517,823 $ 1,096,364 0 321,678 (33,744) (387) 288,418 $ 737,067 870 0 315,405 -147,583 337 169,029 $627,452 File Home Insert Draw Page Layout Formulas Data Review View Help Comments B11 fi 1 B D E 2 C 12 Months Ended Jan. 02, 2021 Jan. 01, 2022 Dec. 28, 2019 $ 212,602 $ 155,801 $ 50,434 CONSOLIDATED STATEMENTS OF COMPREHENSIVE INCOME- USD ($) $ in Thousands 3 Net Income (Loss) Attributable to Parent (Abstract] 4 Net Income 5 Other comprehensive income (loss) 6 Foreign currency translation adjustments 17 Total comprehensive income 8 9 10 11 12 13 14 740 $ 213,342 (391) $ 155,410 98 $ 50,532 15. File Home Insert Draw Page Layout Formulas Data Review View Help Comments 111 H21 Cells C E B Jan. 01, 2022 D Dec. 28, 2019 Jan 02, 2021 $ 212,602 $ 155,801 $ 50,434 30,535 935 9,009 32,070 679 15,474 5,147 2,473 0 1,022 (3,827) 1,051 1,064 (74) 28,959 2.189 52,332 15,615 616 643 0 (44,681) (179,803) (10,587) 112,773 (3,781) 3,132 146,520 16,353 46,052 1,982 89,125 14,943 3,478 366,427 (19,940) (40,541) (6,798) 6,614 (3,101) (129) 86,893 CONOCORTCUT CTCW VOIROTTWEWS 2 3 Cash Flows from Operating Activities: 4 Net income 5 Adjustments to reconcile net income to cash provided by operating activities: 6 Depreciation and amortization 7 Amortization of deferred financing fees ands, 8 Stock-based compensation 9 Deferred income taxes 10 Impairment of long-lived assets 11 Loss on prepayment, modification, or extinguishment of debt 12 Other 13. Changes in operating assets and liabilities: 14 Accounts receivable, net 15. Inventory 16 Other current assets 17 Accounts payable and accrued expenses 18 Taxes payable 19 Other 20 Net cash provided by operating activities 21 Cash Flows from Investing Activities: 22 Purchases of property and equipment 23 Additions of intangibles.net 24 Net cash used in investing activities 25 Cash Flows from Financing Activities: 26 Repayments of long-term debt 27 Proceeds from employee stock transactions 28 Taxes paid in connection with employee stock transactions 29 Finance lease principal payment 30 Borrowings under revolving line of credit 31 Repayments under revolving credit facility 32 Repayments of Term Loan A in connection with amendment 33. Proceeds from borrowings in connection with amendment 34 Payments of deferred financing fees 35 Dividends 36 Net cash used in financing activities 37 Effect of exchange rate changes on cash 38 Net increase (decrease) in cash 39 Cash, beginning of period 40 Cash, end of period Balance Sheet Income Statement Cash Flows Ready Accessibility: Good to 90 (56,121) 19,635) (65,756) (15,566) (7,378) (22,944 (32,077) (16,614) (48,691) (22,500) 4,095 (3,506) (1,108) 0 0 (34,875) 3,561 (13,516) (74) 0 O 0 0 0 (23,019) 1,161 58,906 253,283 $312,189 (165,000) 3,022 (1.028) (185) 50,000 (50,000) 0 0 0 0 163,191) 476 180,768 72,515 $ 253,283 (04,250) 66,238 (2,135) (636) (45,687) (51) (7,536) 80,051 $ 72,515 Yeti...t 12 Months Ended Jan 02, 2021 Jan. 01, 2022 Dec. 28, 2019 1 CONSOLIDATED STATEMENTS OF OPERATIONS - USD ($) shares in Thousands, $ in 2 Thousands 3. Income Statement (Abstract) 4. Net sales Cost of goods sold 6 Gross profit 7 Selling general, and administrative expenses 8 Operating income 9 Interest expense 10 Other (expense) Income 11 Income before income taxes 12 Income tax expense 13 Net Income 14 Net income per share 15 Basic (in dollars per share) 16 Diluted (in dollars per share) 17 Weighted-average common shares outstanding 18 Basic (in shares) 19 Diluted (In shares) 20 21 22 23 24 $ 1,410,989 594,876 816,113 541,175 274,938 (3,339) (3,189) 268,410 (55,808) $ 212,602 $ 1,091,721 462,918 628,803 414,570 214,233 (9,155) 123 205,201 (49,400) $ 155,801 $ 913.734 438,420 475,314 385,543 89,771 (21,779) (734) 67,258 (16,824) $ 50,434 $ 2.43 $2.40 $ 1.79 $ 1.77 $ 0.59 $ 0.58 87,425 88,666 86,978 87,847 85,088 86,347 1 Ratios 2019 2021 2022 0.578 0.19 1% 10% 95% 19% 1% 0.71% 14% 0.2 0.15 0.41 41% 35% 243% 0.052 0.038 147.69 1.655 2% 366454% 188738 2 3 Profitability Ratio 4 Gross Profit Margin 5 Operating Profit Margin 6 Netprofit Margin 7 Total Return on Assets 8 Net Return on Total Assets 9 Return on Stockholders Equity 10 Return on invested Capital 11 Earnings per Share 12 13 Liquidity Ratios 14 Current Ratio 15 Working Capital 16 17 Leverage Ratios 18 Total debt to assets ratio 19 Long term debt to capital ratio 20 Debt to Equity Ratio 21 Long term debt to equity ratio 22 Times Interest earned 23 24 Activity Ratios 25 Days of inventory 26 Inventory turnover 27 Average collection period 28 29 Other 30 Dividend yield on common stock 31 Price earnings ratio 32 Dividend payout ratio 33 Internal cash flow 34 Free cash flow 35 0.022 0.99 0.03 0.992 0.2 0.15 0.138 0.087 36 B Jan. 01, 2022 E D Jan. 02, 2021 Jan. 01, 2020 $ 312,189 109.530 318,864 29,584 770,167 119,044 54,971 54,293 95,314 2,575 1,096,364 S 253,283 65,417 140, 111 17,686 476,497 78,075 34,090 54,293 92,078 2,034 737,067 $127,467 85,866 138,782 15,279 367,414 77,379 34,963 54,293 91,467 886 627,452 1 CONSOLIDATED BALANCE SHEETS - USD ($) $ in Thousands 2 Current assets 3 Cash 4. Accounts receivable, net 5 Inventory 6 Prepaid expenses and other current assets ds, 7 Total current assets 8 Property and equipment, net 9 Operating lease right-of-use assets 10 Goodwill 11 Intangible assets, net 12 Other assets 13 Total assets 14 Current liabilities 15 Accounts payable 16 Accrued expenses and other current liabilities 17 Taxes payable 18 Accrued payroll and related costs 19 Operating lease liabilities 20 Current maturities of long-term debt 21 Total current liabilities 22 Total long-term debt, net 23 Operating lease liabilities, non-current 24 Other liabilities 25 Total liabilities 26 Commitments and contingencies (Note 13) 27 Stockholders' Equity Common stock, par value $0.01; 600,000 shares authorized: 87.727 and 87,128 shares 28 outstanding at January 1, 2022 and January 2, 2021, respectively 29 Preferred stock, par value $10:30,000 shares authorized; no shares issued or outstanding 30 Additional paid in capital 31 Retained earnings (accumulated deficit) 32 Accumulated other comprehensive Income (loss) 33 Total stockholders' equity 34 Total liabilities and stockholders' equity 35 36 Balance Sheet Income Statement Cash Flows Yeti... 191,319 132,309 14,514 30,844 10,167 24,560 403,713 95,741 55,940 23,147 578,541 123,621 89,068 18,316 25,810 8,247 22,697 287,759 111,017 36,546 13,327 448,649 41,447 42,003 12,687 8,002 8,086 18,941 131,166 270,846 38,589 17,822 458,423 877 871 0 337,735 178,858 353 517,823 $ 1,096,364 0 321,678 (33,744) (387) 288,418 $ 737,067 870 0 315,405 -147,583 337 169,029 $627,452 File Home Insert Draw Page Layout Formulas Data Review View Help Comments B11 fi 1 B D E 2 C 12 Months Ended Jan. 02, 2021 Jan. 01, 2022 Dec. 28, 2019 $ 212,602 $ 155,801 $ 50,434 CONSOLIDATED STATEMENTS OF COMPREHENSIVE INCOME- USD ($) $ in Thousands 3 Net Income (Loss) Attributable to Parent (Abstract] 4 Net Income 5 Other comprehensive income (loss) 6 Foreign currency translation adjustments 17 Total comprehensive income 8 9 10 11 12 13 14 740 $ 213,342 (391) $ 155,410 98 $ 50,532 15. File Home Insert Draw Page Layout Formulas Data Review View Help Comments 111 H21 Cells C E B Jan. 01, 2022 D Dec. 28, 2019 Jan 02, 2021 $ 212,602 $ 155,801 $ 50,434 30,535 935 9,009 32,070 679 15,474 5,147 2,473 0 1,022 (3,827) 1,051 1,064 (74) 28,959 2.189 52,332 15,615 616 643 0 (44,681) (179,803) (10,587) 112,773 (3,781) 3,132 146,520 16,353 46,052 1,982 89,125 14,943 3,478 366,427 (19,940) (40,541) (6,798) 6,614 (3,101) (129) 86,893 CONOCORTCUT CTCW VOIROTTWEWS 2 3 Cash Flows from Operating Activities: 4 Net income 5 Adjustments to reconcile net income to cash provided by operating activities: 6 Depreciation and amortization 7 Amortization of deferred financing fees ands, 8 Stock-based compensation 9 Deferred income taxes 10 Impairment of long-lived assets 11 Loss on prepayment, modification, or extinguishment of debt 12 Other 13. Changes in operating assets and liabilities: 14 Accounts receivable, net 15. Inventory 16 Other current assets 17 Accounts payable and accrued expenses 18 Taxes payable 19 Other 20 Net cash provided by operating activities 21 Cash Flows from Investing Activities: 22 Purchases of property and equipment 23 Additions of intangibles.net 24 Net cash used in investing activities 25 Cash Flows from Financing Activities: 26 Repayments of long-term debt 27 Proceeds from employee stock transactions 28 Taxes paid in connection with employee stock transactions 29 Finance lease principal payment 30 Borrowings under revolving line of credit 31 Repayments under revolving credit facility 32 Repayments of Term Loan A in connection with amendment 33. Proceeds from borrowings in connection with amendment 34 Payments of deferred financing fees 35 Dividends 36 Net cash used in financing activities 37 Effect of exchange rate changes on cash 38 Net increase (decrease) in cash 39 Cash, beginning of period 40 Cash, end of period Balance Sheet Income Statement Cash Flows Ready Accessibility: Good to 90 (56,121) 19,635) (65,756) (15,566) (7,378) (22,944 (32,077) (16,614) (48,691) (22,500) 4,095 (3,506) (1,108) 0 0 (34,875) 3,561 (13,516) (74) 0 O 0 0 0 (23,019) 1,161 58,906 253,283 $312,189 (165,000) 3,022 (1.028) (185) 50,000 (50,000) 0 0 0 0 163,191) 476 180,768 72,515 $ 253,283 (04,250) 66,238 (2,135) (636) (45,687) (51) (7,536) 80,051 $ 72,515 Yeti...t 12 Months Ended Jan 02, 2021 Jan. 01, 2022 Dec. 28, 2019 1 CONSOLIDATED STATEMENTS OF OPERATIONS - USD ($) shares in Thousands, $ in 2 Thousands 3. Income Statement (Abstract) 4. Net sales Cost of goods sold 6 Gross profit 7 Selling general, and administrative expenses 8 Operating income 9 Interest expense 10 Other (expense) Income 11 Income before income taxes 12 Income tax expense 13 Net Income 14 Net income per share 15 Basic (in dollars per share) 16 Diluted (in dollars per share) 17 Weighted-average common shares outstanding 18 Basic (in shares) 19 Diluted (In shares) 20 21 22 23 24 $ 1,410,989 594,876 816,113 541,175 274,938 (3,339) (3,189) 268,410 (55,808) $ 212,602 $ 1,091,721 462,918 628,803 414,570 214,233 (9,155) 123 205,201 (49,400) $ 155,801 $ 913.734 438,420 475,314 385,543 89,771 (21,779) (734) 67,258 (16,824) $ 50,434 $ 2.43 $2.40 $ 1.79 $ 1.77 $ 0.59 $ 0.58 87,425 88,666 86,978 87,847 85,088 86,347 


Step by Step Solution
There are 3 Steps involved in it
Step: 1

Get Instant Access to Expert-Tailored Solutions
See step-by-step solutions with expert insights and AI powered tools for academic success
Step: 2

Step: 3

Ace Your Homework with AI
Get the answers you need in no time with our AI-driven, step-by-step assistance
Get Started


