Answered step by step
Verified Expert Solution
Question
1 Approved Answer
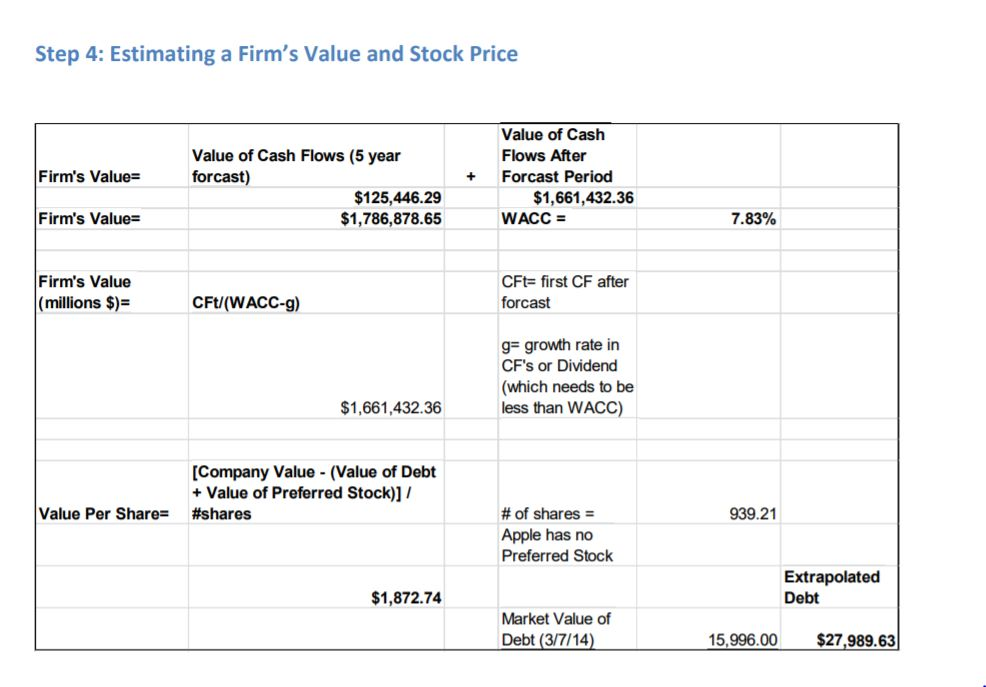
I have to create the above chart for Best Buy Inc. Here is the link for the Best Buy Data. http://financials.morningstar.com/income-statement/is.html?t=0P000000RH&culture=en-US&platform=sal Step 4: Estimating a

I have to create the above chart for Best Buy Inc.
Here is the link for the Best Buy Data.
http://financials.morningstar.com/income-statement/is.html?t=0P000000RH&culture=en-US&platform=sal
Step 4: Estimating a Firm's Value and Stock Price Value of Cash Flows After Value of Cash Flows (5 year forcast) Firm's Value + Forcast Period $125,446.29 $1,786,878.65 $1,661,432.36 Firm's Value- WACC Firm's Value (millions $)- CFt- first CF after forcast CFt/(WACC-g) g- growth rate in CF's or Dividend (which needs to be less than WACC) $1,661,432.36 [Company Value (Value of Debt +Value of Preferred Stock)]/ #shares 939.21 # of shares Apple has no Preferred Stock Value Per Share- Extrapolated Debt $1,872.74 Market Value of Debt (3/7/14 15,996.00 $27,989.63 Step 4: Estimating a Firm's Value and Stock Price Value of Cash Flows After Value of Cash Flows (5 year forcast) Firm's Value + Forcast Period $125,446.29 $1,786,878.65 $1,661,432.36 Firm's Value- WACC Firm's Value (millions $)- CFt- first CF after forcast CFt/(WACC-g) g- growth rate in CF's or Dividend (which needs to be less than WACC) $1,661,432.36 [Company Value (Value of Debt +Value of Preferred Stock)]/ #shares 939.21 # of shares Apple has no Preferred Stock Value Per Share- Extrapolated Debt $1,872.74 Market Value of Debt (3/7/14 15,996.00 $27,989.63Step by Step Solution
There are 3 Steps involved in it
Step: 1

Get Instant Access to Expert-Tailored Solutions
See step-by-step solutions with expert insights and AI powered tools for academic success
Step: 2

Step: 3

Ace Your Homework with AI
Get the answers you need in no time with our AI-driven, step-by-step assistance
Get Started


